


Total staff
176
Employees
148
Contractors
28
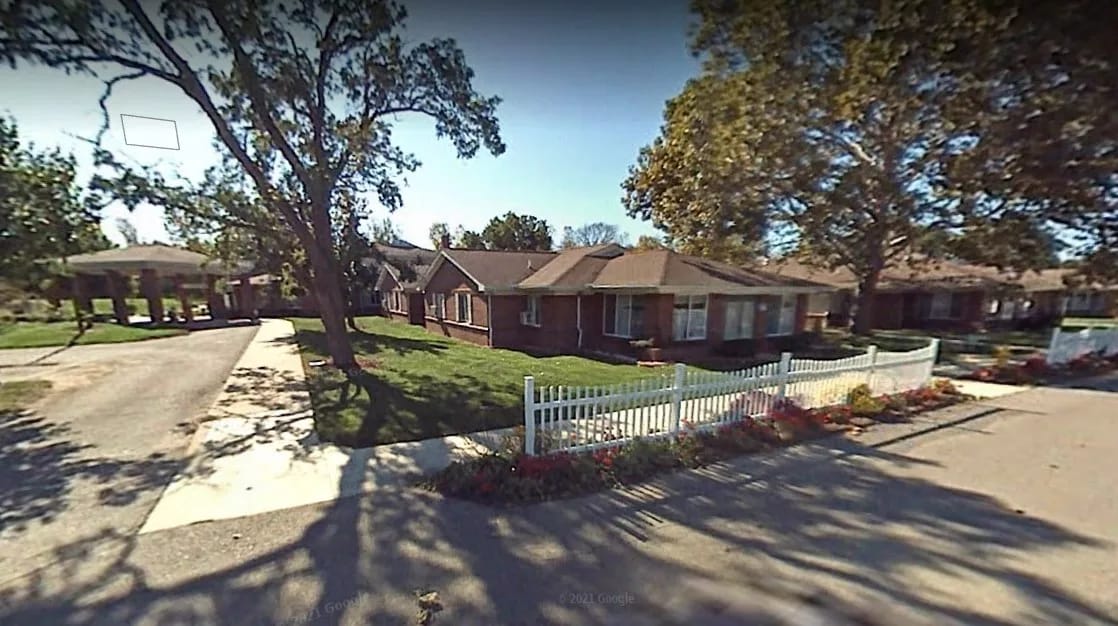
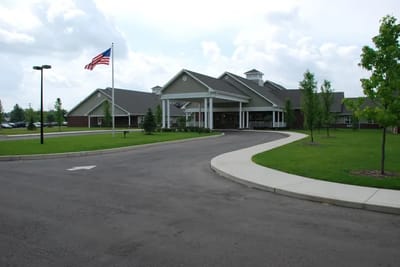
Owned by Dr. Melissa Ake, Fountain View of Monroe is a 119-bed nursing home in Monroe, Michigan, in the Frenchtown Charter Township area, not far from a nearby hospital. The community offers skilled nursing, hospice, palliative, and respite care. It combines long-term nursing care with rehabilitation for residents recovering from an illness, surgery, or hospital stay.
Residents receive an average of about 3 hours and 44 minutes of total nursing care each day from registered nurses, licensed practical nurses, and certified nursing assistants. Nursing staff also provide support 24 hours a day. The facility is close to full occupancy. The average length of stay is about 58 days, which is a mix of short-term rehabilitation and longer-term nursing care. Fountain View of Monroe accepts Medicare and private pay.
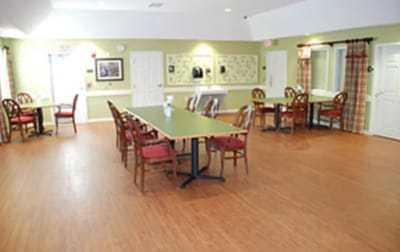
Residents have access to on-site dental care, laboratory and radiology services, pharmacy services, podiatry, pain management, and advanced wound care. Hospice and palliative care are also available. The community has shared dining areas, an ice cream parlor, a library, and a salon and barbershop. A resident council meets regularly to provide feedback on community policies and daily life.
The area has a Walk Score of 32 out of 100. A handful of nearby destinations may be within walking distance, but most errands and appointments require a car. Families considering Fountain View of Monroe should ask how rehabilitation and therapy schedules are tailored to each resident’s care needs.
| Staff type | Hours / Day / Resident | vs state avg |
|---|---|---|
|
Registered Nurse (RN)
| 46m per day | ■ Avg State avg: 46m per day · National avg: 41m per day |
|
LPN / LVN
| 1h 3m per day | ▲ 18% State avg: 53m per day · National avg: 52m per day |
|
Nurse Aide
| 1h 49m per day | ▼ 24% State avg: 2h 23m per day · National avg: 2h 21m per day |
|
Weekend Total Nursing
| 3h 17m per day | ▼ 7% State avg: 3h 31m per day · National avg: 3h 26m per day |
|
Physical Therapist
| 6m per day | ▲ 61% State avg: 4m per day · National avg: 4m per day |
|
Weekend RN
| 27m per day | ▼ 5% State avg: 29m per day · National avg: 29m per day |
Reporting period: October 1 – December 31, 2025 (Q4 2025). Source: CMS Payroll-Based Journal report.
Manages medical care and health needs.
Assists with medical care and medications.
Helps with daily care and mobility.
Total hours from contractors
5,071 contractor hours this quarter
| Certified Nursing Assistant | 65 | 0 | 65 | 17,867 | 92 | 100% | 6.8 |
| Licensed Practical Nurse | 34 | 0 | 34 | 10,135 | 92 | 100% | 8.7 |
| Registered Nurse | 23 | 0 | 23 | 5,807 | 92 | 100% | 9 |
| Other Dietary Services Staff | 8 | 0 | 8 | 2,500 | 92 | 100% | 7.1 |
| Clinical Nurse Specialist | 3 | 2 | 5 | 1,614 | 72 | 78% | 8.5 |
| Speech Language Pathologist | 0 | 4 | 4 | 1,362 | 71 | 77% | 7.4 |
| Physical Therapy Assistant | 0 | 7 | 7 | 1,127 | 82 | 89% | 6.5 |
| Respiratory Therapy Technician | 0 | 6 | 6 | 1,100 | 85 | 92% | 7.2 |
| Nurse Aide in Training | 4 | 0 | 4 | 833 | 61 | 66% | 7.6 |
| Physical Therapy Aide | 0 | 4 | 4 | 785 | 82 | 89% | 6.4 |
| Mental Health Service Worker | 3 | 0 | 3 | 634 | 59 | 64% | 7.9 |
| RN Director of Nursing | 2 | 0 | 2 | 577 | 66 | 72% | 8.5 |
| Qualified Social Worker | 0 | 3 | 3 | 543 | 79 | 86% | 5.4 |
| Nurse Practitioner | 1 | 0 | 1 | 488 | 61 | 66% | 8 |
| Occupational Therapy Aide | 1 | 0 | 1 | 488 | 61 | 66% | 8 |
| Dietitian | 1 | 0 | 1 | 466 | 55 | 60% | 8.5 |
| Administrator | 1 | 0 | 1 | 448 | 56 | 61% | 8 |
| Dental Services Staff | 2 | 0 | 2 | 295 | 38 | 41% | 7.5 |
| Occupational Therapy Assistant | 0 | 1 | 1 | 92 | 48 | 52% | 1.9 |
| Medical Director | 0 | 1 | 1 | 30 | 14 | 15% | 2.1 |
Federal penalties imposed by CMS for regulatory violations, including civil money penalties (fines) and denials of payment for new Medicare/Medicaid admissions.
Source: CMS Penalties Database
No penalties in the past 3 years
No civil money penalties or payment denials were reported in the last 3 years.
These measures show how residents usually do over time at this home, based on health outcomes and preventive care.
Michigan average: 8.4
Michigan average: 16.3
Michigan average: 12.5%
Michigan average: 15.3%
Michigan average: 21.0%
Michigan average: 3.2%
Michigan average: 5.7%
Michigan average: 1.7%
Michigan average: 5.7%
Michigan average: 3.9%
Michigan average: 15.0%
Michigan average: 94.9%
Michigan average: 95.0%
Michigan average: 1.74
Michigan average: 1.54
Michigan average: 82.5%
Michigan average: 1.4%
Michigan average: 79.5%
Michigan average: 24.2%
Michigan average: 11.5%
Michigan average: 0.8%
Michigan average: 53.7%
Michigan average: 50.6%
Quality measures are calculated from Minimum Data Set (MDS) assessments. For most measures, lower percentages indicate better care quality.
28% of new residents, usually for short-term rehab.
72% of new residents, often for short stays.
Source: CMS Long-Term Care Facility Characteristics (Data as of Jan 2026)
Residents meet regularly to discuss policies, care quality, and activities
Organized group of residents that meets regularly to discuss facility policies, quality of life, and activities.
Data sourced from CMS Long-Term Care Facility Characteristics quarterly report. Payer mix reflects the current resident census by primary payment source.
Historical financial and operational data for Fountain View of Monroe from 2011–2023, based on CMS SNF Cost Reports.
Key figures below are for fiscal year ending in 12/2023.
Based on CMS SNF Cost Report for fiscal year ending in 12/2023.
Residents typically stay for brief periods, with frequent admissions and discharges throughout the year.
Most new residents arrive under private pay (72% of admissions), and a typical private pay stay runs around 2 - 3 months.
Coverage residents most often arrive under.
Coverage residents most often leave under.
![]() 1.9 miles from city center
1.9 miles from city center
![]() Estimated distance in miles from Monroe's city center to Fountain View of Monroe's address, calculated via Google Maps.
— 14.96 miles to nearest hospital (Oakwood Southshore Medical Center Pth)
Estimated distance in miles from Monroe's city center to Fountain View of Monroe's address, calculated via Google Maps.
— 14.96 miles to nearest hospital (Oakwood Southshore Medical Center Pth)
Add your location
Info below is compiled from CMS reports & the MI Licensing & Regulatory Affairs (LARA), senior community websites & trusted data sources such as Walk Score & BBB.
Communities are listed from highest to lowest based on our ranking methodology.
| Medilodge of Monroe | NH PC RC SNF | Monroe | 103
Facility
103
MI AVG
74
Rank
#112 / 430 |
88.3%
Facility
88.3%
MI AVG
74
Rank
#45 / 119 | +19% | 3.61 | -34% | -16% | $0 | 7 | 1.8 | 1 | 91 | A+ |
72
Facility
72
MI AVG
39
Rank
#63 / 703 | - | $11.0MFiscal year ending 12/2023 | $5.7MFiscal year ending 12/2023 | 52.2%Fiscal year ending 12/2023 | 235563 | ||||
| Fountain View of Monroe | NH HOS PC RC SNF | Monroe (Frenchtown Charter Township) | 119
Facility
119
MI AVG
74
Rank
#78 / 430 |
93.8%
Facility
93.8%
MI AVG
74
Rank
#22 / 119 | +27% | 3.74 | +28% | -13% | $0 | 6 | 2.0 | - | 112 | - |
32
Facility
32
MI AVG
39
Rank
#417 / 703 | Dr. Melissa Ake | $16.2MFiscal year ending 12/2023 | $7.6MFiscal year ending 12/2023 | 47.1%Fiscal year ending 12/2023 | 235225 | ||||
| Monroe Springs Rehab and Nursing Center | NH SNF | Monroe (Frenchtown Charter Township) | 89
Facility
89
MI AVG
74
Rank
#162 / 430 |
89.7%
Facility
89.7%
MI AVG
74
Rank
#40 / 119 | +21% | 3.95 | -15% | -8% | $0 | 11 | 3.7 | - | 80 | - |
32
Facility
32
MI AVG
39
Rank
#417 / 703 | Gail Saba | $9.6M*Fiscal year ending 12/2022These figures are from this home's most recent complete cost report — an older period than most facilities report. Compare with that in mind. | $5.2M*Fiscal year ending 12/2022These figures are from this home's most recent complete cost report — an older period than most facilities report. Compare with that in mind. | 53.7%*Fiscal year ending 12/2022These figures are from this home's most recent complete cost report — an older period than most facilities report. Compare with that in mind. | 235520 | ||||
| Seacrest Rehabilitation and Nursing Center | NH HOS MC RC SNF | Monroe (Frenchtown Charter Township) | 131
Facility
131
MI AVG
74
Rank
#54 / 430 |
69.9%
Facility
69.9%
MI AVG
74
Rank
#77 / 119 | -6% | 3.68 | -49% | -14% | $0 | 17 | 4.3 | - | 92 | - |
53
Facility
53
MI AVG
39
Rank
#190 / 703 | Renewal Healthcare LLC | $6.6MFiscal year ending 12/2023 | $4.3MFiscal year ending 12/2023 | 65.7%Fiscal year ending 12/2023 | 235232 |
Fountain View of Monroe is located in Monroe, Michigan.
Here are the financial assistance programs available to residents in Michigan.
Fountain View of Monroe is in the Frenchtown Charter Township neighborhood.
Fountain View of Monroe has a walk score of 32. Somewhat walkable. A few nearby services may be reachable on foot, but most trips require transportation.
Fountain View of Monroe's occupancy is 90.9%.
No, Fountain View of Monroe has a no-pet policy.
Fountain View of Monroe is registered as a for-profit.
Yes — there are 3 photos of Fountain View of Monroe in the photo gallery on this page.
Fountain View of Monroe is located at 1971 N Monroe St, Monroe, MI 48162.
Care Cost Calculator: See Prices in Your Area
Nursing Home Data Explorer
Don’t Wait Too Long: 7 Red Flag Signs Your Parent Needs Assisted Living Now
The True Cost of Assisted Living in 2025 – And How Families Are Paying For It
Understanding Senior Living Costs: Pricing Models, Discounts & Financial Assistance


