Explore Open Rooms
1 Contact details
2 What type of senior care service are you looking for?
3 What budget do you have in mind for senior care?
4 How soon do you need to find care?
5 Additional details

Thank you for your interest!

Our team will be in touch shortly to help with next steps.

Independent Living in North Charleston

CMS overall rating Info The Overall CMS Rating combines results from health inspections, staffing levels and quality measures. Health inspections carry the most weight. Staffing and quality scores can increase or decrease the final rating based on performance compared to state and national standards.

Franke at Seaside

Overview of Franke at Seaside

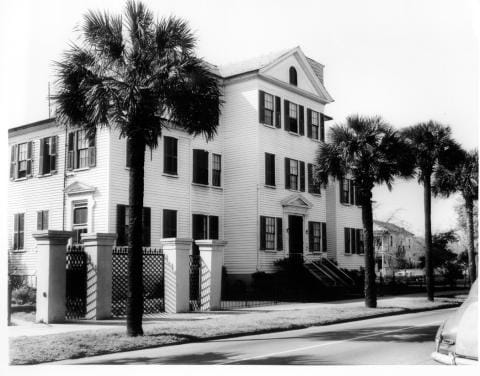
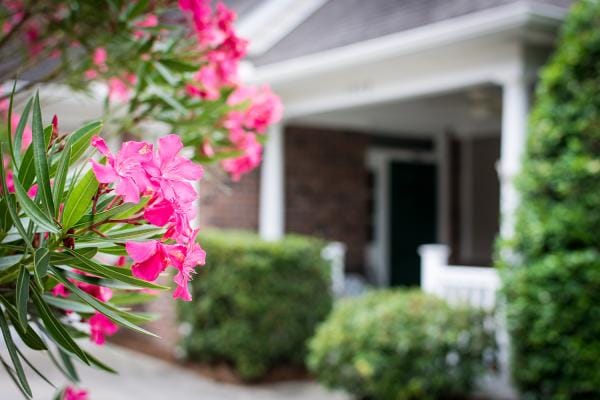
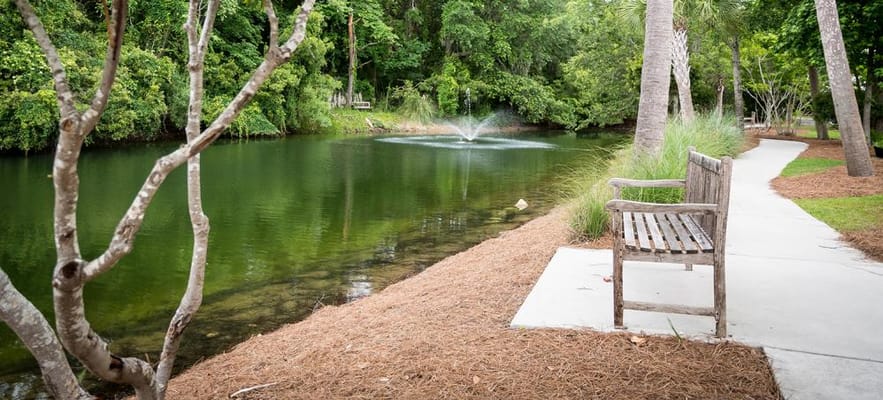
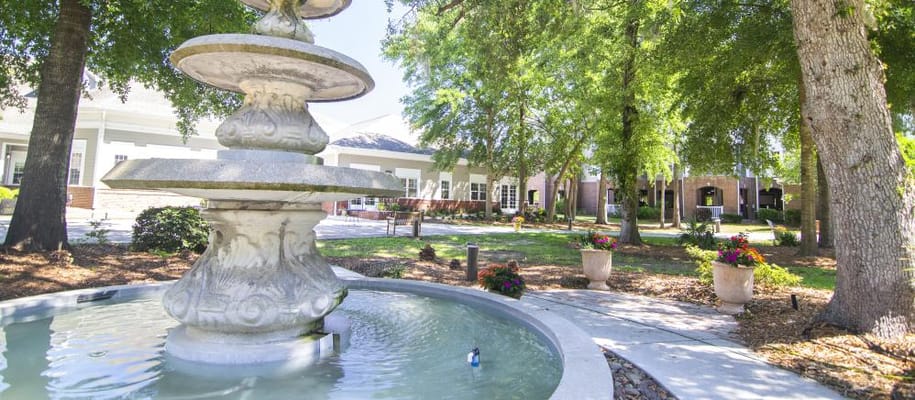
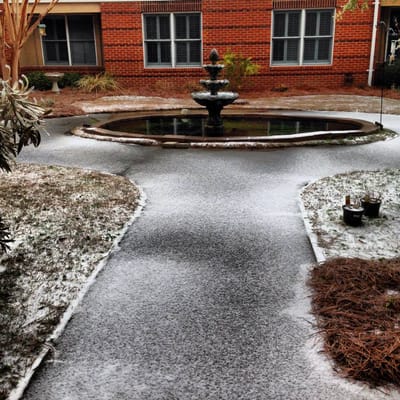
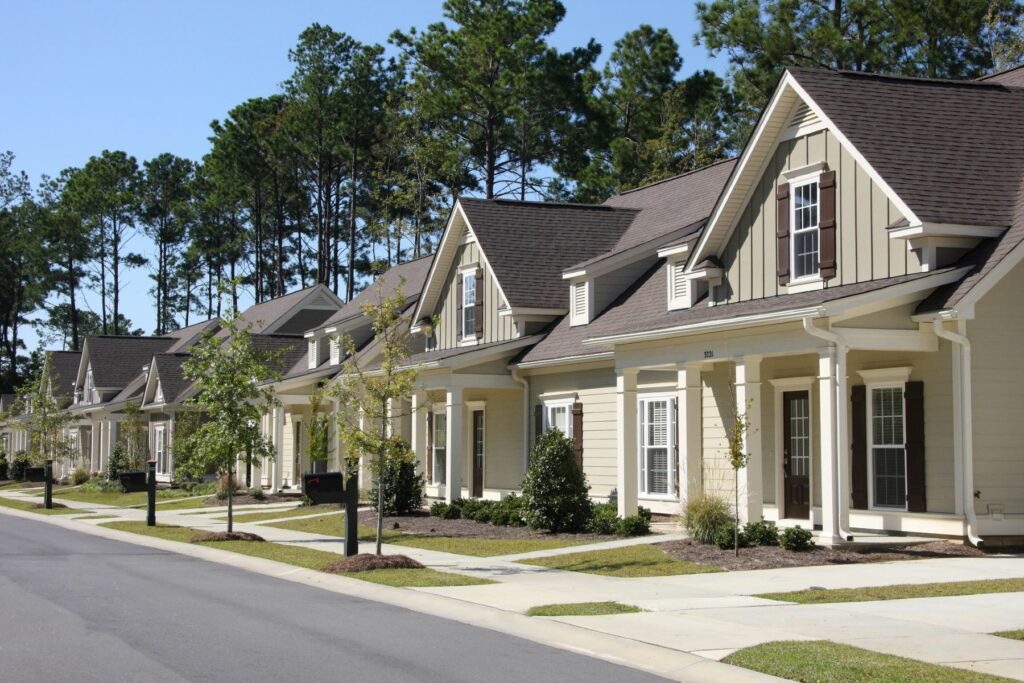
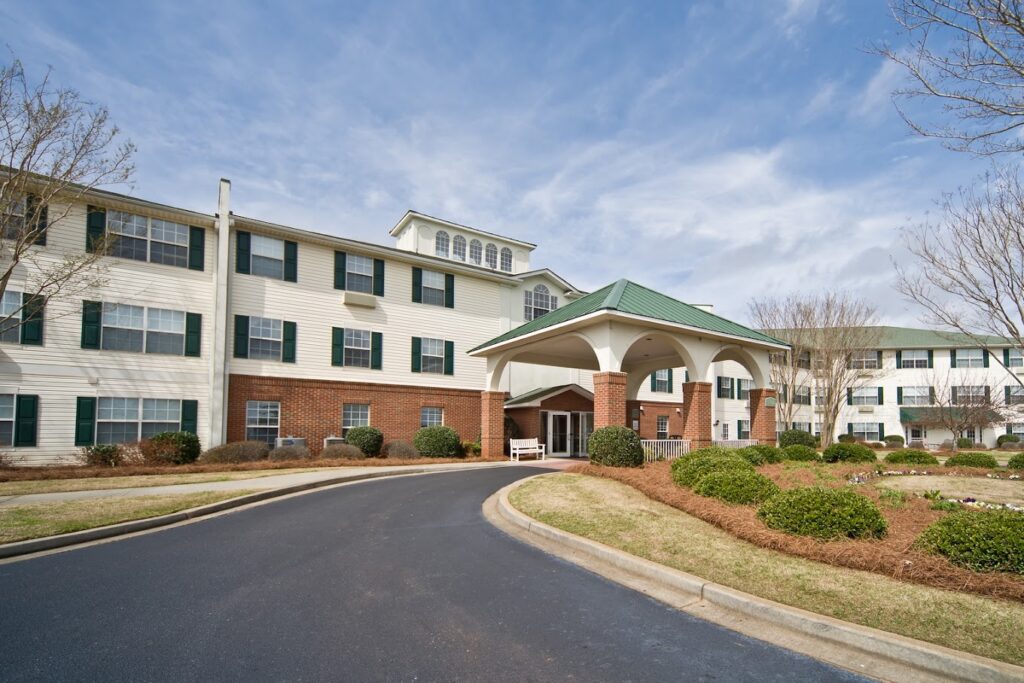
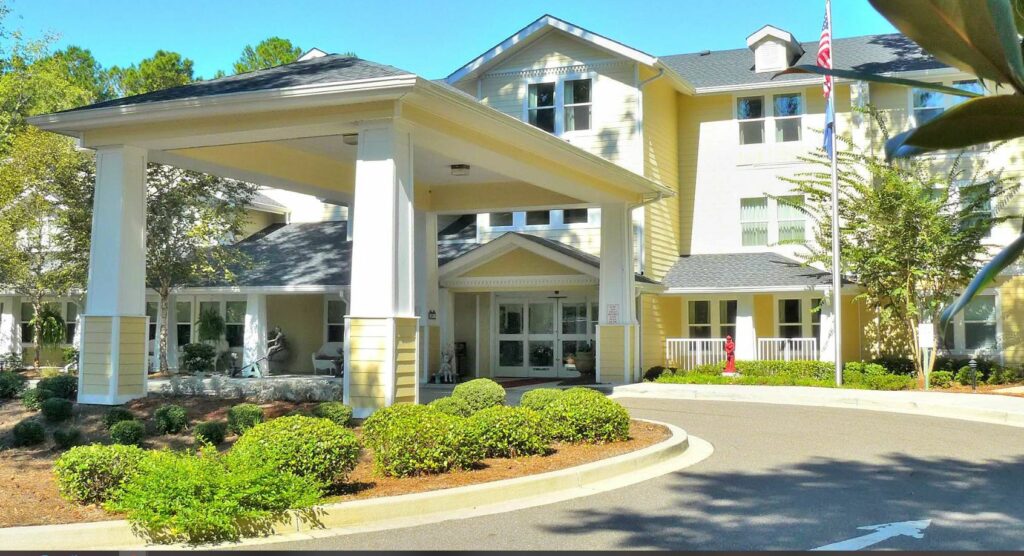
Franke at Seaside, a nonprofit retirement community located in the tranquil landscape of Mount Pleasant, South Carolina, offers a vibrant retirement experience. Situated amidst stunning lagoons and serene natural surroundings, this community provides a range of care options, including independent living facilities, residential assisted living, memory support, long-term care, rehabilitation, and nursing services. Its well-designed campus encourages curiosity and adventure, making it an ideal place for mindfulness and a peaceful retirement.

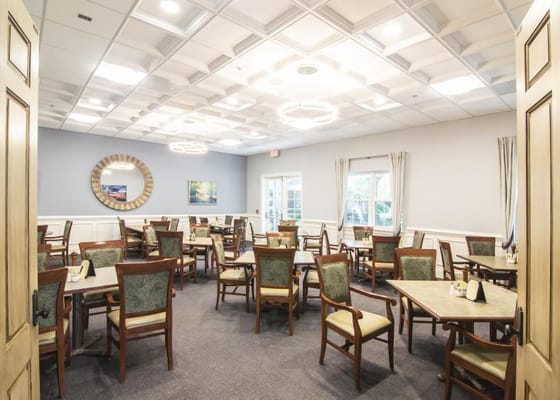
Residents here can also enjoy various amenities, including housekeeping and meal services, along with well-maintained grounds. Located conveniently near downtown Charleston, seniors have easy access to local conveniences. On-campus, they’ll find a full-time chaplain, card room, living room, library, and a hair salon. Concierge services are available as well, and the community is well-equipped with a fitness center offering a variety of programs and activities. Additionally, there’s a heated saltwater swimming pool to enhance the retirement experience. All of this is complemented by a dedicated and exceptional staff, making Franke at Seaside a sought-after destination for independent living homes.

(843) 856-4700

Quality ratings

Measured by Centers for Medicare & Medicaid Services (CMS)

Overall rating Info The Overall CMS Rating combines results from health inspections, staffing levels and quality measures. Health inspections carry the most weight. Staffing and quality scores can increase or decrease the final rating based on performance compared to state and national standards.
3/5
South Carolina average: 2.9/5
Health Inspection Info Based on the results of the facility's three most recent standard inspections and any complaint investigations. CMS reviews the number, scope, and severity of deficiencies, with more recent findings weighted more heavily.
3/5
South Carolina average: 2.8/5
Staffing Info Measures average nursing staff hours per resident per day, including Registered Nurses (RNs) and total nursing staff. Ratings are adjusted based on the level of care residents require and are compared to state and national benchmarks.
3/5
South Carolina average: 3.0/5
Quality Measures Info Based on clinical and physical health indicators reported to CMS, such as hospital readmissions, falls, pressure ulcers, and improvements in mobility. These measures reflect how well residents' health needs are being managed.
4/5
South Carolina average: 3.5/5

Nursing care per resident

Info This shows how many total hours of nursing staff time are available per resident each day. Higher numbers usually mean more staff support.
4h 7m per day

This home provides 0% more nursing time per resident than the South Carolina average.

South Carolina average: 4h 5m per day

Capacity and availability

Smaller home

May offer a more intimate, personalized care environment.

Total beds 44

This home usually has limited availability

Occupancy is moderate, suggesting balanced demand.

Similar demand to the South Carolina average
Occupancy rate 85.6%
Residents per day (avg) 40
Occupancy rate
85.6%
Residents per day (avg)
40

Who this home usually serves

TYPE OF STAY

Mostly short-term rehab stays

Most residents typically stay for a few weeks or months before returning home or moving on.

Might be optimal for
Short stays Recovery Medicare-covered care

Breakdown by payment type

Medicare

58% of new residents, usually for short-term rehab.

Typical stay 1 months

Private pay

42% of new residents, often for short stays.

Typical stay 2 years

Finances and operations

Voluntary non-profit community
Operated by a church.
Home revenue
$23.2M
Surplus of revenue
$23.5K
Voluntary non-profit community Operated by a church.
Home revenue
$23.2M
Surplus of revenue
$23.5K
Payroll costs Info The portion of the home's budget spent on staff, including nurses, caregivers, and other employees who support care and operations.
$7.0M
30% of revenue
Other operating costs Info All remaining costs needed to run the home, such as food, utilities, building maintenance, supplies and administrative expenses.
$16.2M
Total costs $23.2M
Bed community size
44-bed community
A moderately sized community that may balance personal attention with shared amenities and social activities.
Walk Score
Walk Score: 53 / 100
Moderately walkable. Some errands can be accomplished on foot, with a mix of nearby amenities.
BBB Rating
BBB Rating: A+ (Not Accredited)
An independent rating from the Better Business Bureau based on factors such as complaint history, transparency, and business practices.
How BBB ratings work

About this community

License Details

Facility TypeNursing Homes
StatusActive
ExpirationJuly 31, 2026
CountyCharleston

Additional Licensing Details

License NumberNCF-0800

Ownership & Operating Entity

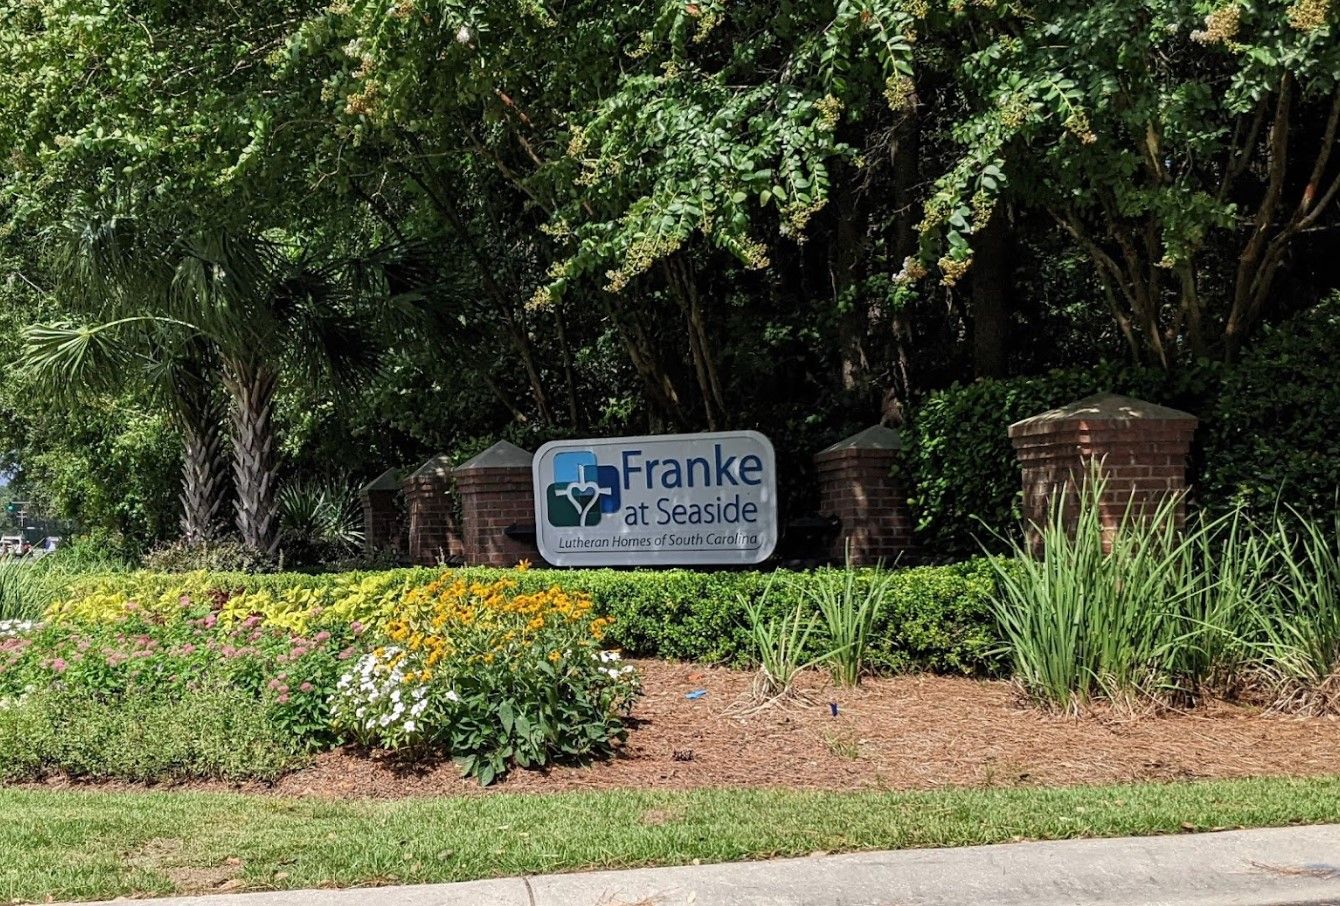
Franke at Seaside is legally operated by Lutheran Homes Of South Carolina Inc, and administrated by Stoll, Sandy A.

Ownership TypeNon-Profit Corporation

Type Of Units

Nursing Home
44 units
Total beds
44 units

Staffing

Key information about the people who lead and staff this community.

Leadership

ContactMs. Sandy Stoll, Administrator

Staff Composition

Total Employees
245
Full-Time Employees
245

Therapy & Rehabilitation

1 service
Rehabilitation Services

Staffing & Medical

3 services
Nursing Services
Skilled Nursing
Licensed Nurses/CNAs

Memory & Specialized Care

2 services
Offers Alzheimer's Care
Dedicated Alzheimer's Unit

Additional Services

3 services
Memory Support
Long Term Care
Rehabilitation

Contact Information

Amenities & Lifestyle

0 amenities
Specific ProgramsIndependent Living, Assisted Living & Memory Support, Long Term Care, Rehabilitation & Nursing, Community Programs, Events

Dining & Nutrition

Food DescriptionFranke at Seaside offers restaurant-style dining with multiple venues including the Palmetto Dining Room, Sweetgrass Café, and Seaside Grill, featuring a diverse menu prepared by executive chefs.

What does this home offer?

Housing options icon

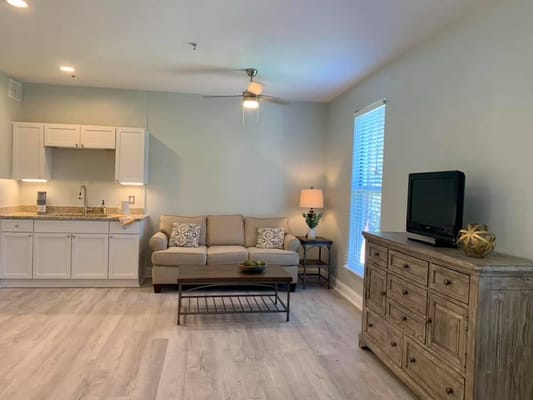
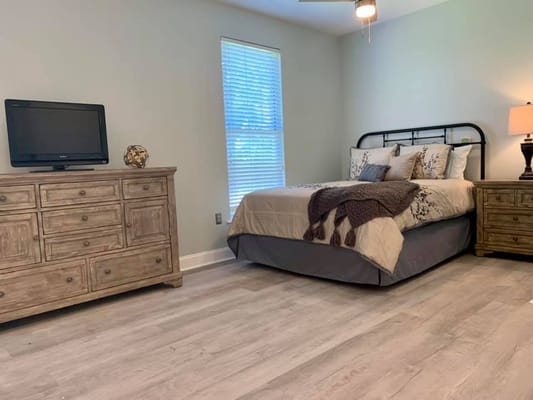
Housing Options: Private Rooms

Building type icon
Building type icon

Building Type: Single-story

Transportation services icon

Transportation Services

Fitness and recreation icon

Fitness and Recreation

Types of Care at Franke at Seaside

Independent Living Assisted Living Memory Care Nursing Home

Contact Franke at Seaside

Inspection History

In South Carolina, the Department of Public Health, Bureau of Healthcare Quality conducts unannounced inspections to ensure care providers meet all health and safety codes.

3 visits/inspections

2 routine inspections

Results

3 with issues

0 without issues

Latest inspection

Date April 17, 2025
Routine

9 deficiencies

Deficiencies indicate regulatory issues. A higher number implies the facility had several areas requiring improvement.

South Carolina average: 12 deficiencies

Health Inspection History

Inspections
Total health inspections 3

South Carolina average 3.9


Last Health inspection on Apr 2025

Total health citations 9

South Carolina average 13.7

Citations per inspection
3

South Carolina average 3.44


Health citations are formal notices following inspections when they fail to comply with safety and care standards.

All 9 citations resulted from standard inspections.

Breakdown of citation severity (last 3 years)
Critical Health citations More info 0
100% better than South Carolina average

South Carolina average: 1


Serious Health citations More info 0
100% better than South Carolina average

South Carolina average: 0.3

0 critical citations More info South Carolina average: 1

0 serious citations More info South Carolina average: 0.3

9 moderate citations More info South Carolina average: 12.3

0 minor citations More info South Carolina average: 0.1
Citations history (last 3 years)
Nutrition moderate citation Info Issues related to food quality, meal service, and resident's nutritional needs. Apr 17, 2025
Corrected

Nutrition moderate citation Info Issues related to food quality, meal service, and resident's nutritional needs. Apr 17, 2025
Corrected

Pharmacy moderate citation Info Issues related to medication management, including how drugs are stored, administered, and monitored. Apr 17, 2025
Corrected

Pharmacy moderate citation Info Issues related to medication management, including how drugs are stored, administered, and monitored. Mar 05, 2024
Corrected

Compare Independent Living around North Charleston The information below is reported by the South Carolina Department of Public Health, Bureau of Healthcare Quality.

Filter by care type
Somerby Mount Pleasant
AL

Assisted Living A licensed, long-term care setting for seniors or individuals with disabilities who need help with daily activities — like bathing, dressing, and medication management — but not 24-hour skilled nursing. Offers housing, meals, and around-the-clock support while aiming to maximize resident independence.

IL

Independent Living Lifestyle-focused communities for older adults offering dining, activities, and transportation with minimal personal care. Best for active, independent seniors who want community without medical support.

MC

Memory Care Secured, specialized care for people living with Alzheimer's or dementia. Staff trained in cognitive impairment, with higher staff-to-resident ratios and an environment designed to reduce confusion and wandering risk.

Mt Pleasant
118
Yes
7
Private Rooms
-
Franke at Seaside
AL

Assisted Living A licensed, long-term care setting for seniors or individuals with disabilities who need help with daily activities — like bathing, dressing, and medication management — but not 24-hour skilled nursing. Offers housing, meals, and around-the-clock support while aiming to maximize resident independence.

IL

Independent Living Lifestyle-focused communities for older adults offering dining, activities, and transportation with minimal personal care. Best for active, independent seniors who want community without medical support.

MC

Memory Care Secured, specialized care for people living with Alzheimer's or dementia. Staff trained in cognitive impairment, with higher staff-to-resident ratios and an environment designed to reduce confusion and wandering risk.

NH

Nursing Home Licensed facility providing 24/7 skilled nursing care for residents with complex, ongoing medical needs. Staffed by RNs, LPNs, and CNAs. Inspected and star-rated annually by CMS. Accepts Medicare (short-term rehab) and Medicaid (long-term care).

Mt Pleasant
115
No
53
Private Rooms
A+
The Legacy of Anderson
IL

Independent Living Lifestyle-focused communities for older adults offering dining, activities, and transportation with minimal personal care. Best for active, independent seniors who want community without medical support.

Anderson
-
Yes
28
Private Rooms
-
Ashley Park by Barclay House
AL

Assisted Living A licensed, long-term care setting for seniors or individuals with disabilities who need help with daily activities — like bathing, dressing, and medication management — but not 24-hour skilled nursing. Offers housing, meals, and around-the-clock support while aiming to maximize resident independence.

IL

Independent Living Lifestyle-focused communities for older adults offering dining, activities, and transportation with minimal personal care. Best for active, independent seniors who want community without medical support.

Charleston (West Ashley)
-
Yes
49
Private Rooms
-

Places of interest near Franke at Seaside

Address 14.9 miles from city center — 1.84 miles to nearest hospital (Novant Health East Cooper Medical Center)

Calculate Travel Distance to Franke at Seaside

Add your location

Address

Staffing Data (Q2 2025)

This data corresponds to Q2 2025 and is based on CMS Payroll-Based Journal.

Total staff 70
Employees 51
Contractors 19
Staff to resident ratio 1.71:1
5% worse than South Carolina average

South Carolina average ratio: 1.80:1

Avg staff/day 25
Average shift 7.9 hours
0% compared with South Carolina average

South Carolina average: 7.9 hours

Total staff hours (quarter) 17,992
Nursing staff breakdown
Registered Nurse

Manages medical care and health needs.

Total count 5
Average shift length Info Average shift length. Calculated as total hours divided by days worked and average staff per day. 9.1 hours

No contractors work on this role.

Licensed Practical Nurse

Assists with medical care and medications.

Total count 10
Average shift length Info Average shift length. Calculated as total hours divided by days worked and average staff per day. 9.1 hours

No contractors work on this role.

Certified Nursing Assistant

Helps with daily care and mobility.

Total count 27
Average shift length Info Average shift length. Calculated as total hours divided by days worked and average staff per day. 9.6 hours

No contractors work on this role.

Contractor staffing

Total hours from contractors

10.6%

1,902 contractor hours this quarter

Respiratory Therapy Technician: 6 Speech Language Pathologist: 4 Physical Therapy Assistant: 3 Physical Therapy Aide: 2 Qualified Social Worker: 2 Medical Director: 1 Occupational Therapy Assistant: 1
Staff by category
Certified Nursing Assistant270278,58391100%9.6
Licensed Practical Nurse100103,75691100%9.1
Other Dietary Services Staff2029146673%7.9
Clinical Nurse Specialist2026886673%8
Registered Nurse5056265763%9.1
Speech Language Pathologist0445587684%5.1
Physical Therapy Aide0225337077%5.3
Mental Health Service Worker2025306673%7.6
Nurse Practitioner1014565763%8
Administrator1014085156%8
Physical Therapy Assistant0332496268%3.9
Respiratory Therapy Technician0662366673%2.3
Qualified Social Worker0221896268%3
Occupational Therapy Aide1011302831%4.6
Medical Director0111122527%4.5
Occupational Therapy Assistant011261314%2
27 Certified Nursing Assistant
% of Days 100%
10 Licensed Practical Nurse
% of Days 100%
2 Other Dietary Services Staff
% of Days 73%
2 Clinical Nurse Specialist
% of Days 73%
5 Registered Nurse
% of Days 63%
4 Speech Language Pathologist
% of Days 84%
2 Physical Therapy Aide
% of Days 77%
2 Mental Health Service Worker
% of Days 73%
1 Nurse Practitioner
% of Days 63%
1 Administrator
% of Days 56%
3 Physical Therapy Assistant
% of Days 68%
6 Respiratory Therapy Technician
% of Days 73%
2 Qualified Social Worker
% of Days 68%
1 Occupational Therapy Aide
% of Days 31%
1 Medical Director
% of Days 27%
1 Occupational Therapy Assistant
% of Days 14%

Facility Characteristics

Source: CMS Long-Term Care Facility Characteristics (Data as of Jan 2026)

Total census
41 residents
Residents by payment source
Medicare
13 residents (31.7%)
Private pay or other
28 residents (68.3%)
Programs & Services
Residents' Group

Residents meet regularly to discuss policies, care quality, and activities

Family Member Group

Family members meet regularly to discuss policies, care quality, and activities

CCRC

Part of a Continuing Care Retirement Community offering multiple care levels

Active Family Council

Organized group of family members that meets regularly to discuss facility policies, resident care, and activities.

Active Resident Council

Organized group of residents that meets regularly to discuss facility policies, quality of life, and activities.

Quality of care over time

These measures show how residents usually do over time at this home, based on health outcomes and preventive care.

High-risk clinical events score Info A composite score based on pressure ulcers, falls with injury, weight loss, walking ability decline, and activities of daily living decline. 5.6
36% better than South Carolina average

South Carolina average: 8.7

Functional decline score Info A composite score based on activities of daily living decline, walking ability decline, and incontinence. 6.6
57% better than South Carolina average

South Carolina average: 15.5

Long-stay resident measures
Need for Help with Daily Activities Increased Info Percent of long-stay residents whose need for help with daily activities has increased 4.1%
69% better than South Carolina average

South Carolina average: 13.1%

Low Risk Residents with Bowel/Bladder Incontinence Info Percent of low risk long-stay residents who lose control of their bowels or bladder 9.1%
46% better than South Carolina average

South Carolina average: 17.0%

Falls with Major Injury Info Percent of long-stay residents experiencing one or more falls with major injury 4.2%
42% worse than South Carolina average

South Carolina average: 3.0%

High Risk Residents with Pressure Ulcers Info Percent of long-stay high risk residents with pressure ulcers 6.6%
9% worse than South Carolina average

South Carolina average: 6.1%

Urinary Tract Infection Info Percent of long-stay residents with a urinary tract infection 14.7%
789% worse than South Carolina average

South Carolina average: 1.6%

Lost Too Much Weight Info Percent of long-stay residents who lose too much weight 7.3%
19% worse than South Carolina average

South Carolina average: 6.2%

Depressive Symptoms Info Percent of long-stay residents who have depressive symptoms 1.8%
37% better than South Carolina average

South Carolina average: 2.8%

Antipsychotic Use Info Percent of long-stay residents who received an antipsychotic medication 22.0%
52% worse than South Carolina average

South Carolina average: 14.5%

Pneumococcal Vaccine Info Percent of long-stay residents assessed and appropriately given the pneumococcal vaccine 100.0%
11% better than South Carolina average

South Carolina average: 90.5%

Influenza Vaccine Info Percent of long-stay residents assessed and appropriately given the seasonal influenza vaccine 100.0%
10% better than South Carolina average

South Carolina average: 90.6%

Short-stay resident measures
Pneumococcal Vaccine Info Percent of short-stay residents assessed and appropriately given the pneumococcal vaccine 100.0%
26% better than South Carolina average

South Carolina average: 79.5%

Antipsychotic medication increase Info Percent of short-stay residents who newly received an antipsychotic medication 3.2%
89% worse than South Carolina average

South Carolina average: 1.7%

Influenza Vaccine Info Percent of short-stay residents assessed and appropriately given the seasonal influenza vaccine 81.4%
In line with South Carolina average

South Carolina average: 78.0%

Guides for Better Senior Living

Care Cost Calculator: See Prices in Your Area

Nursing Home Data Explorer

Don’t Wait Too Long: 7 Red Flag Signs Your Parent Needs Assisted Living Now

The True Cost of Assisted Living in 2025 – And How Families Are Paying For It

Understanding Senior Living Costs: Pricing Models, Discounts & Financial Assistance

Financial Aid for South Carolina Seniors

Get financial aid guidance

Community Long Term Care (CLTC)

SC Medicaid CLTC

Age 65+ or disabled, South Carolina resident, Medicaid-eligible, nursing home-level care need.

~$2,829/month (300% FBR, individual).

$2,000 (individual), $3,000 (couple).

High rural demand; waitlists possible.

South Carolina Respite Care Program

SC NFCSP Respite

Caregiver of someone 60+ (or with dementia), South Carolina resident.

No strict limit; prioritizes low-income.

Not applicable.

Limited slots; rural/urban balance.

Medicare Savings Program (MSP)

South Carolina Medicare Savings Program

Age 65+ or disabled, SC resident, Medicare Part A/B.

~$2,510/month (QMB), ~$3,380/month (SLMB), ~$3,598/month (QI)—individual.

$9,430 (individual), $14,130 (couple).

Three tiers; includes Extra Help for Part D; no waitlist.

Low-Income Home Energy Assistance Program (LIHEAP)

South Carolina LIHEAP

Age 60+ prioritized, SC resident, low-income household.

~$3,970/month (individual, 185% FPL).

Not assessed; income-focused.

Covers gas, electric, oil; emergency aid via ECAP (~$500 max).

Senior Community Service Employment Program (SCSEP)

South Carolina SCSEP

Age 55+, unemployed, low-income, SC resident.

~$1,983/month (125% FPL).

Not specified; income-focused.

Priority for veterans, rural residents; Goodwill/AARP partnership.

VA Aid and Attendance (A&A) and Housebound Benefits

South Carolina VA Aid and Attendance/Housebound

Age 65+ or disabled veteran/spouse, SC resident, wartime service, need for ADL help (A&A) or homebound.

Net income < ~$1,984/month (veteran with dependent, A&A); pension offsets income.

~$155,356 (net worth limit).

High veteran population; supports rural/urban care needs.

Senior Farmers’ Market Nutrition Program (SFMNP)

South Carolina SFMNP

Age 60+, SC resident, low-income.

~$2,322/month (individual, 185% FPL).

Not assessed.

Vouchers (~$50/season); serves ~20,000 annually via 10 AAAs.

Homestead Exemption Program

South Carolina Homestead Exemption

Age 65+ (or disabled/blind), SC resident 1+ year, homeowner.

None; tax-based eligibility.

Not assessed; home-focused.

Saves ~$500-$1,000/year avg.; applies to primary residence.

Elderly Simplified Application Project (ESAP)

South Carolina ESAP (SNAP for Seniors)

Age 60+, SC resident, no earned income, not on SCCAP.

~$1,732/month (133% FPL, individual).

$4,250 (individual, higher than standard SNAP).

Simplified process; serves ~50,000 seniors annually.

Tour Icon
Planning a tour? Check our touring checklist.
Chat Icon
Thinking of living here? We can help you speak to a current resident