


Re-hospitalized after SNF stay
 Percentage of short-stay residents who were re-hospitalized after their nursing home admission.
16.8%
Percentage of short-stay residents who were re-hospitalized after their nursing home admission.
16.8%
Michigan average: 24.2%
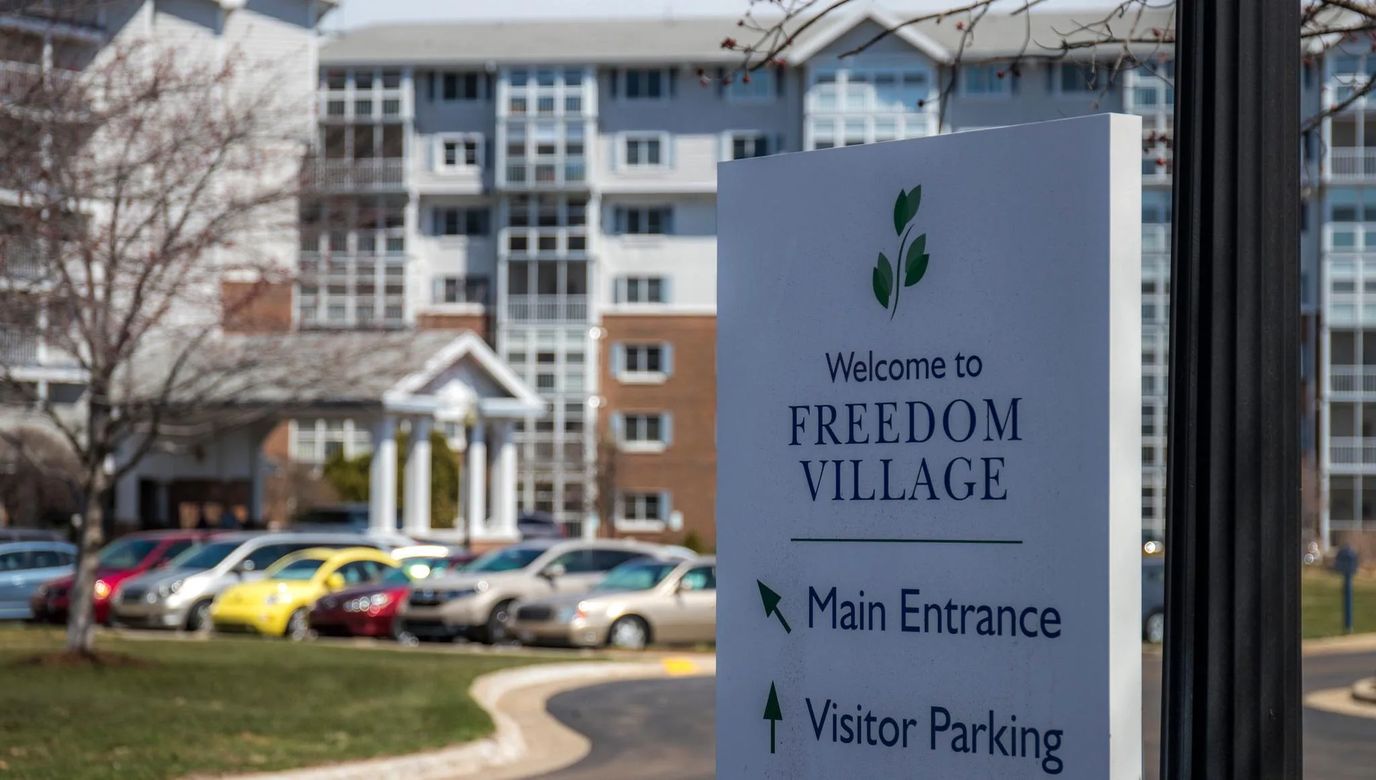
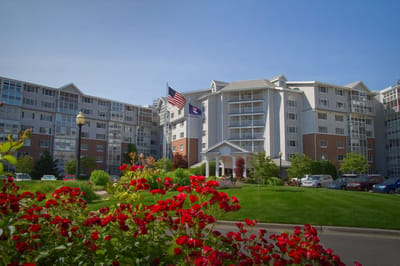
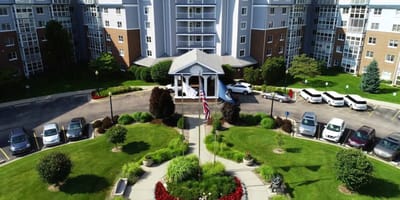


Under owner Steven Levato, Freedom Village is a skilled nursing home operated by CCRC OpCo-Holland, LLC in Holland, Michigan. Serving the community for 35 years, it occupies 62 beds in a mid-rise building and focuses primarily on short-term rehabilitation and recovery. Accepted are Medicare and private pay, giving families flexible coverage options for post-acute care.
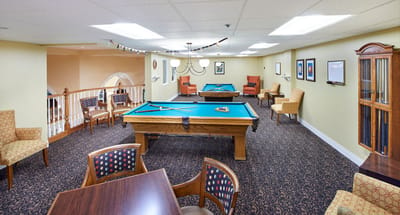
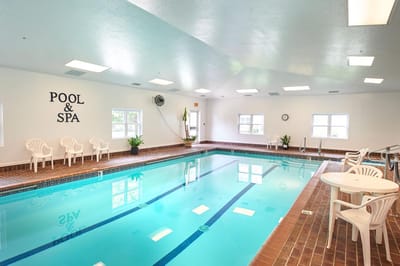
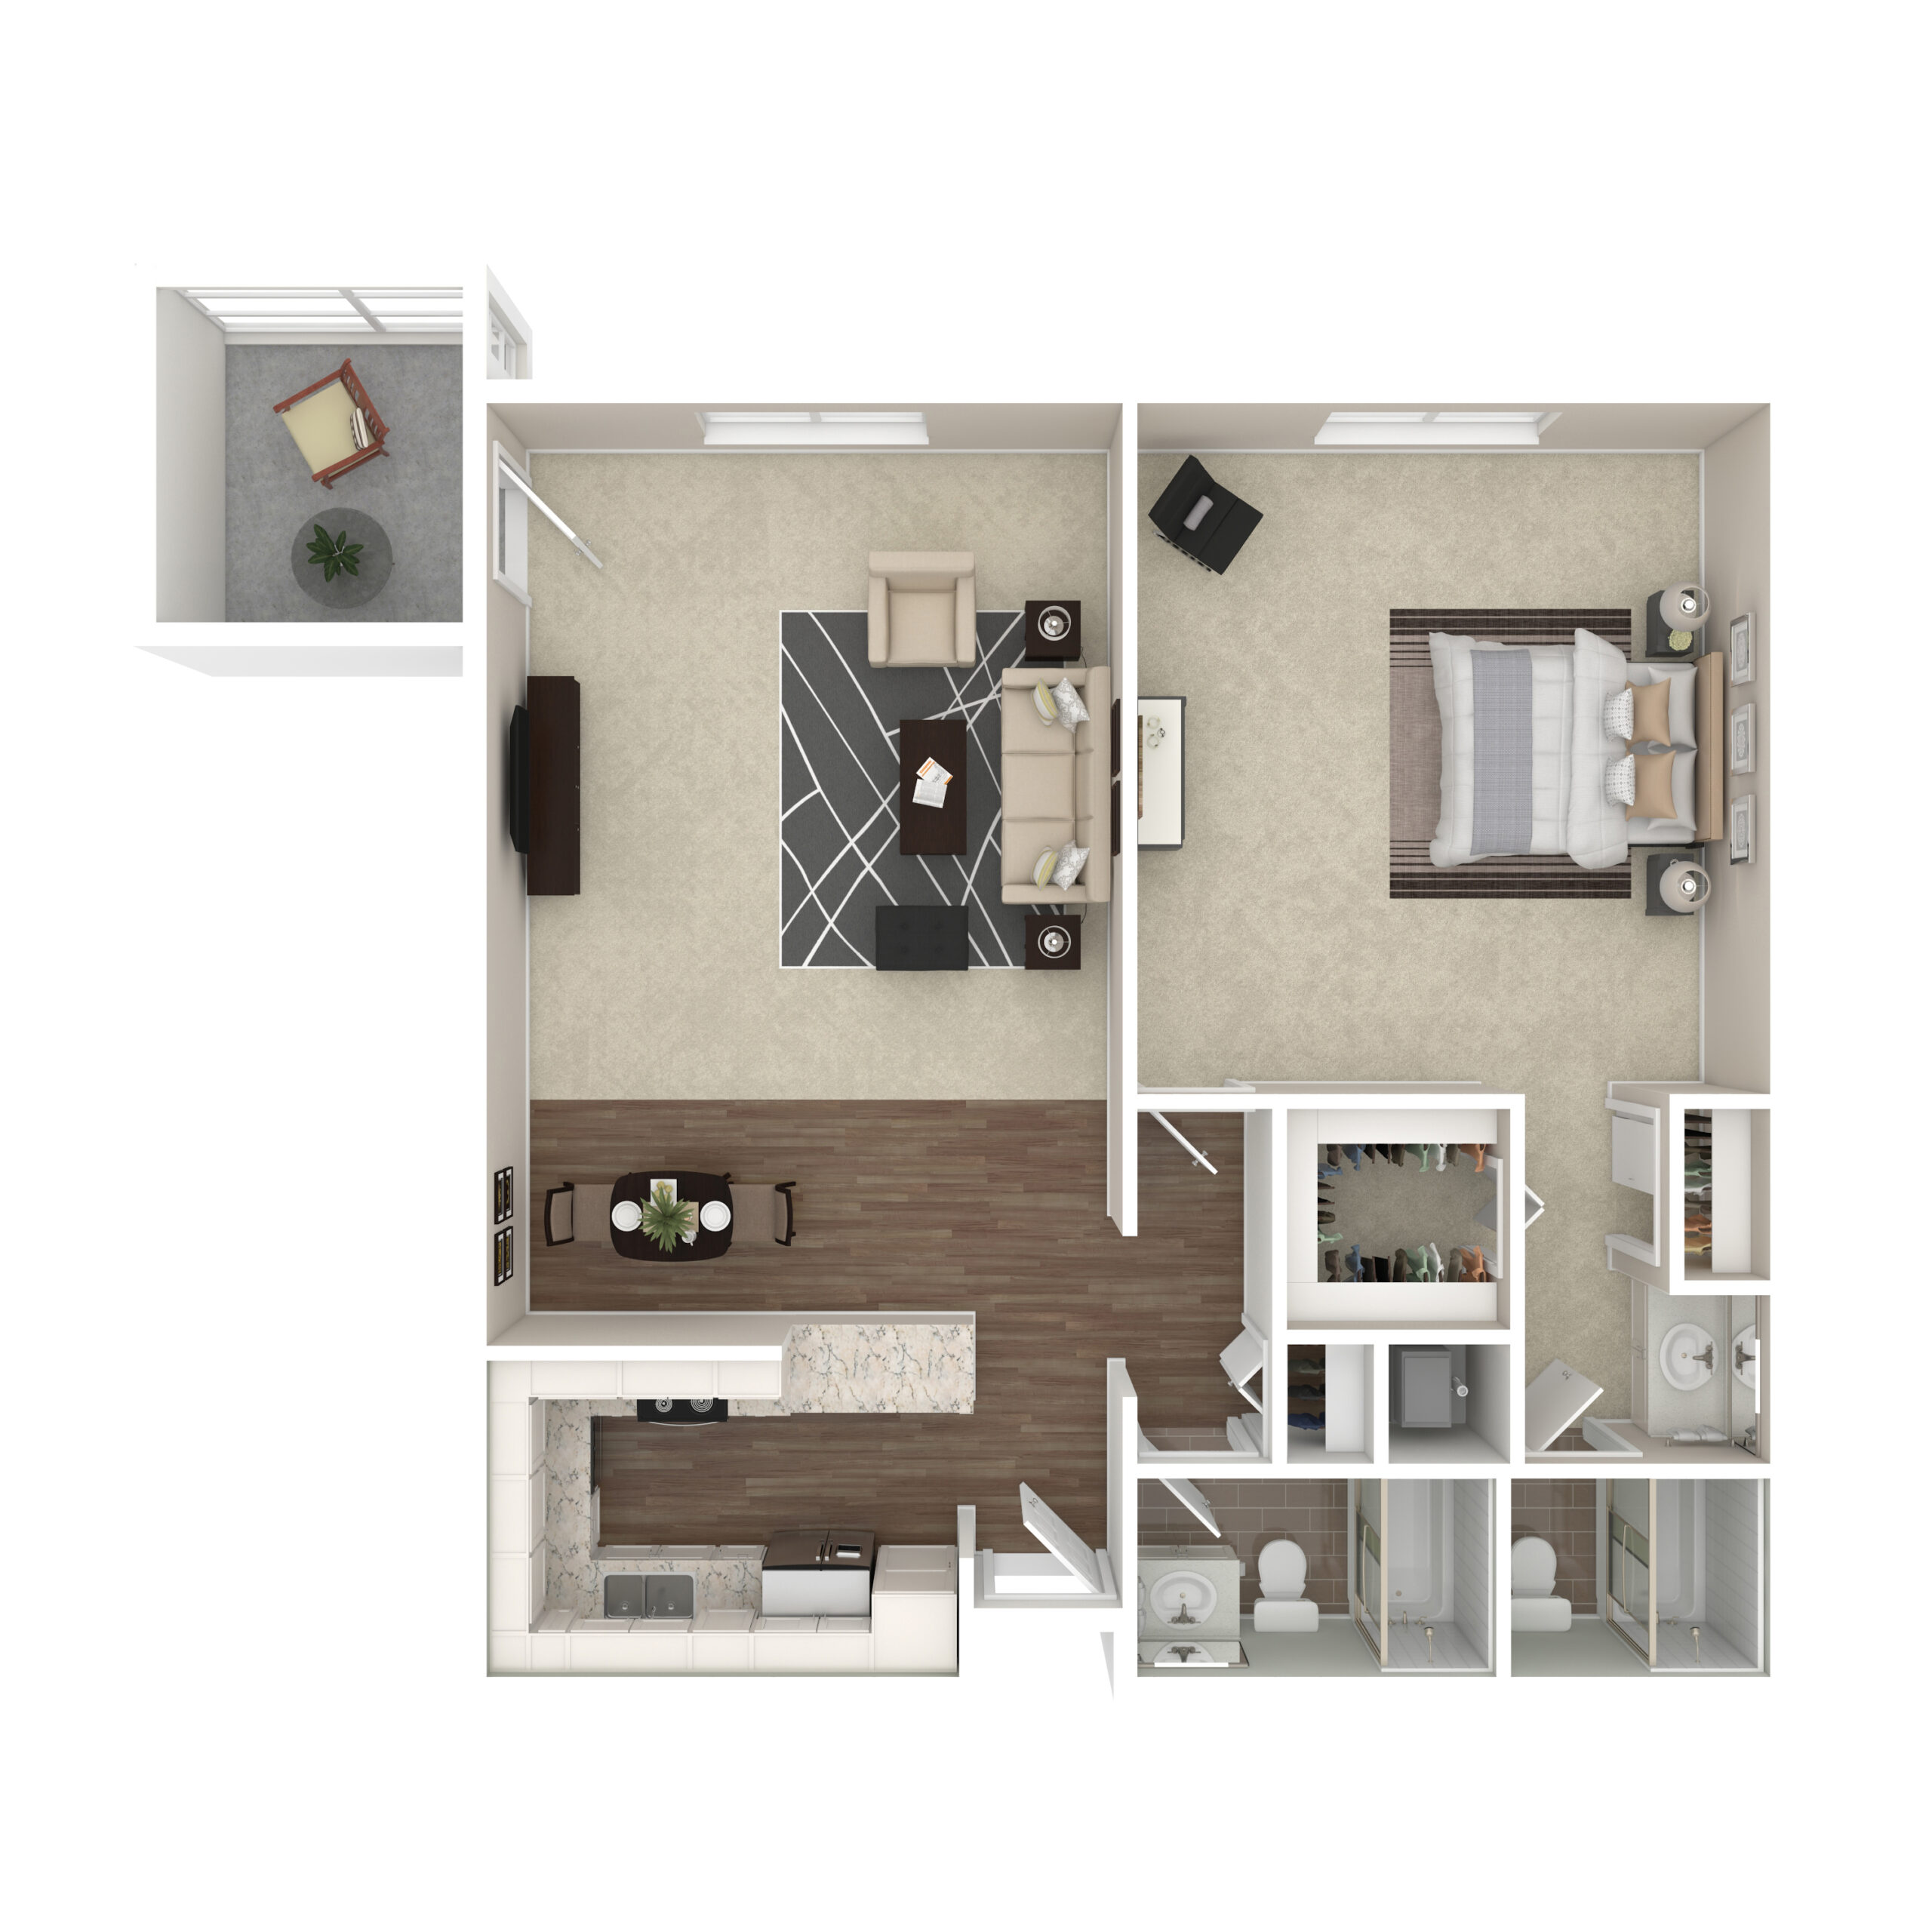
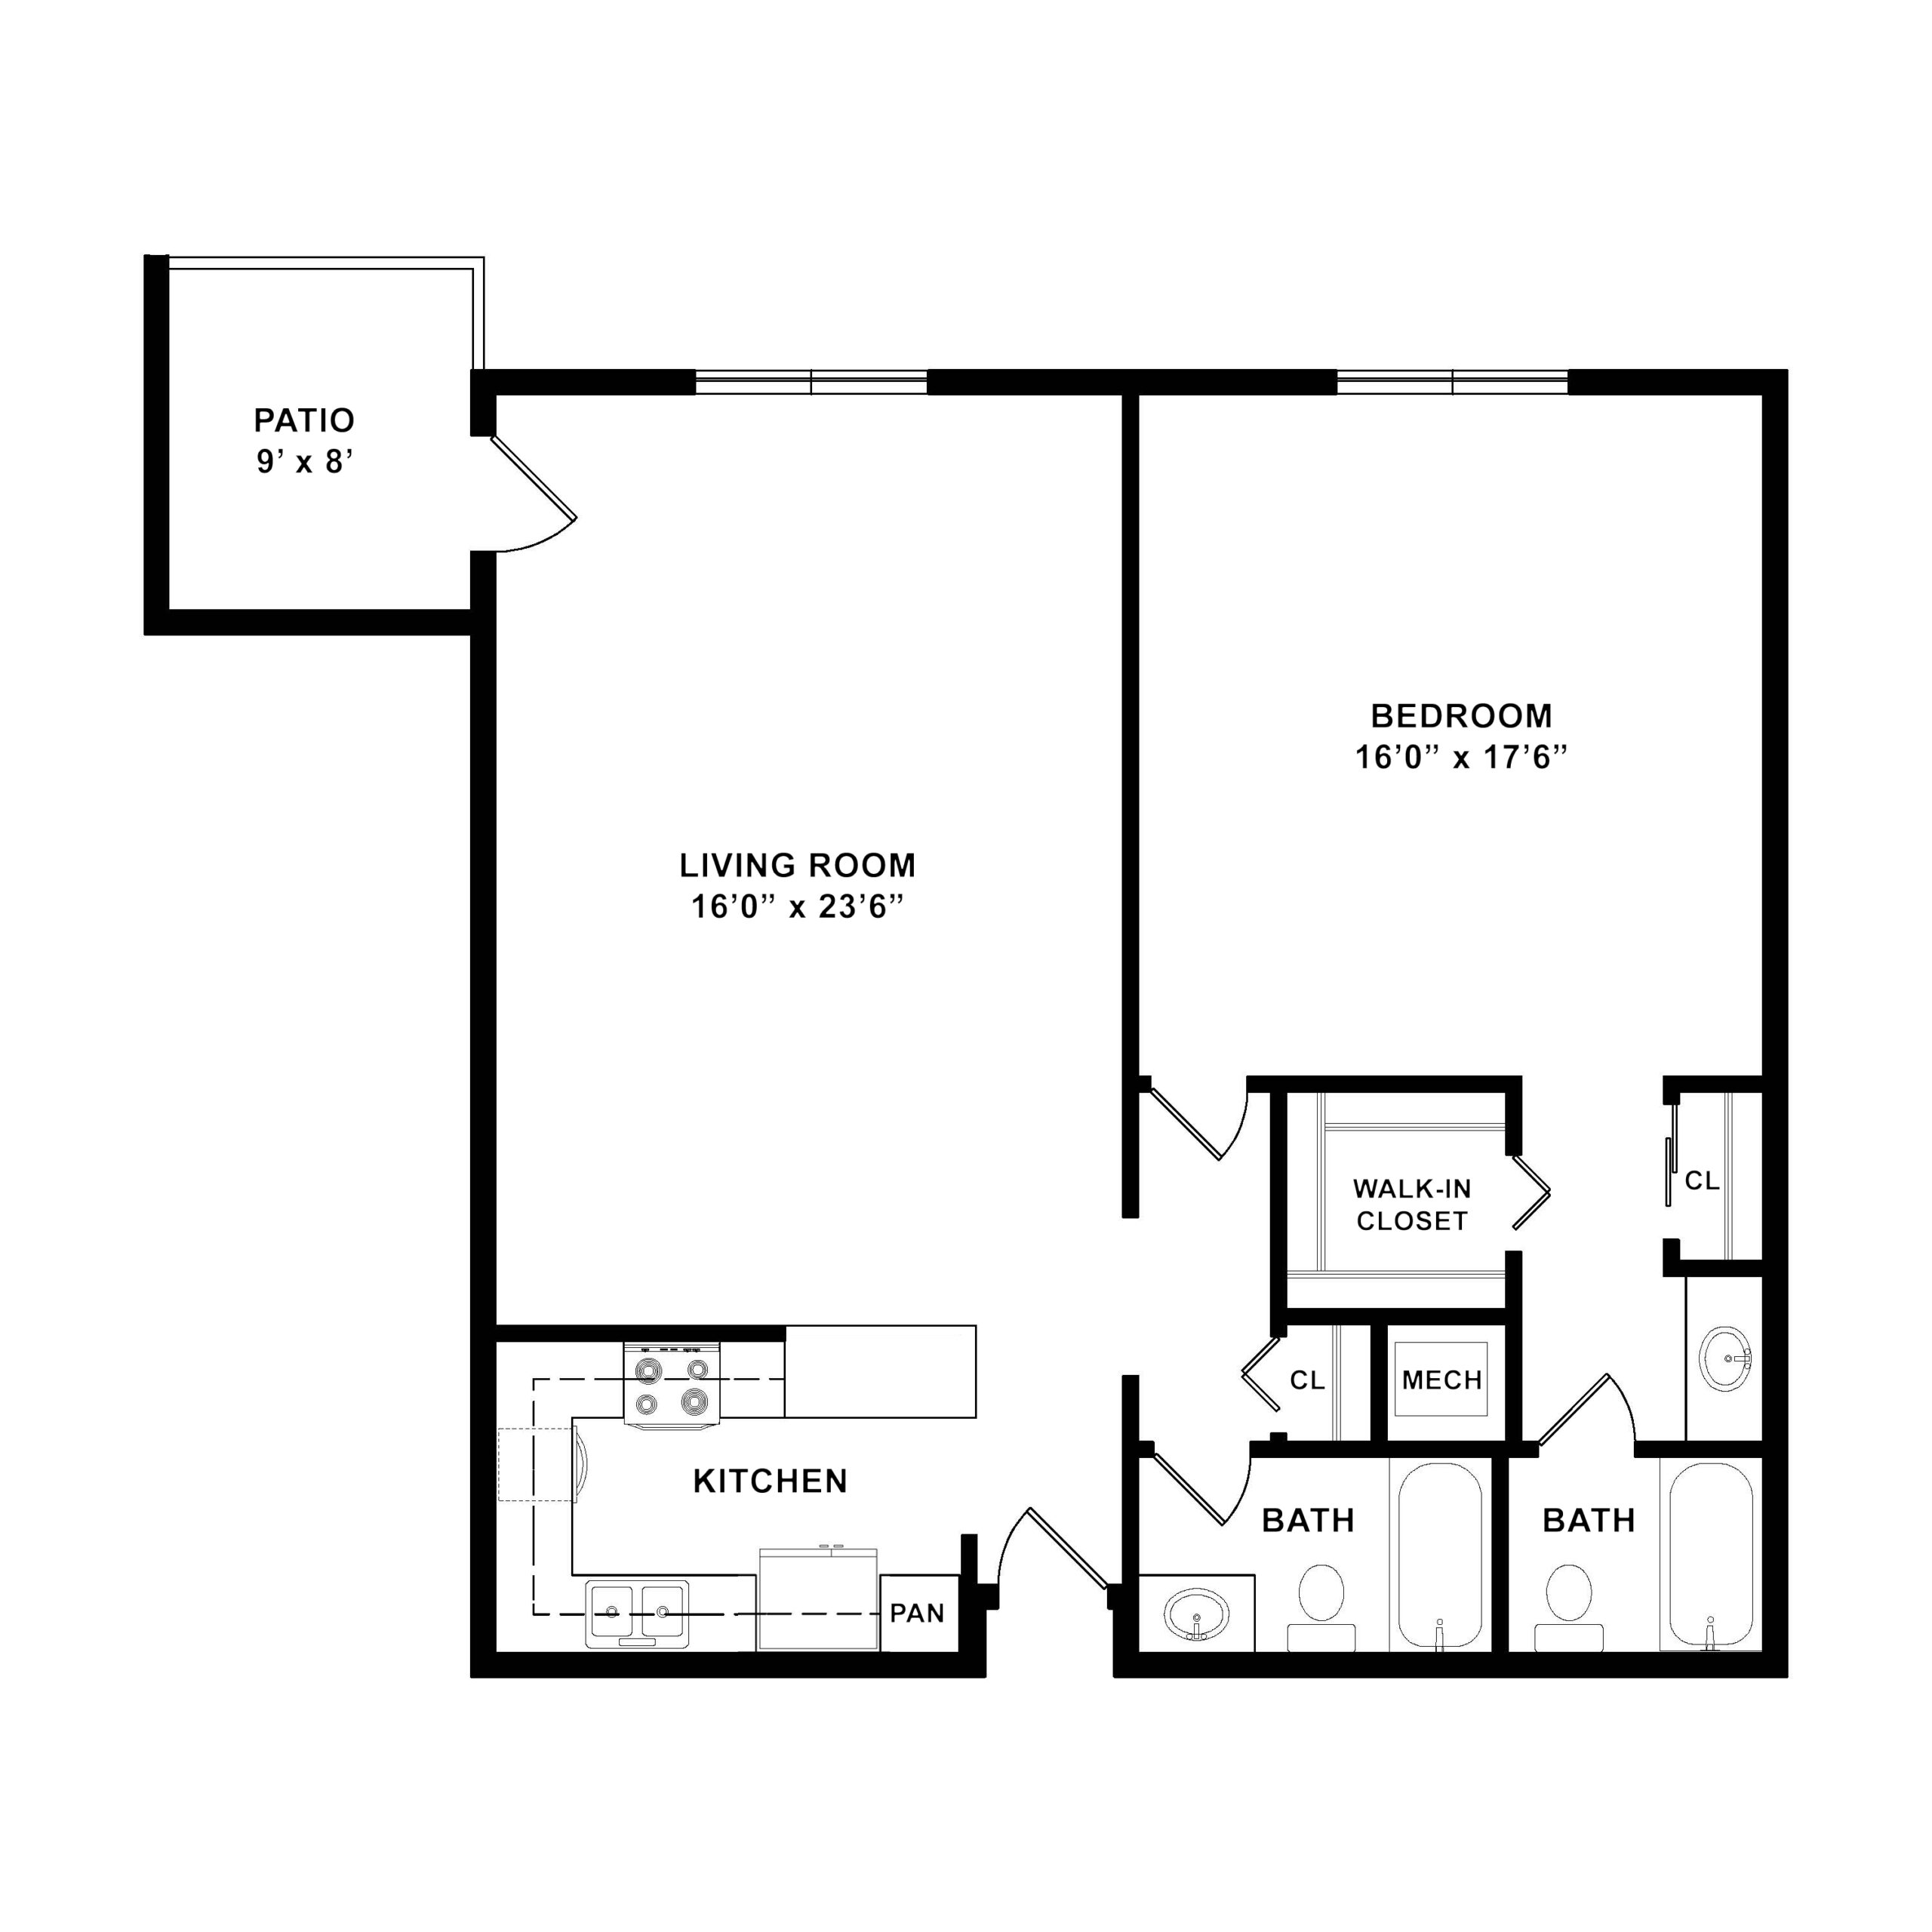
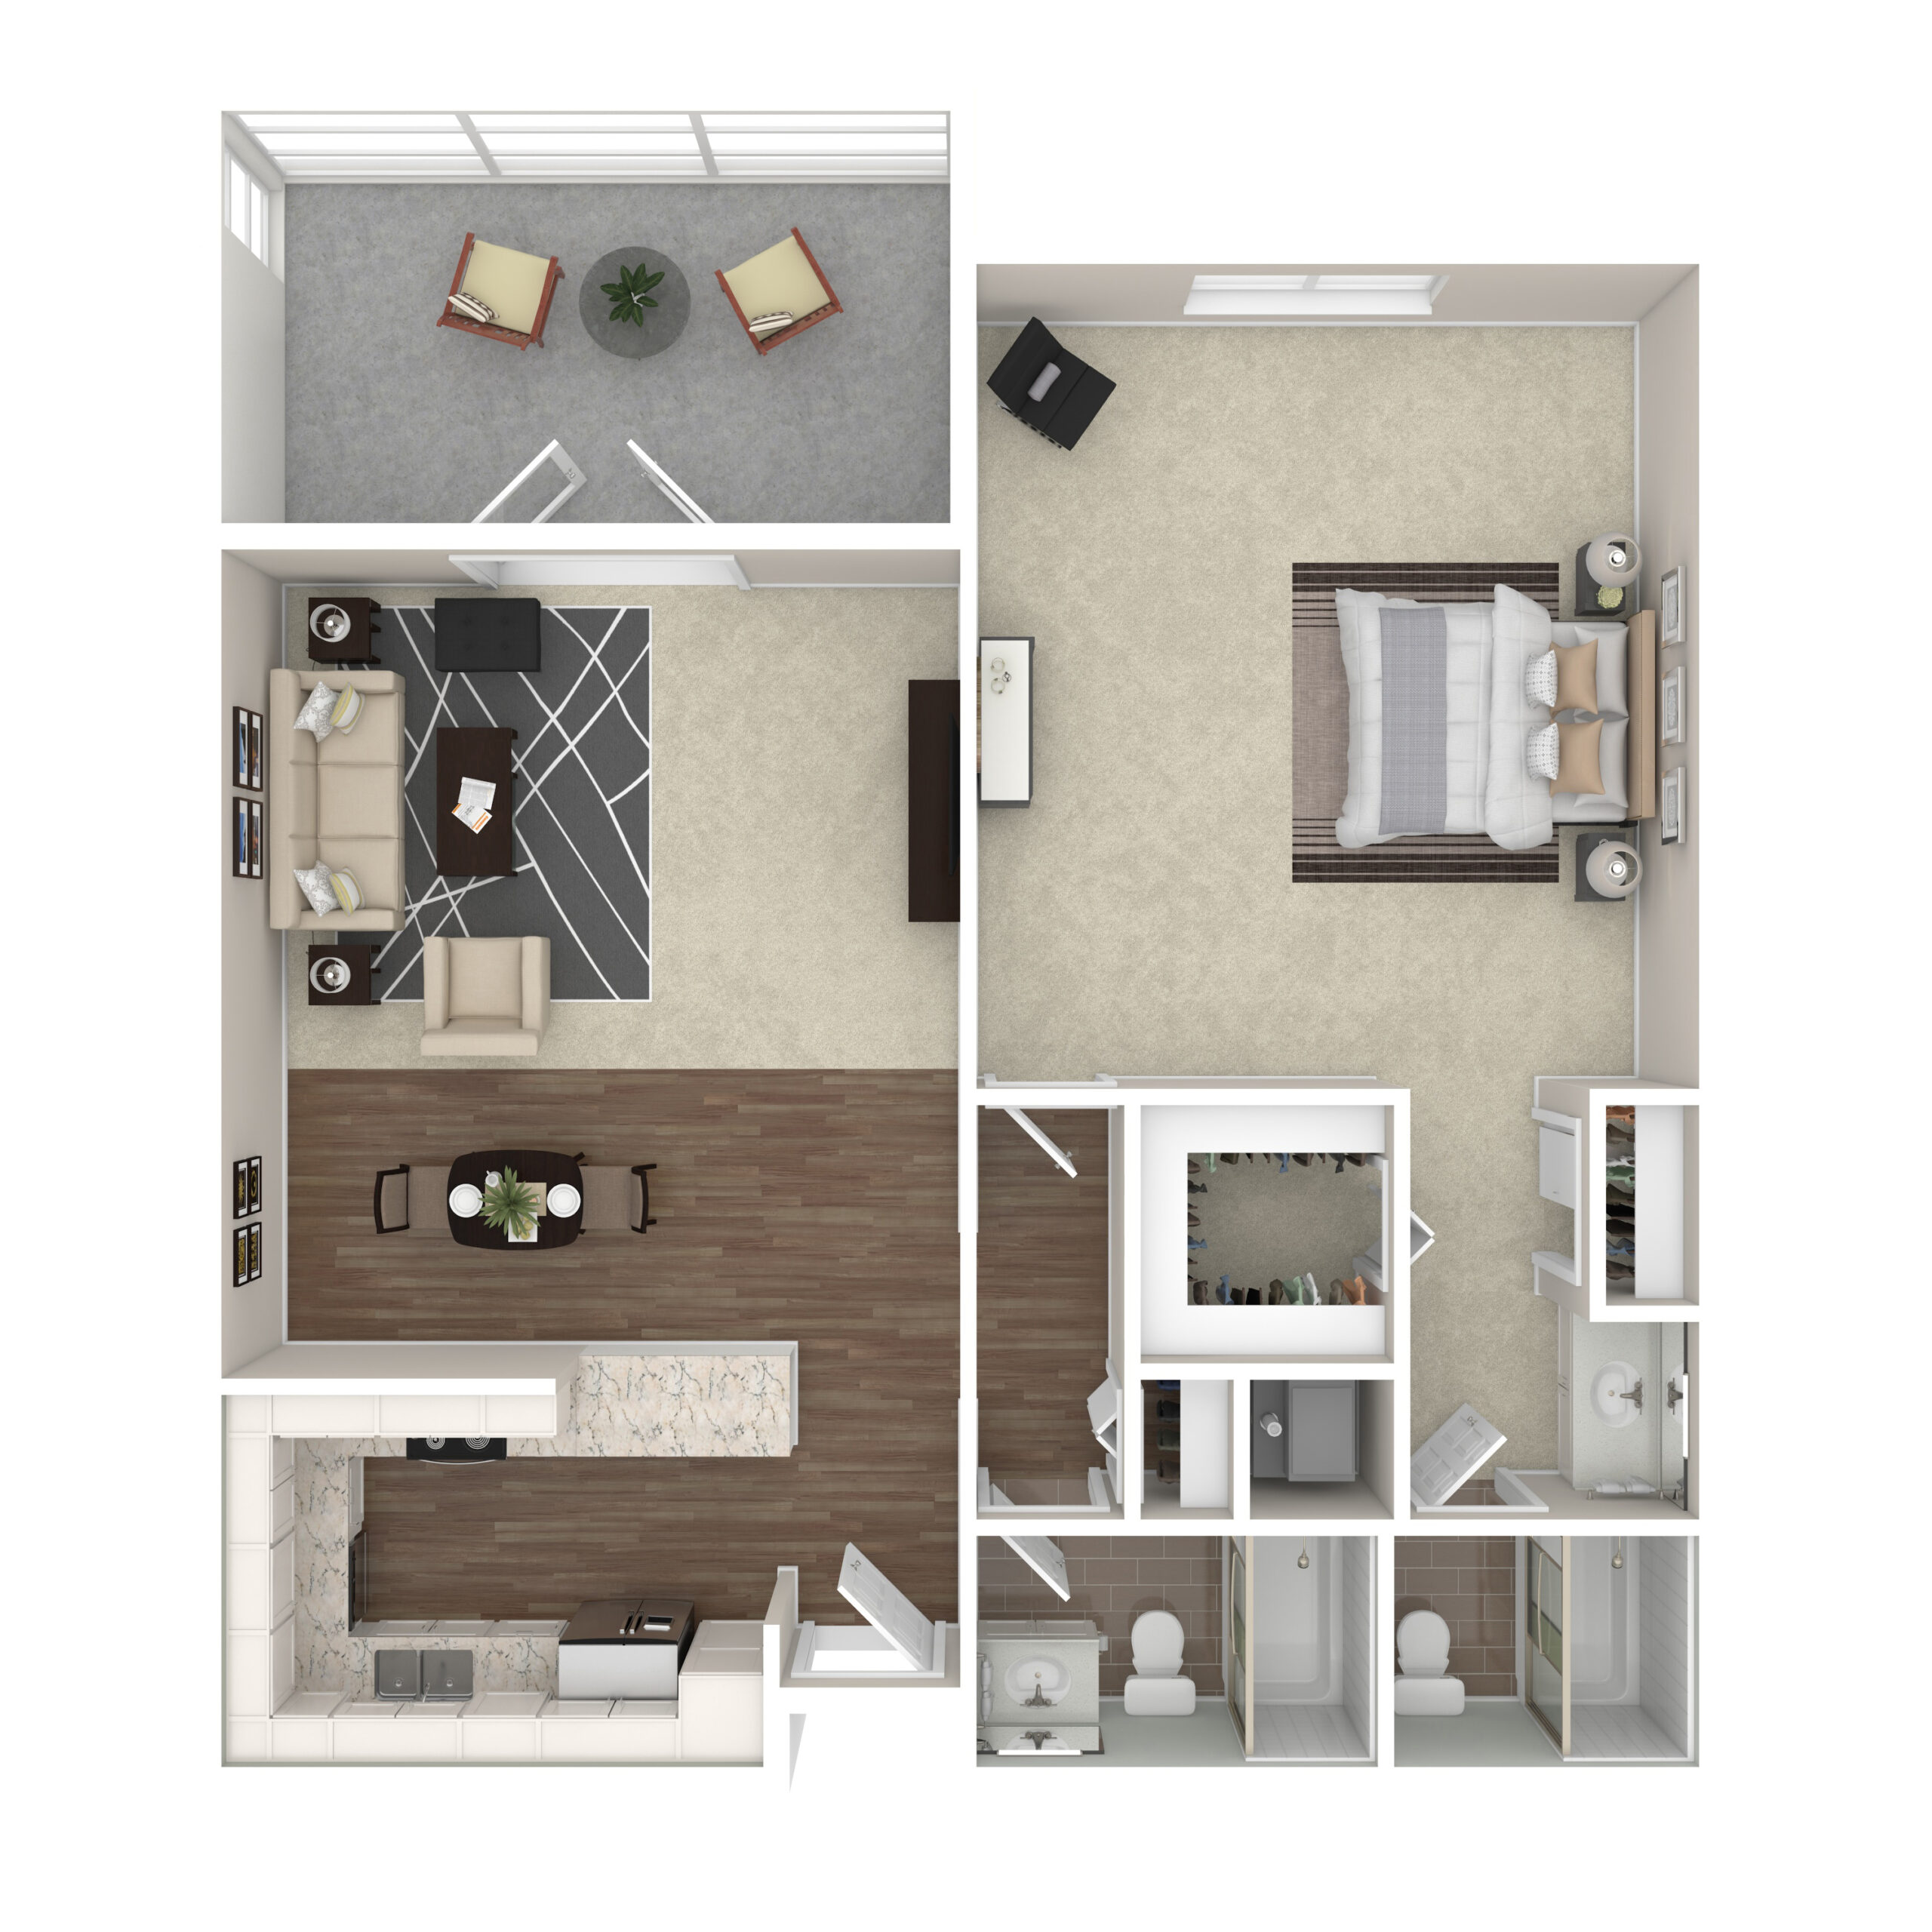
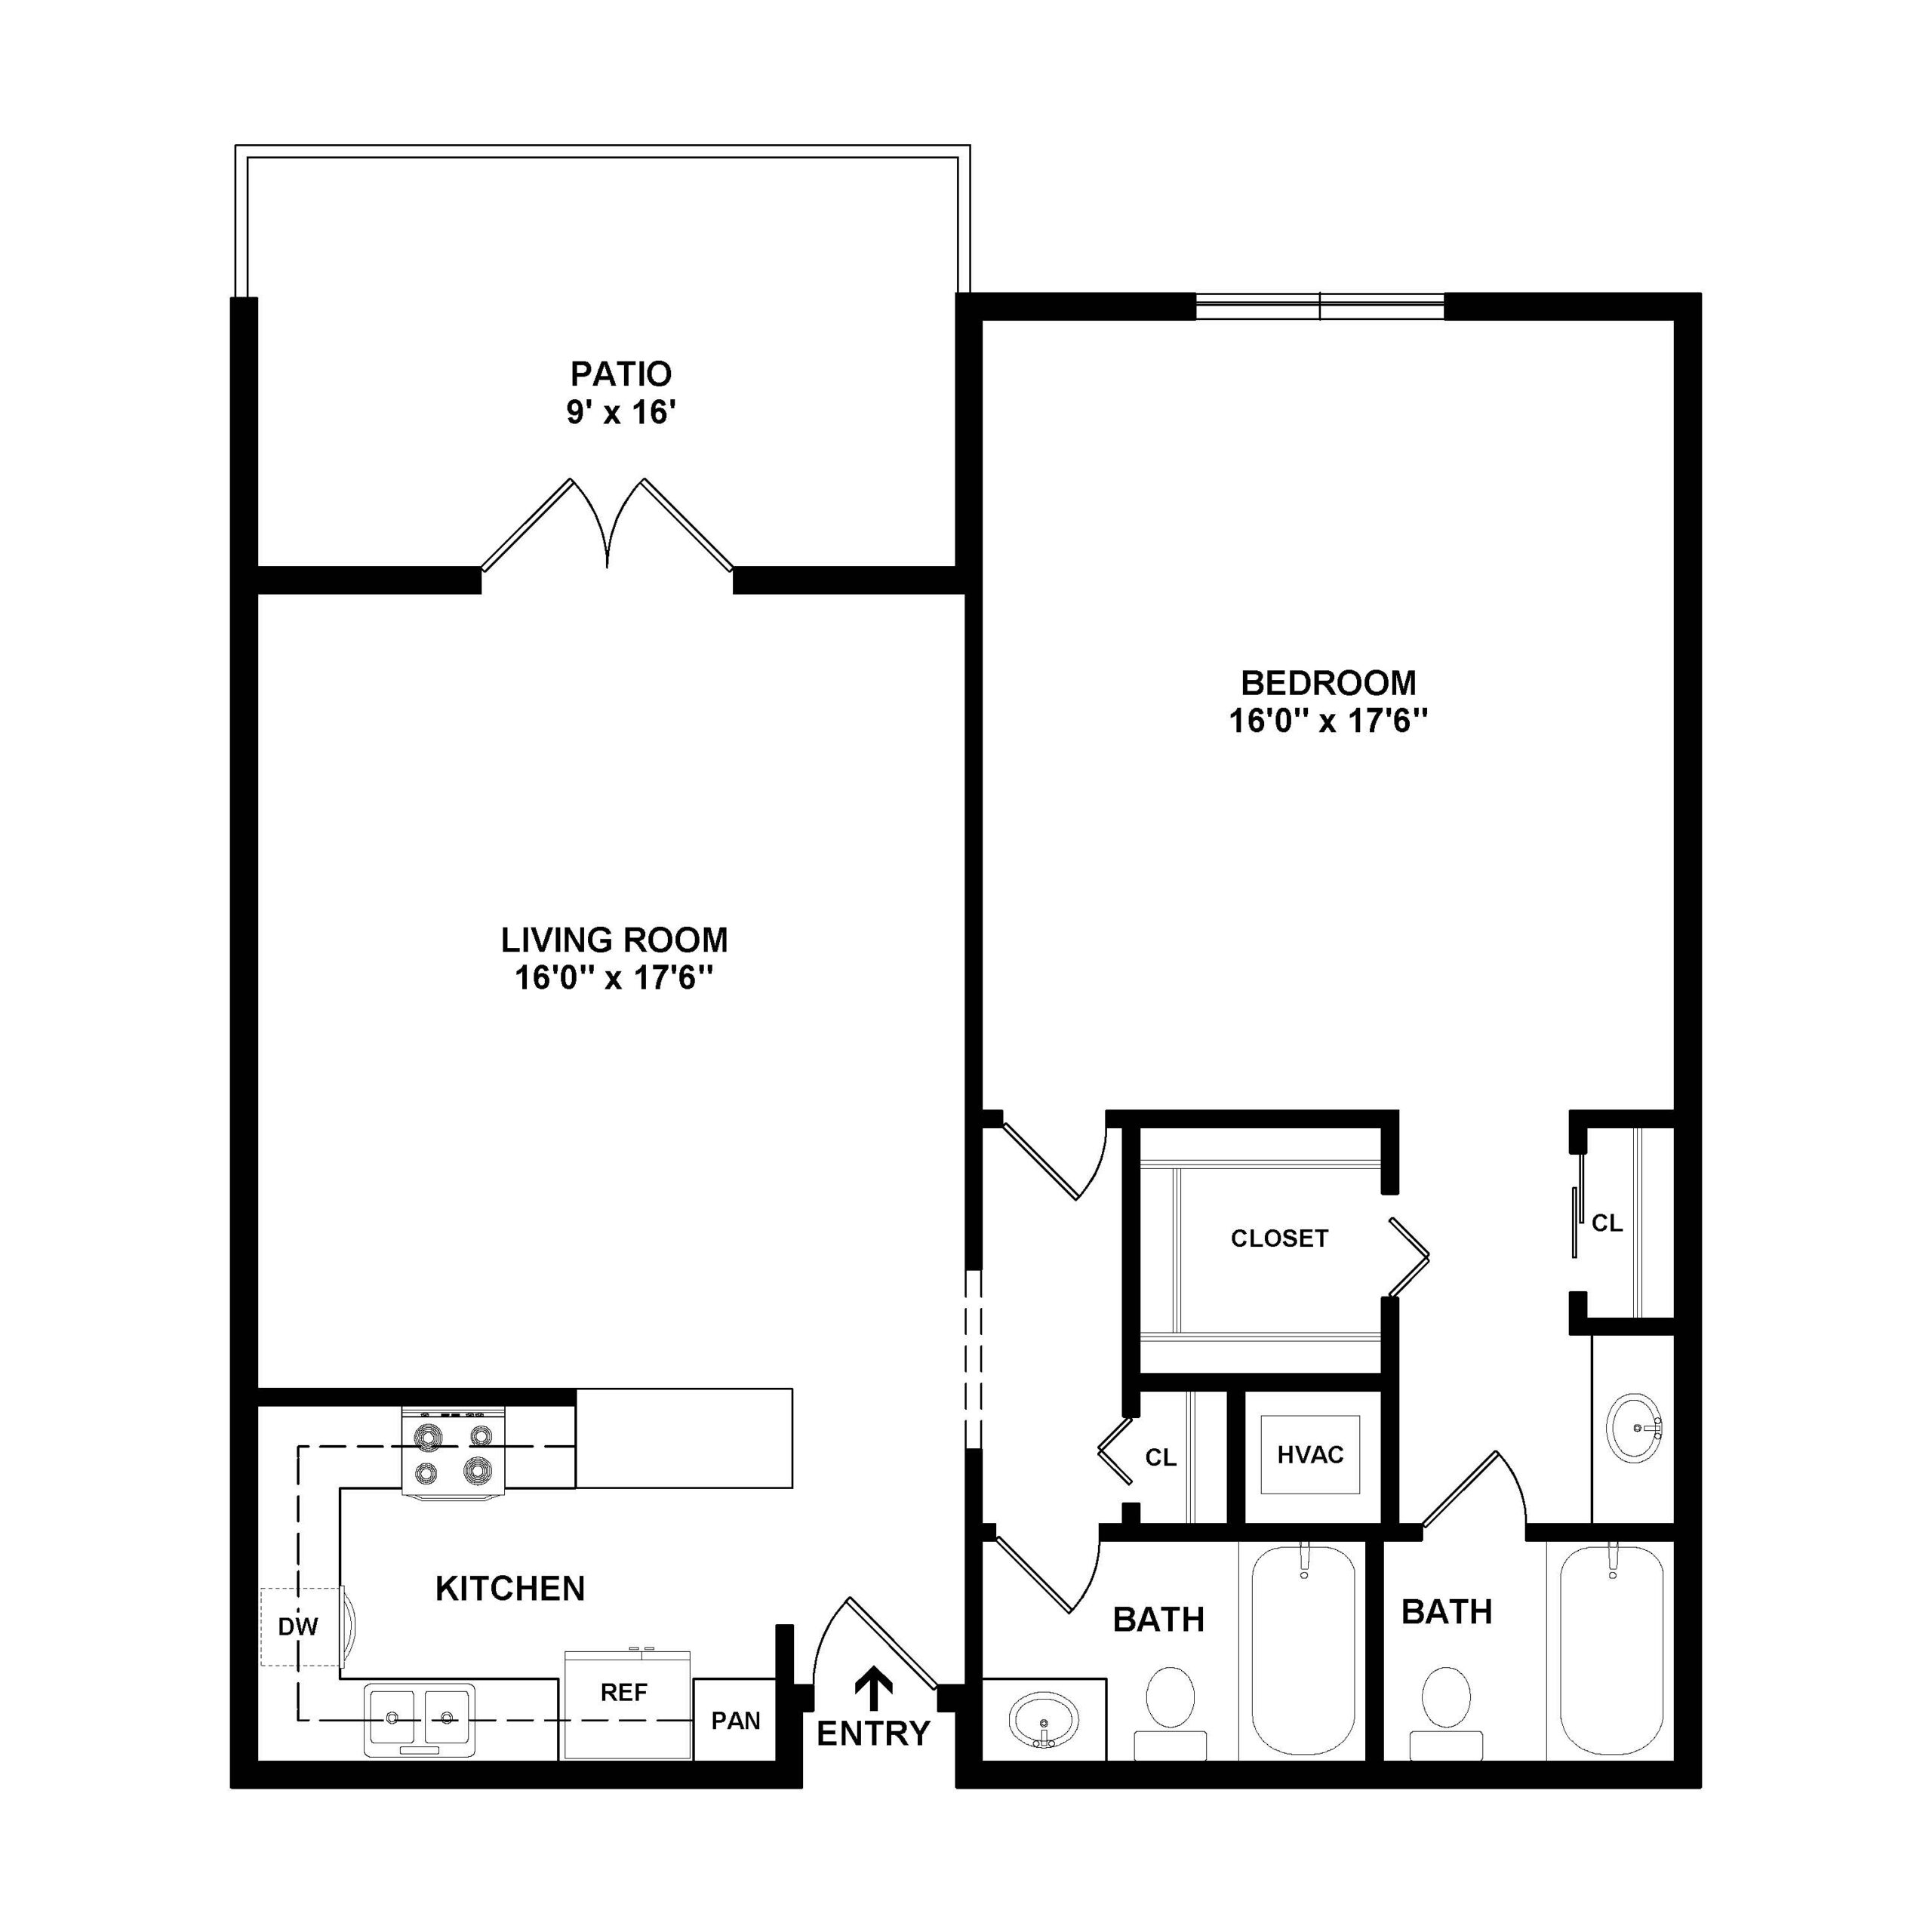
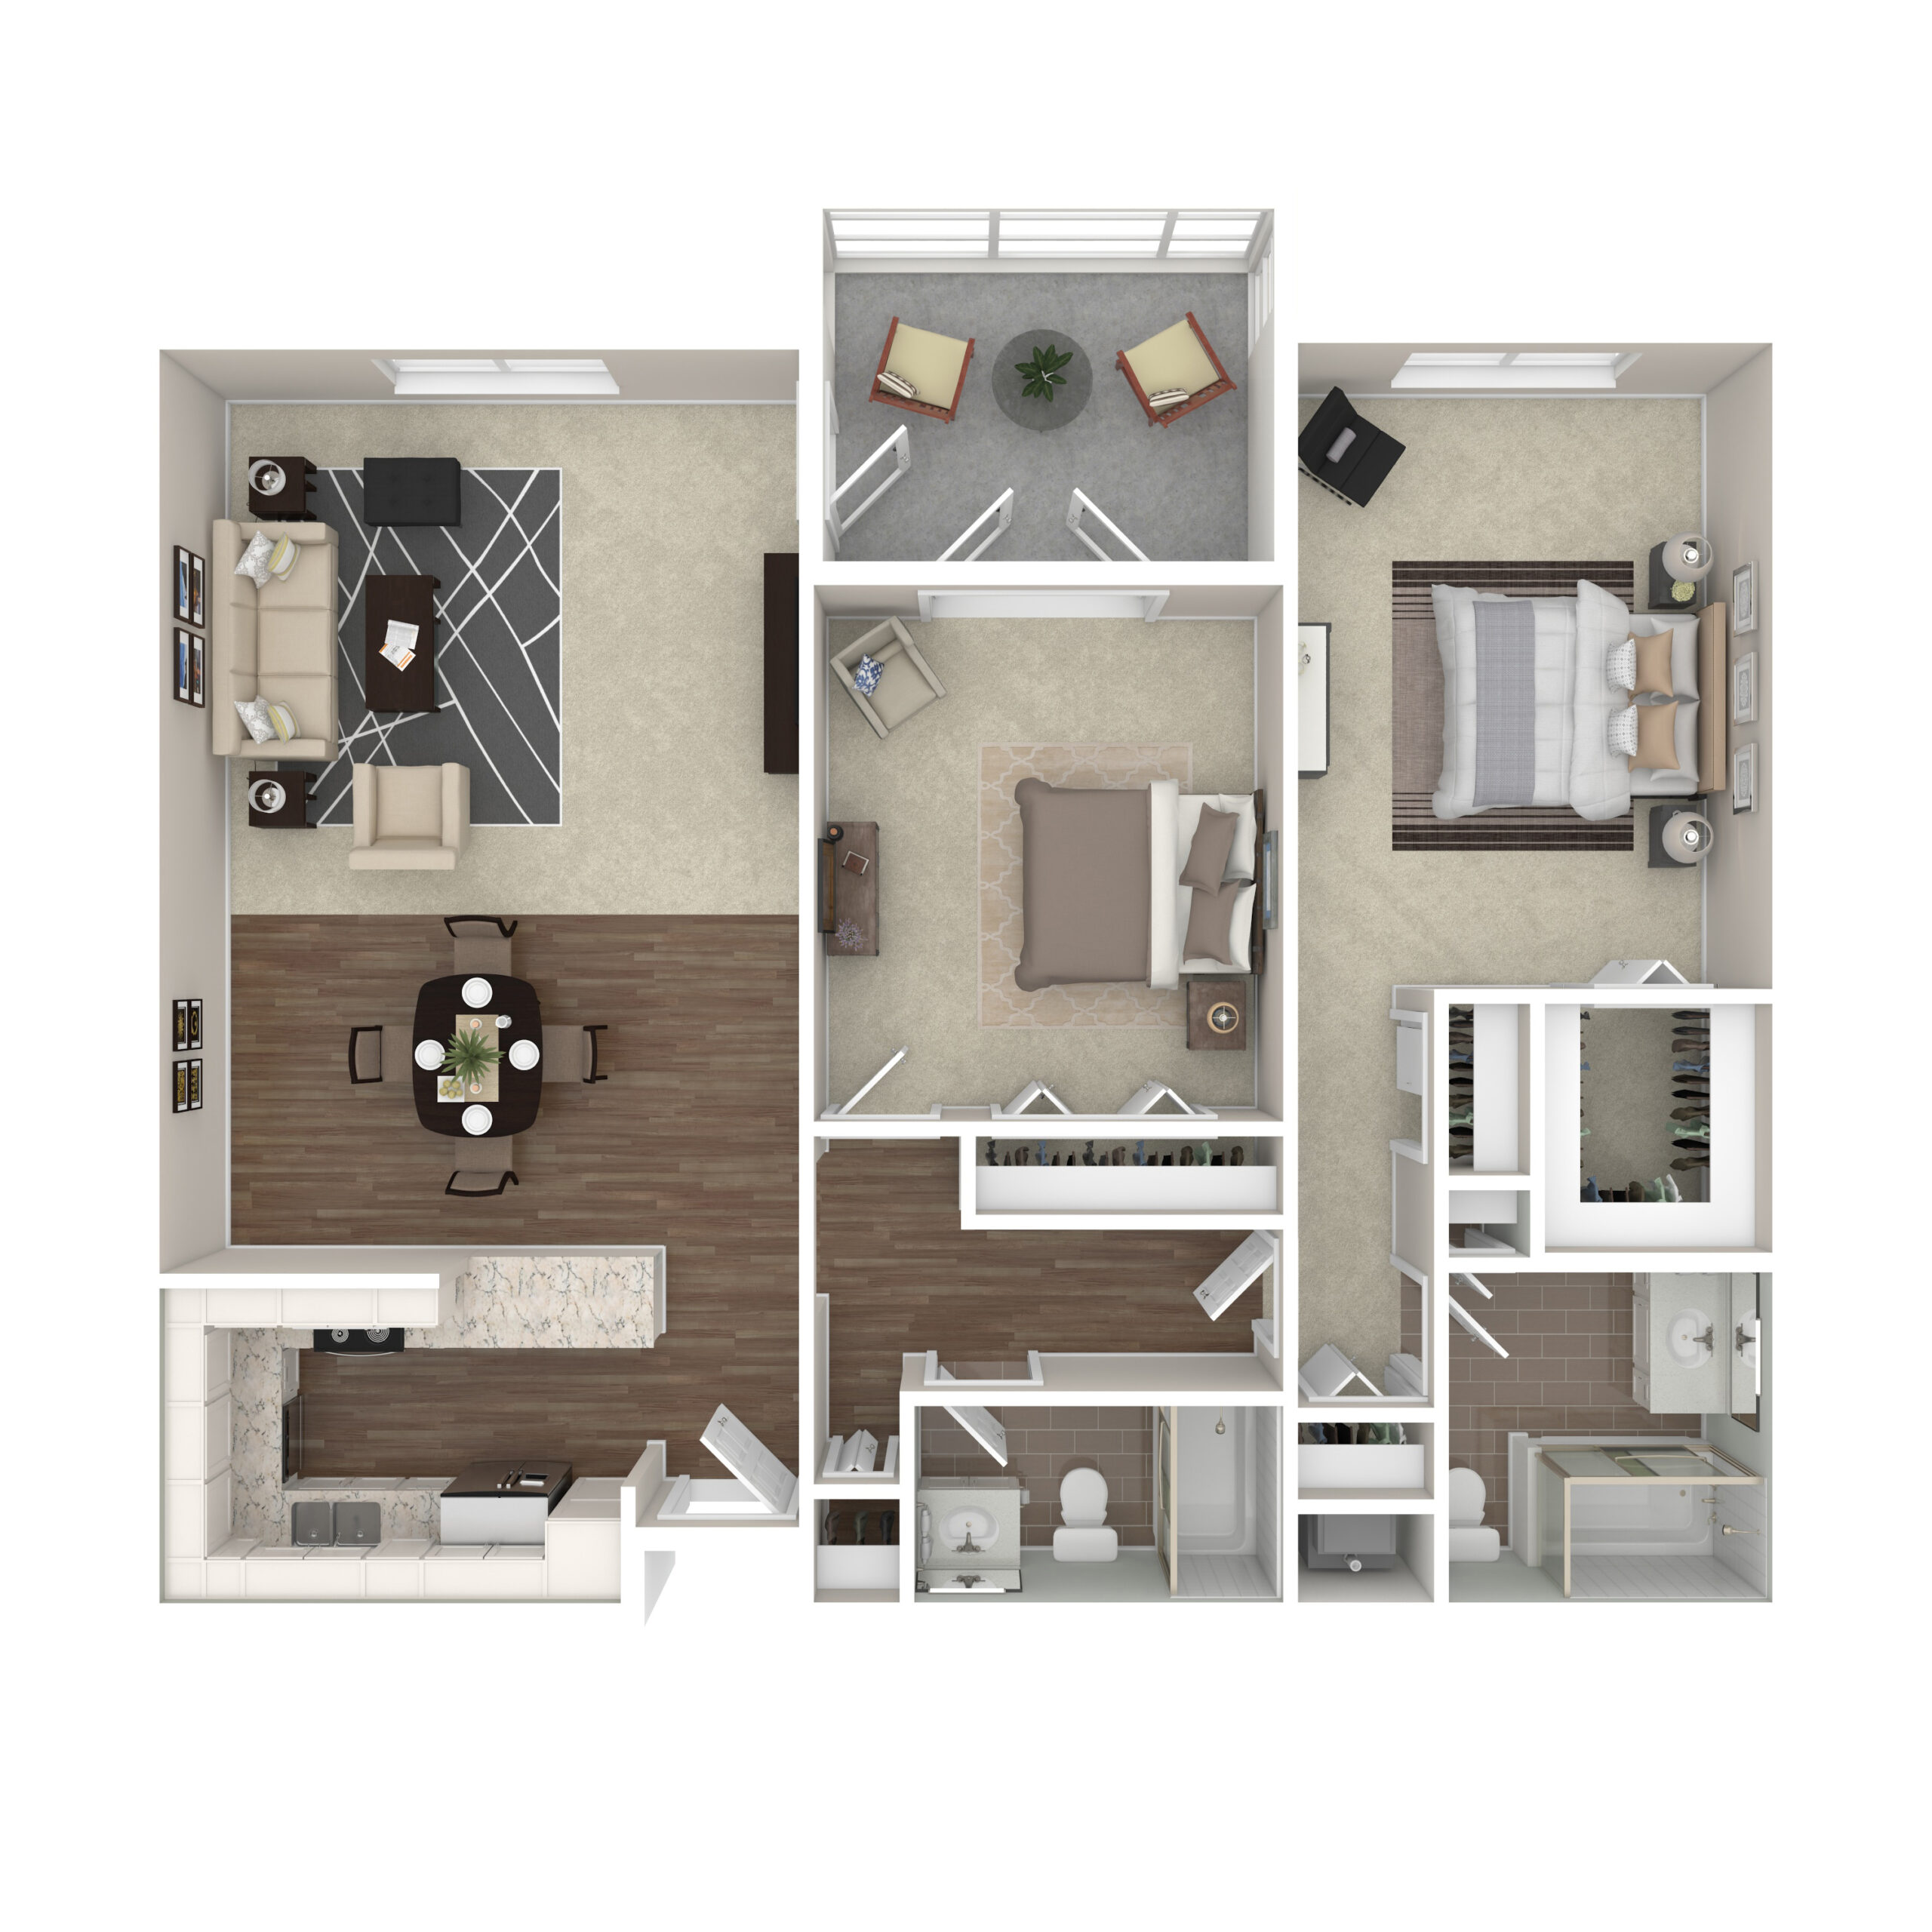
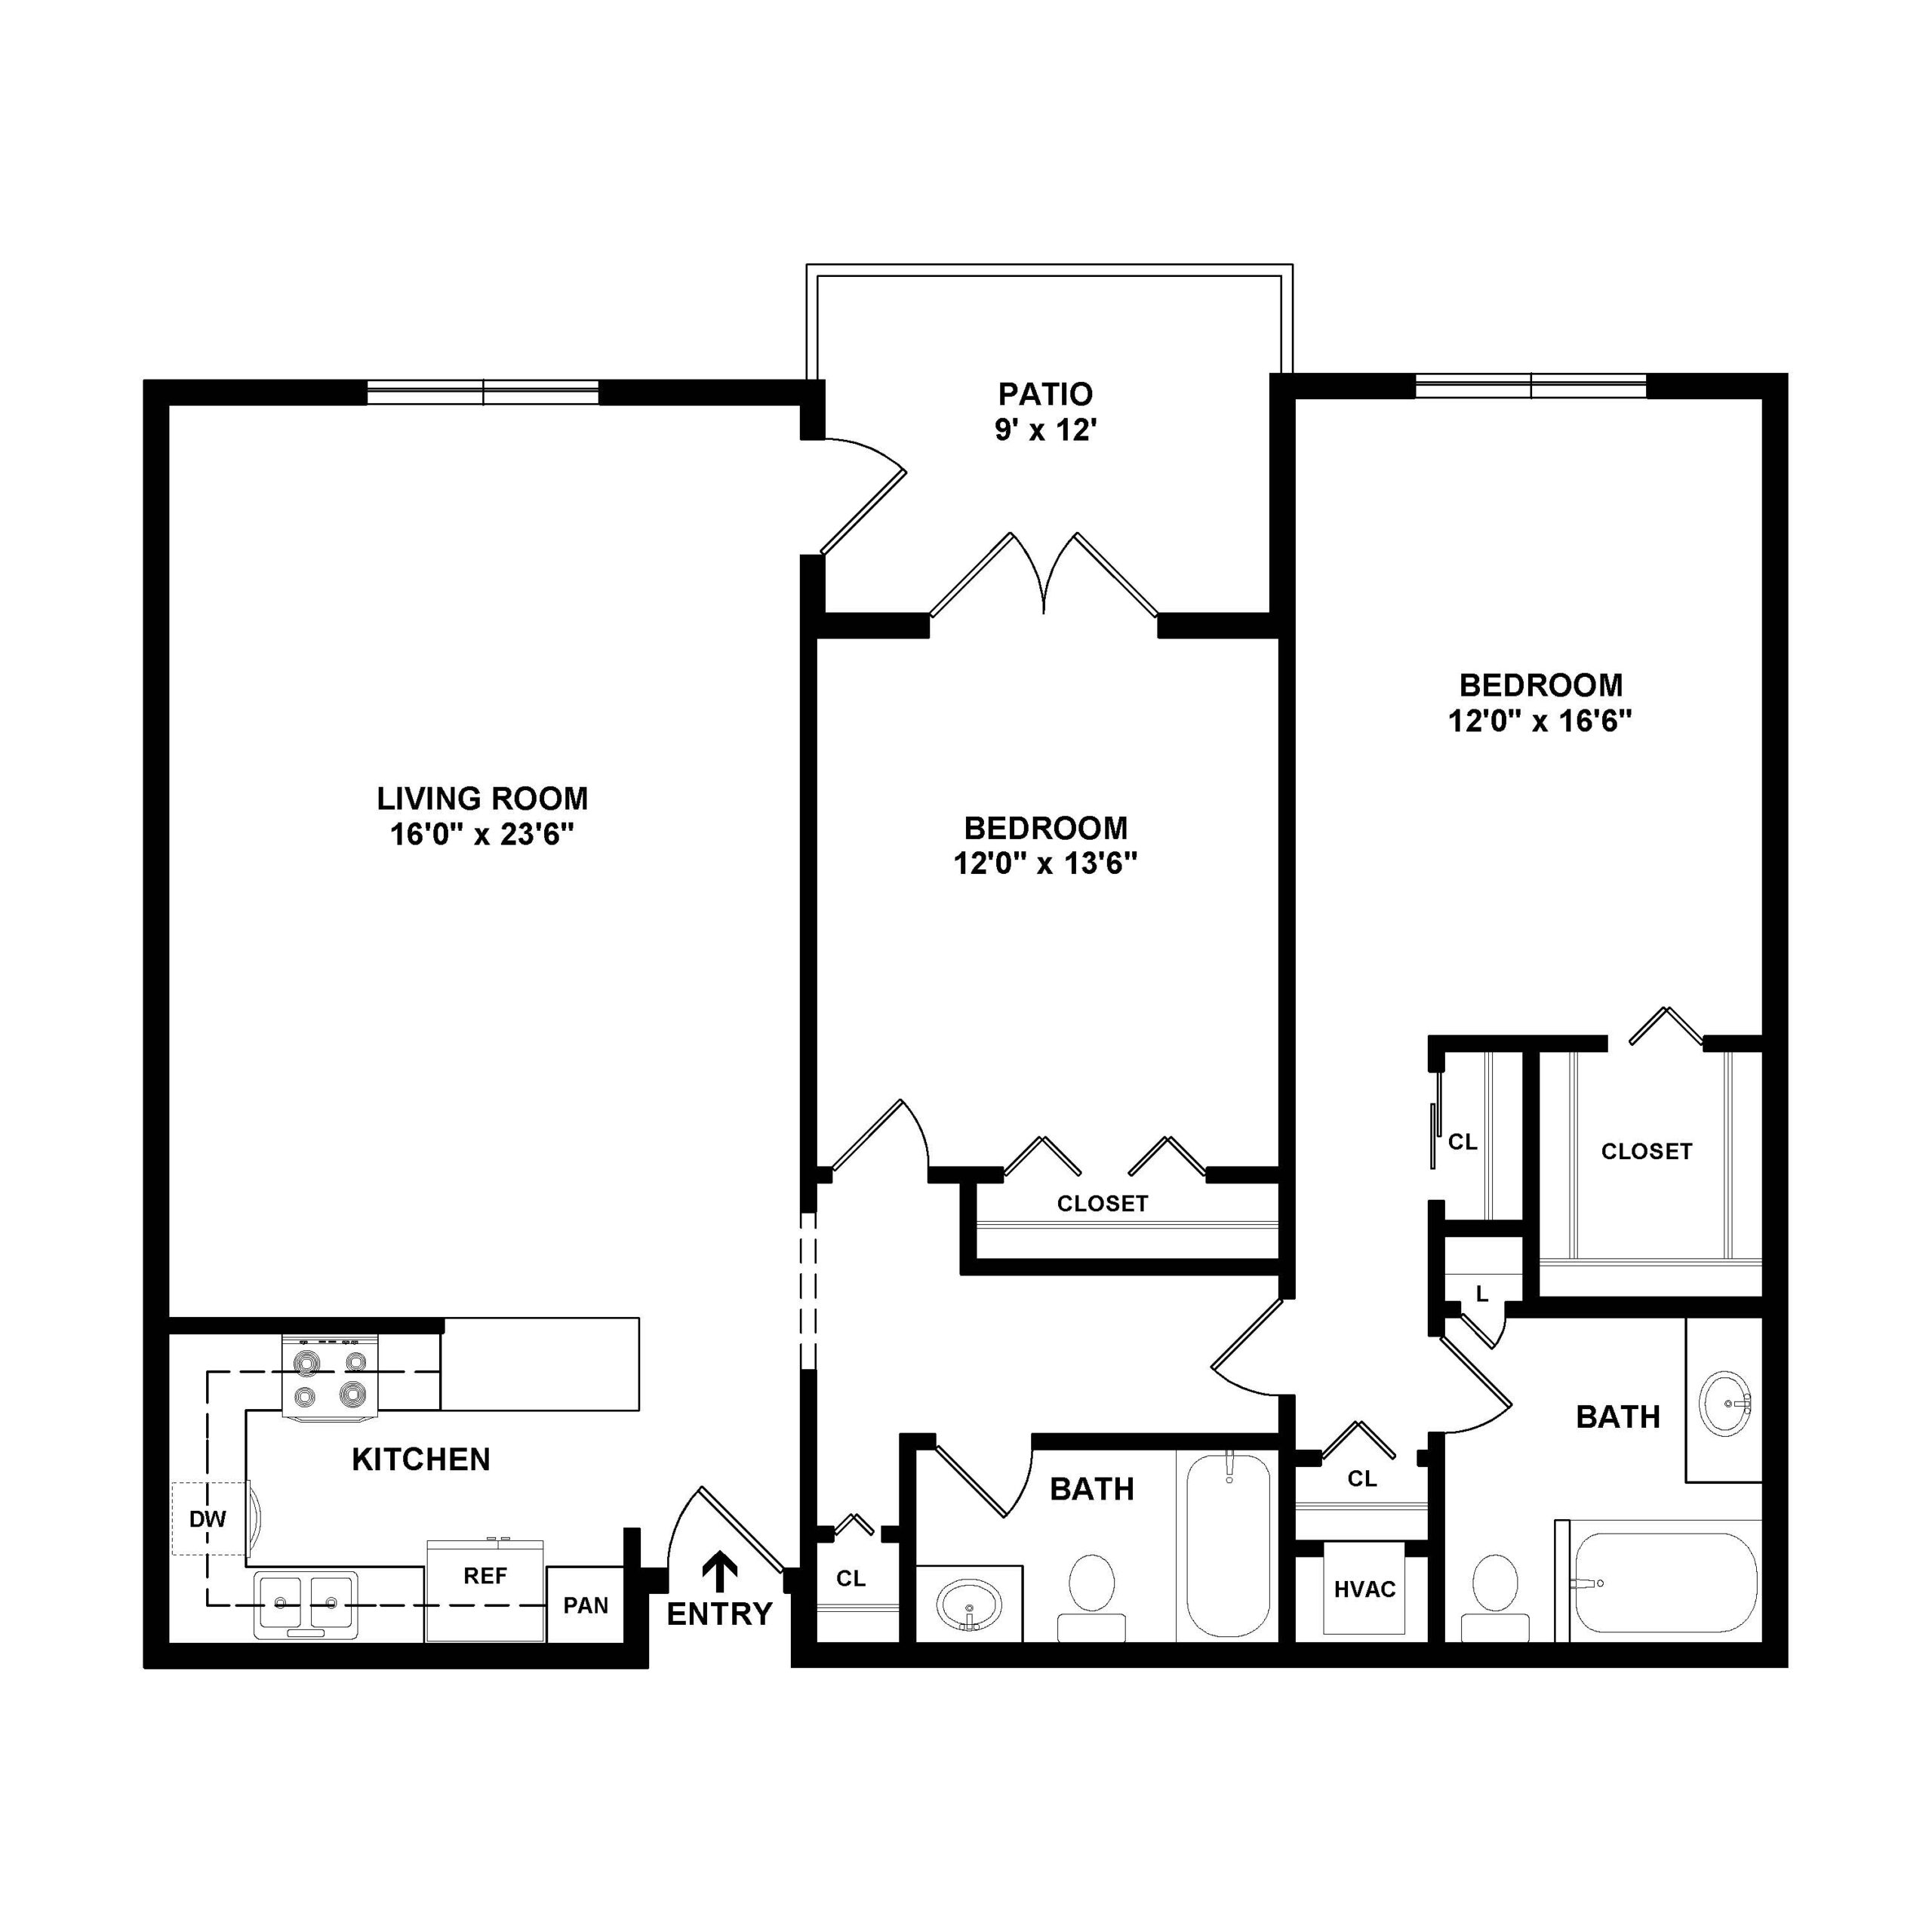
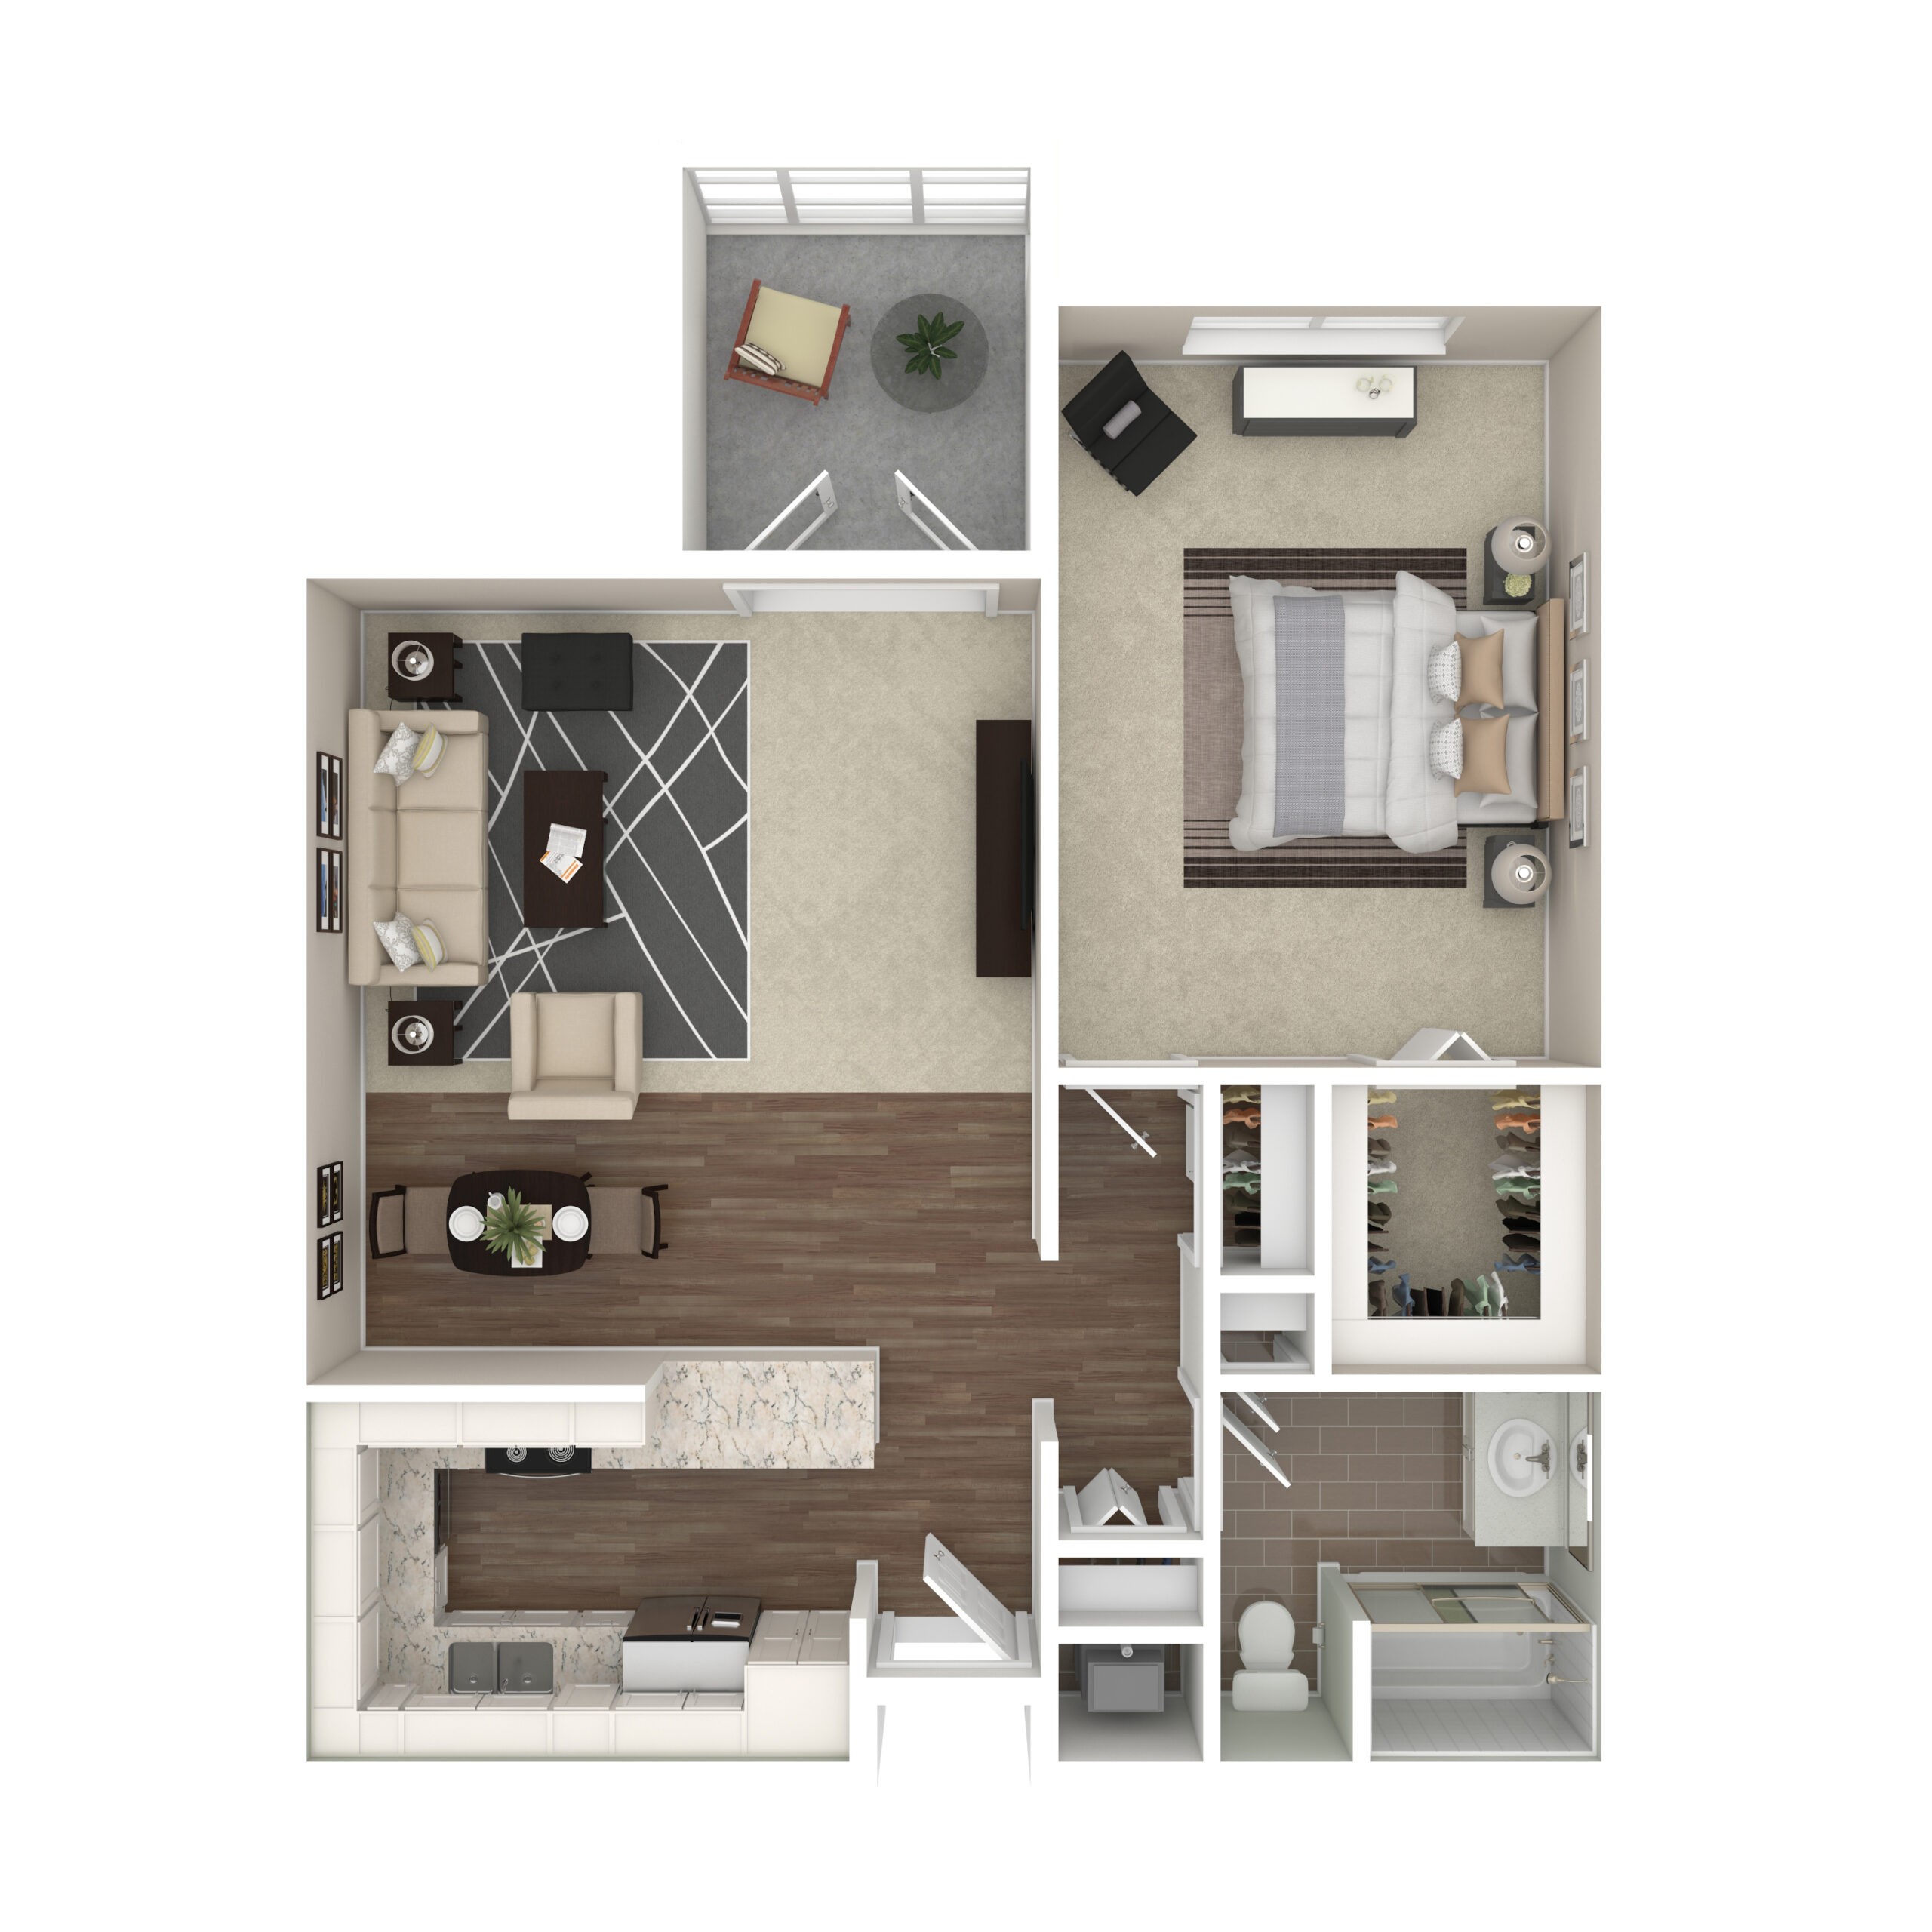
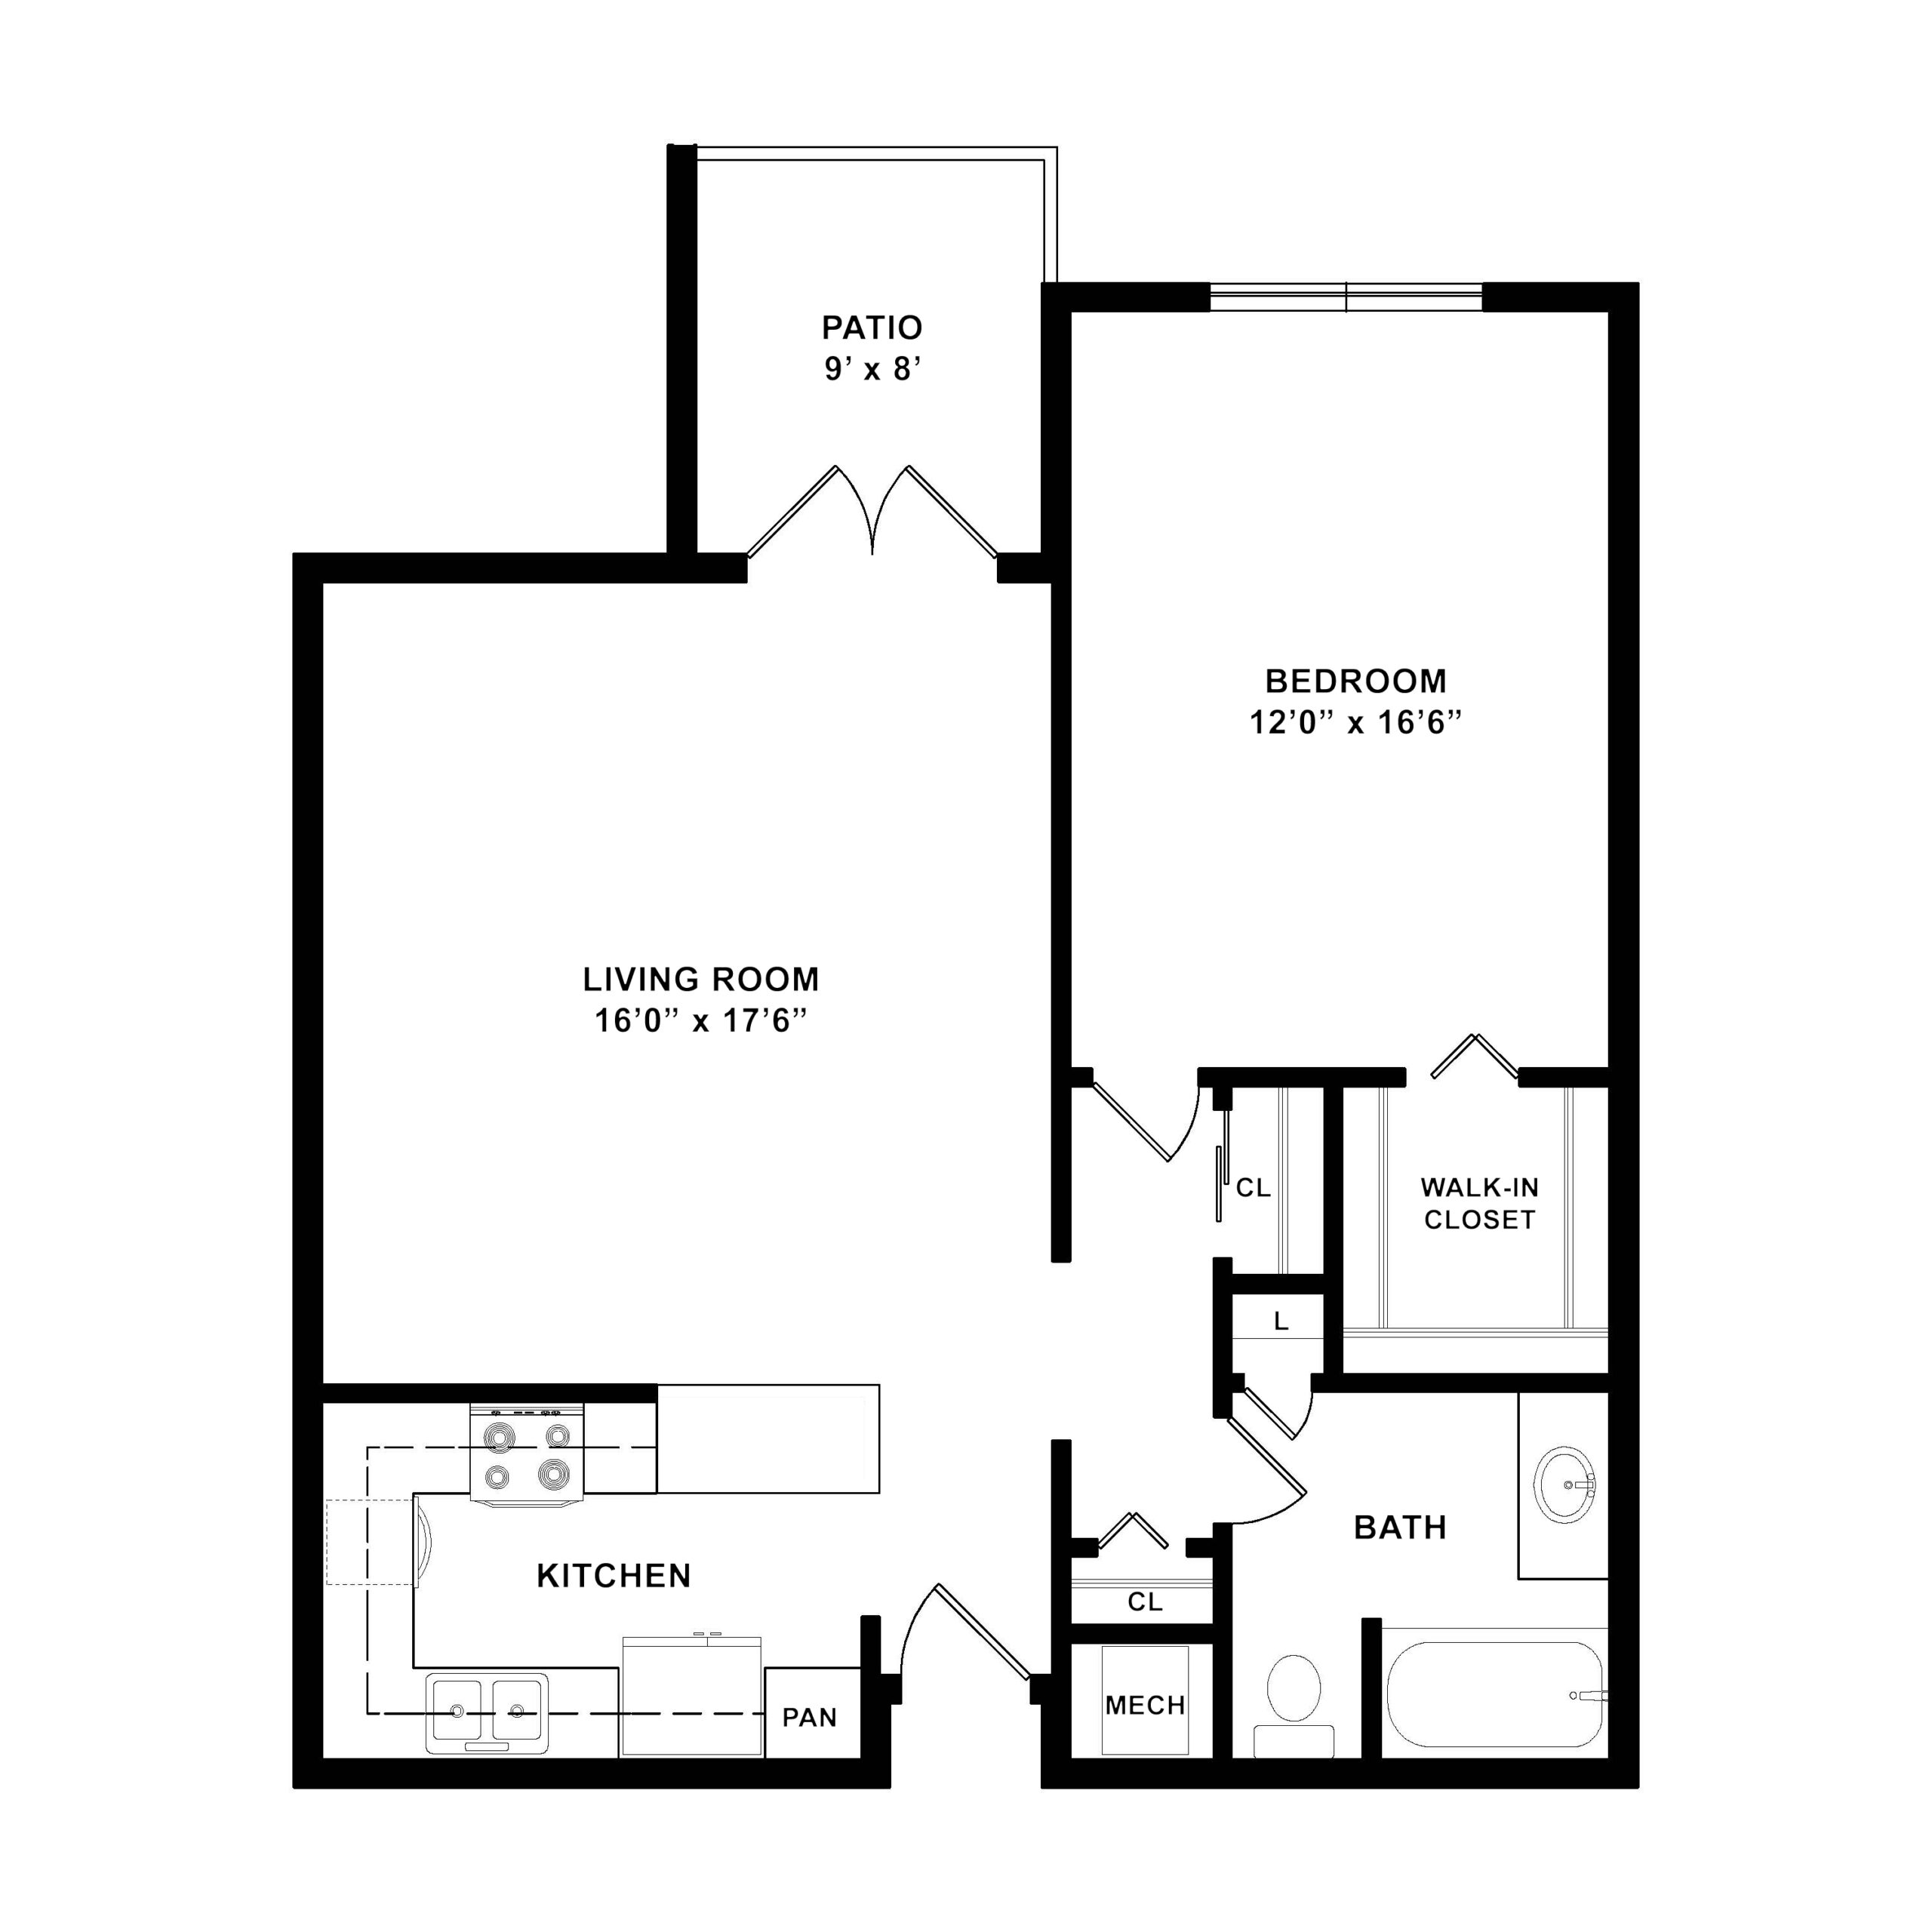
The home’s average stay length of about 27 days mirrors its core mission as a rehabilitation facility. Occupants heal from surgery, illness, or hospitalization with support from a robust nursing team. Total nursing care averages 5 hours 52 minutes per resident day, with registered nurses providing 1 hour 36 minutes of that care. This level of staffing ensures hands-on clinical support alongside physical, occupational, and speech rehabilitation services. The community also offers respite care for short-term stays and maintains a doctor on staff for active medical oversight. The neighborhood around Freedom Village scores 68 for walkability. This means some daily errands can be managed on foot, though most trips involve a quick drive. The building offers both one- and two-bedroom housing options, and residents can access an on-site spa. Monthly rates start at $3,245. The facility was licensed to operate at 110 beds originally, but functions at its current 62-bed capacity, permitting a more controlled environment. This smaller scale supports the individualized care model the home maintains.
State inspections have documented Freedom Village’s compliance with all licensing requirements.
| Staff type | Hours / Day / Resident | vs state avg |
|---|---|---|
|
Registered Nurse (RN)
| 1h 36m per day | ▲ 109% State avg: 46m per day · National avg: 41m per day |
|
LPN / LVN
| 1h 0m per day | ▲ 13% State avg: 53m per day · National avg: 52m per day |
|
Nurse Aide
| 3h 4m per day | ▲ 29% State avg: 2h 23m per day · National avg: 2h 20m per day |
|
Weekend Total Nursing
| 4h 57m per day | ▲ 41% State avg: 3h 31m per day · National avg: 3h 26m per day |
|
Physical Therapist
| 11m per day | ▲ 180% State avg: 4m per day · National avg: 4m per day |
|
Weekend RN
| 1h 7m per day | ▲ 130% State avg: 29m per day · National avg: 28m per day |
Freedom Village is legally operated by CCRC OpCo-Holland, LLC.
Key information about the people who lead and staff this community.
In Michigan, the Department of Licensing and Regulatory Affairs (LARA) conducts unannounced inspections and investigations to ensure long-term care facilities comply with state health codes.
Deficiencies
| This Facility | MI Average | vs. MI Avg |
|---|---|---|---|
|
Total deficiencies
| 0 | 8 | This facility has 100% fewer total deficiencies than a typical Michigan nursing home (0 vs. MI avg 8).↓ 100% better |
Inspections
| This Facility | MI Average | vs. MI Avg |
|---|---|---|---|
|
Total inspections
| 4 | 5 | This facility has had 20% fewer total inspections than the Michigan average (4 vs. MI avg 5). More inspections can mean more regulatory scrutiny rather than worse care.↓ 20% fewer |
Federal penalties imposed by CMS for regulatory violations, including civil money penalties (fines) and denials of payment for new Medicare/Medicaid admissions.
Source: CMS Penalties Database
No penalties in the past 3 years
No civil money penalties or payment denials were reported in the last 3 years.
These measures show how residents usually do over time at this home, based on health outcomes and preventive care.
Michigan average: 24.2%
Michigan average: 11.5%
Michigan average: 0.8%
Michigan average: 53.7%
Michigan average: 50.6%
Quality measures are calculated from Minimum Data Set (MDS) assessments. For most measures, lower percentages indicate better care quality.
22% of new residents, usually for short-term rehab.
78% of new residents, often for short stays.
Based on CMS SNF Cost Report for fiscal year ending in 12/2023.
Pets Allowed
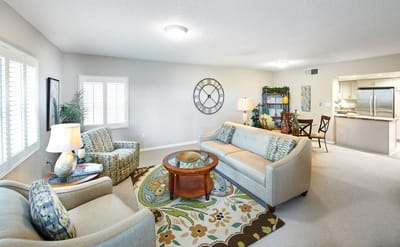
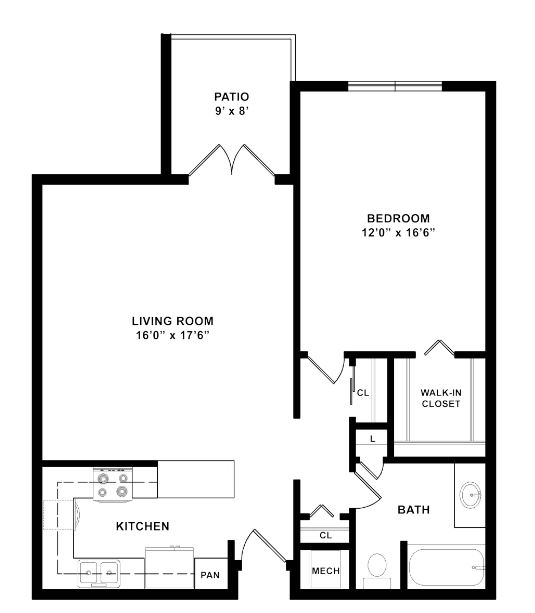
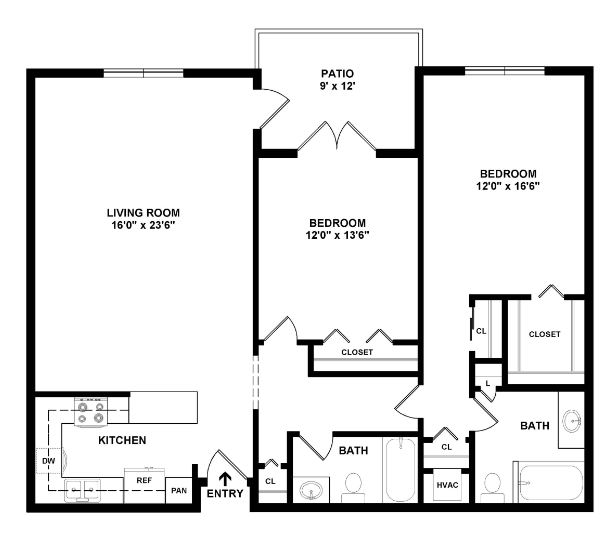
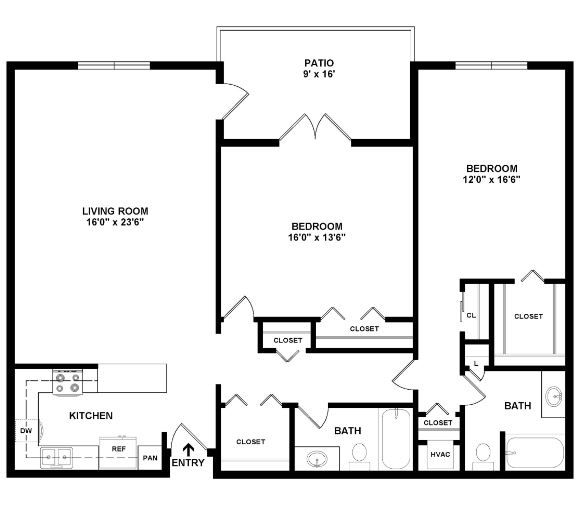
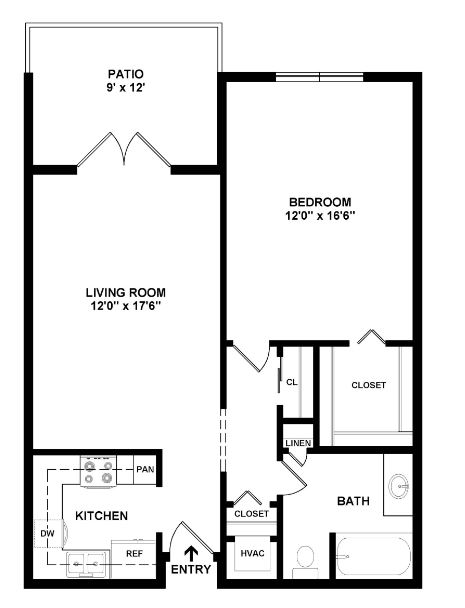
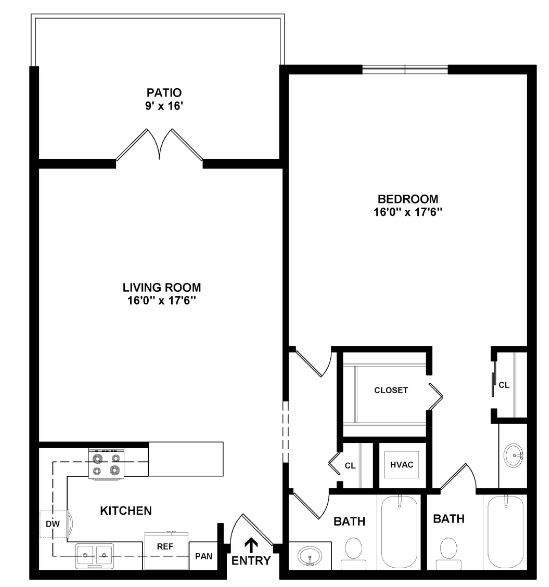
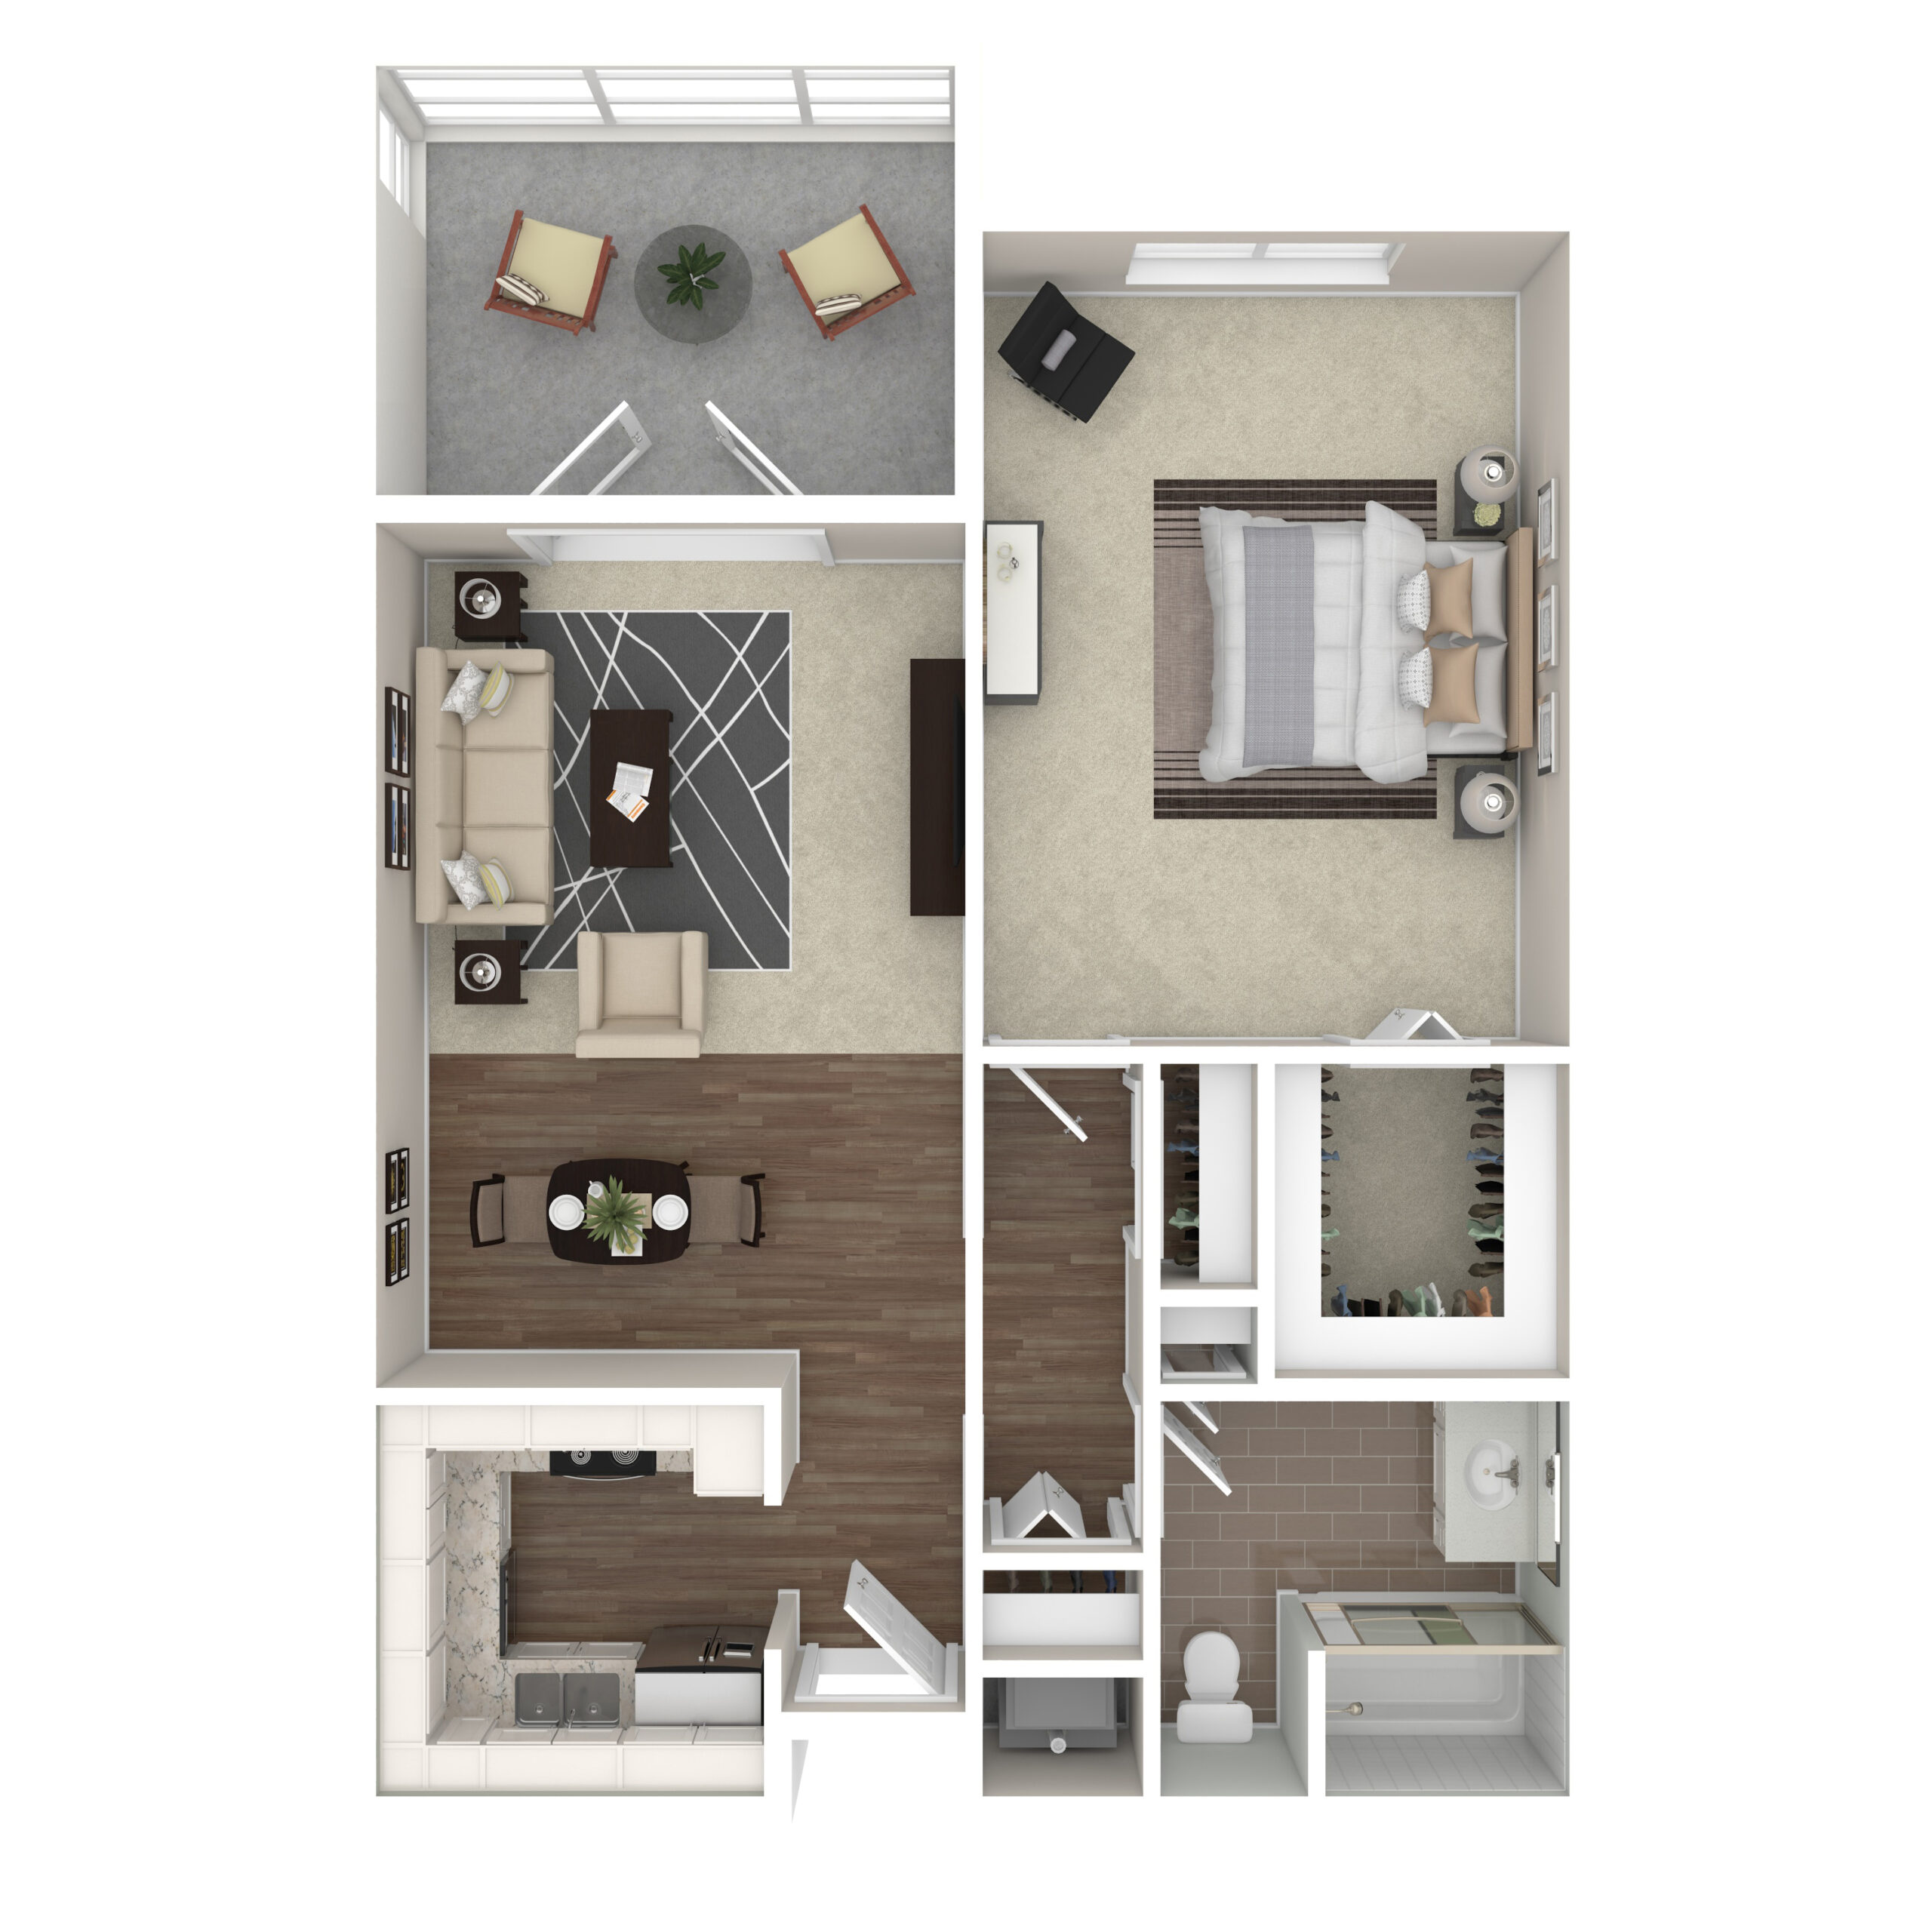
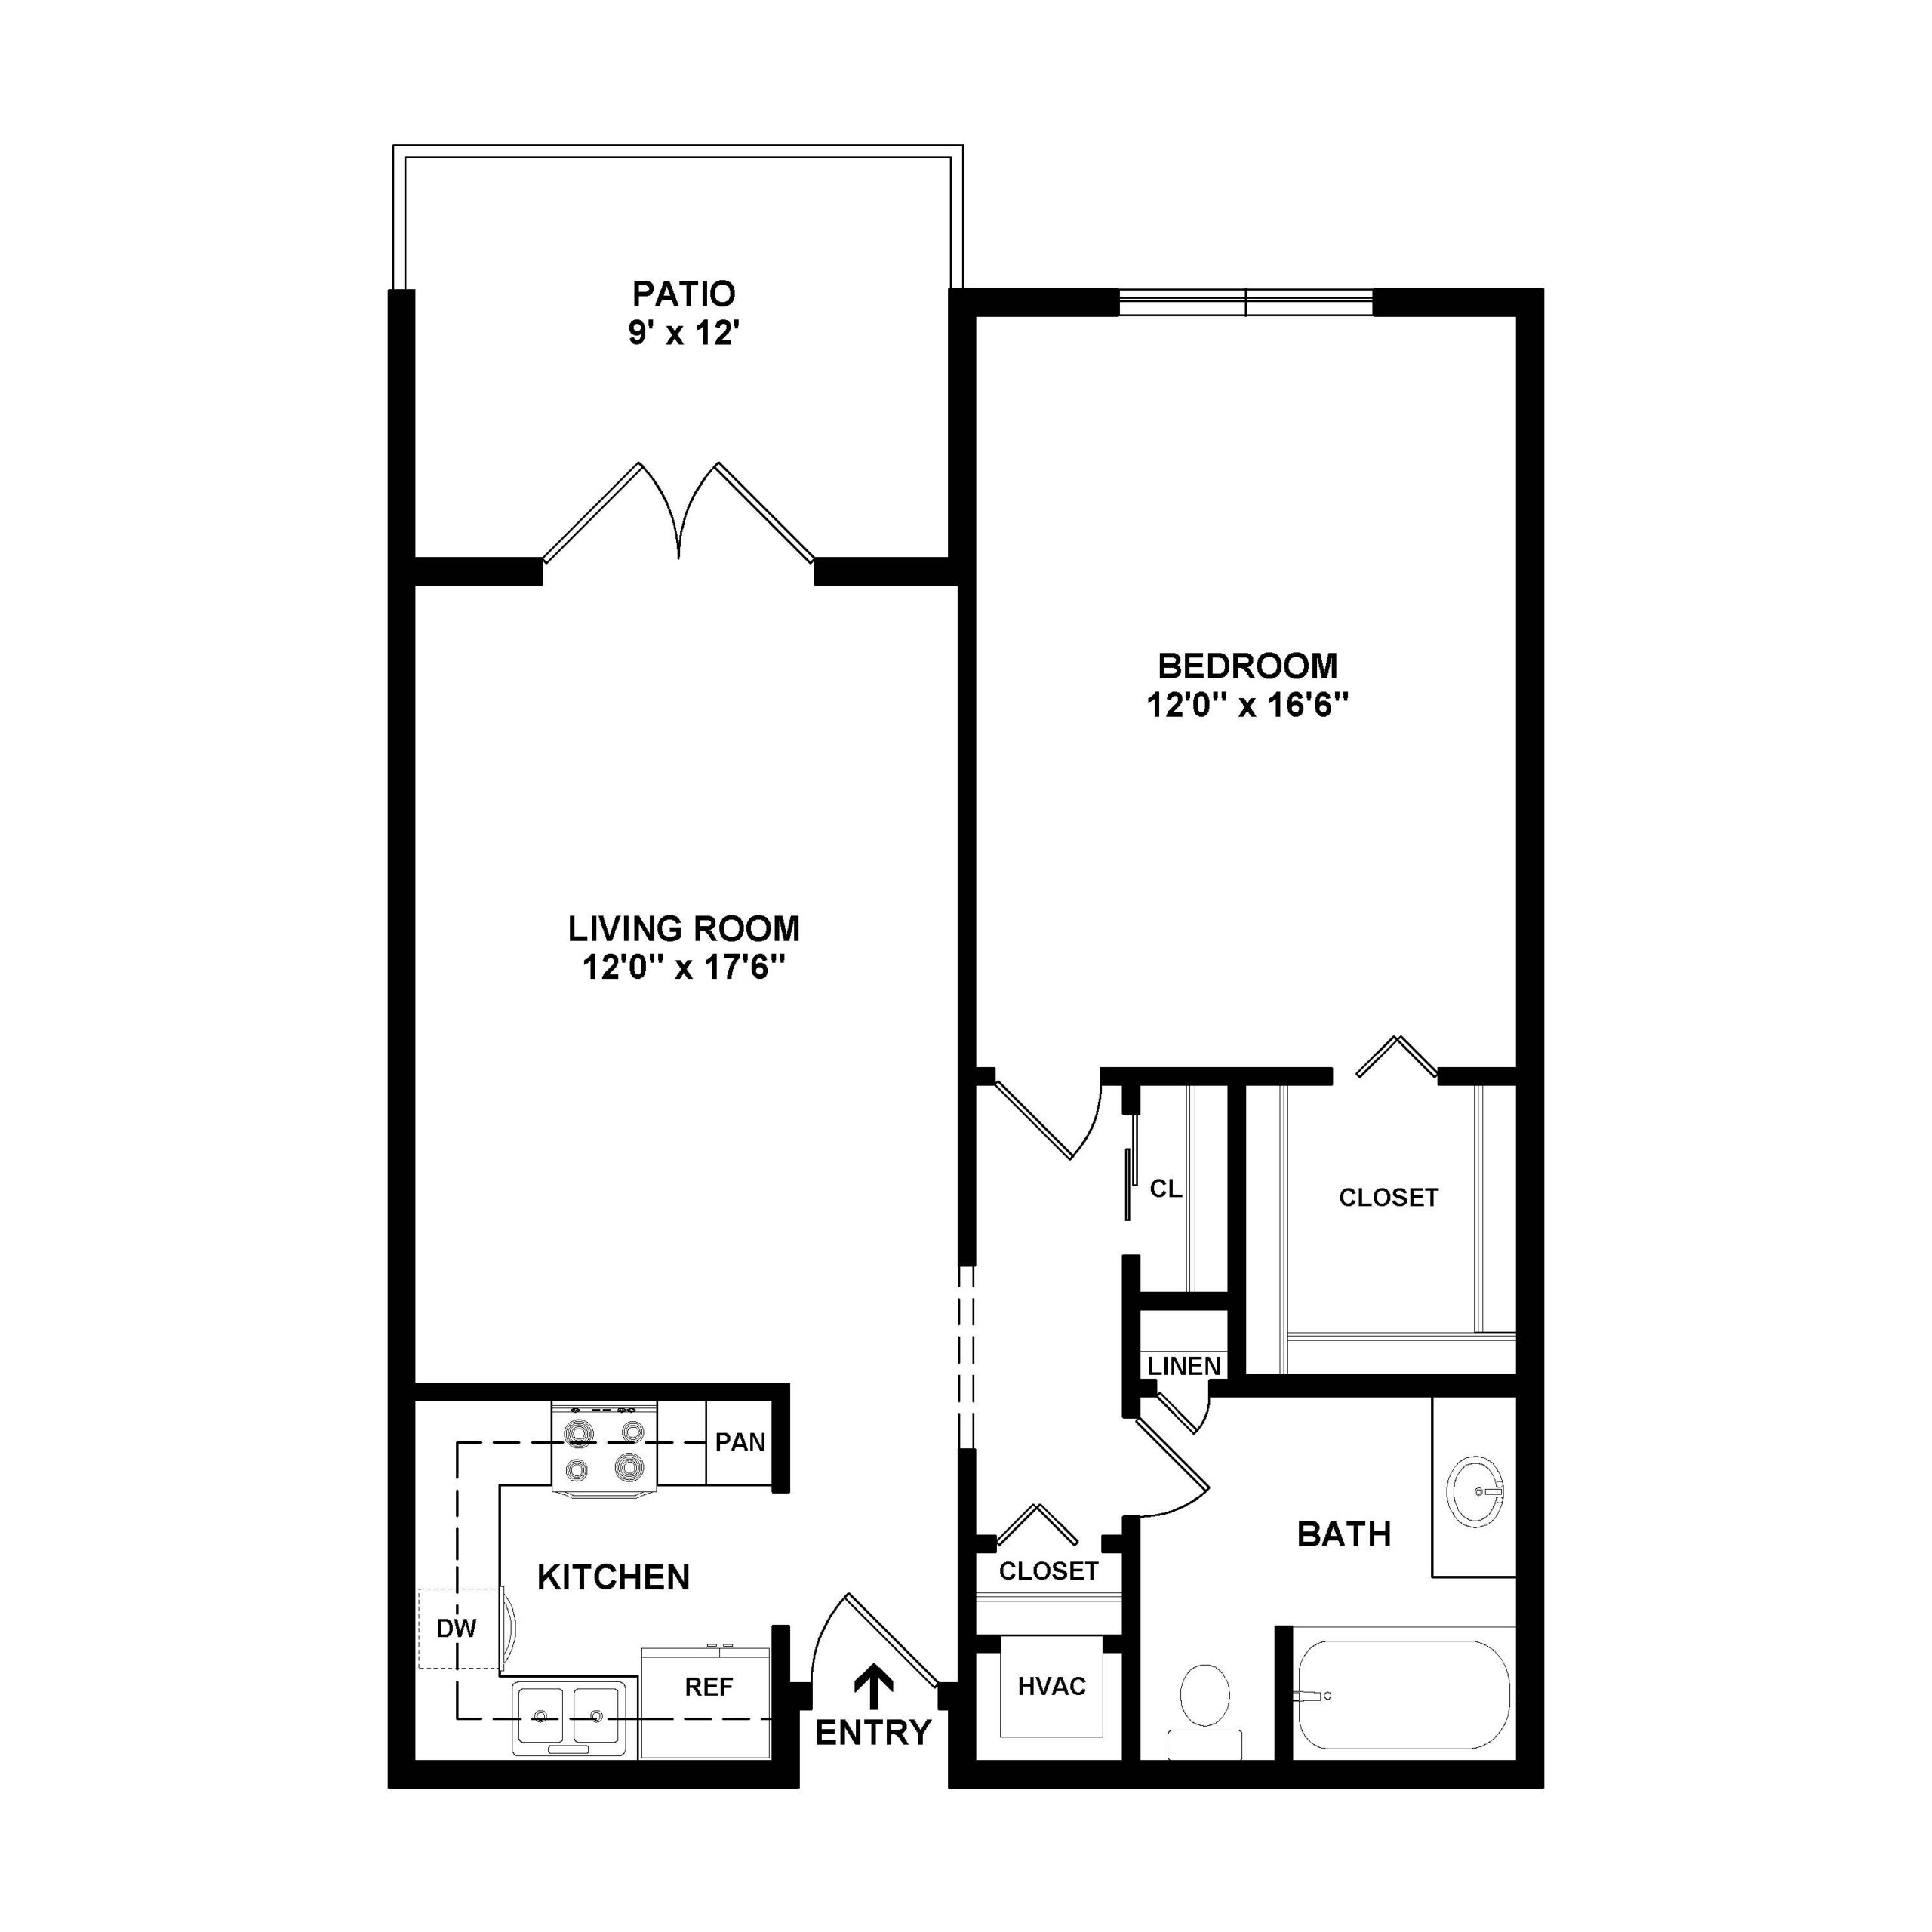
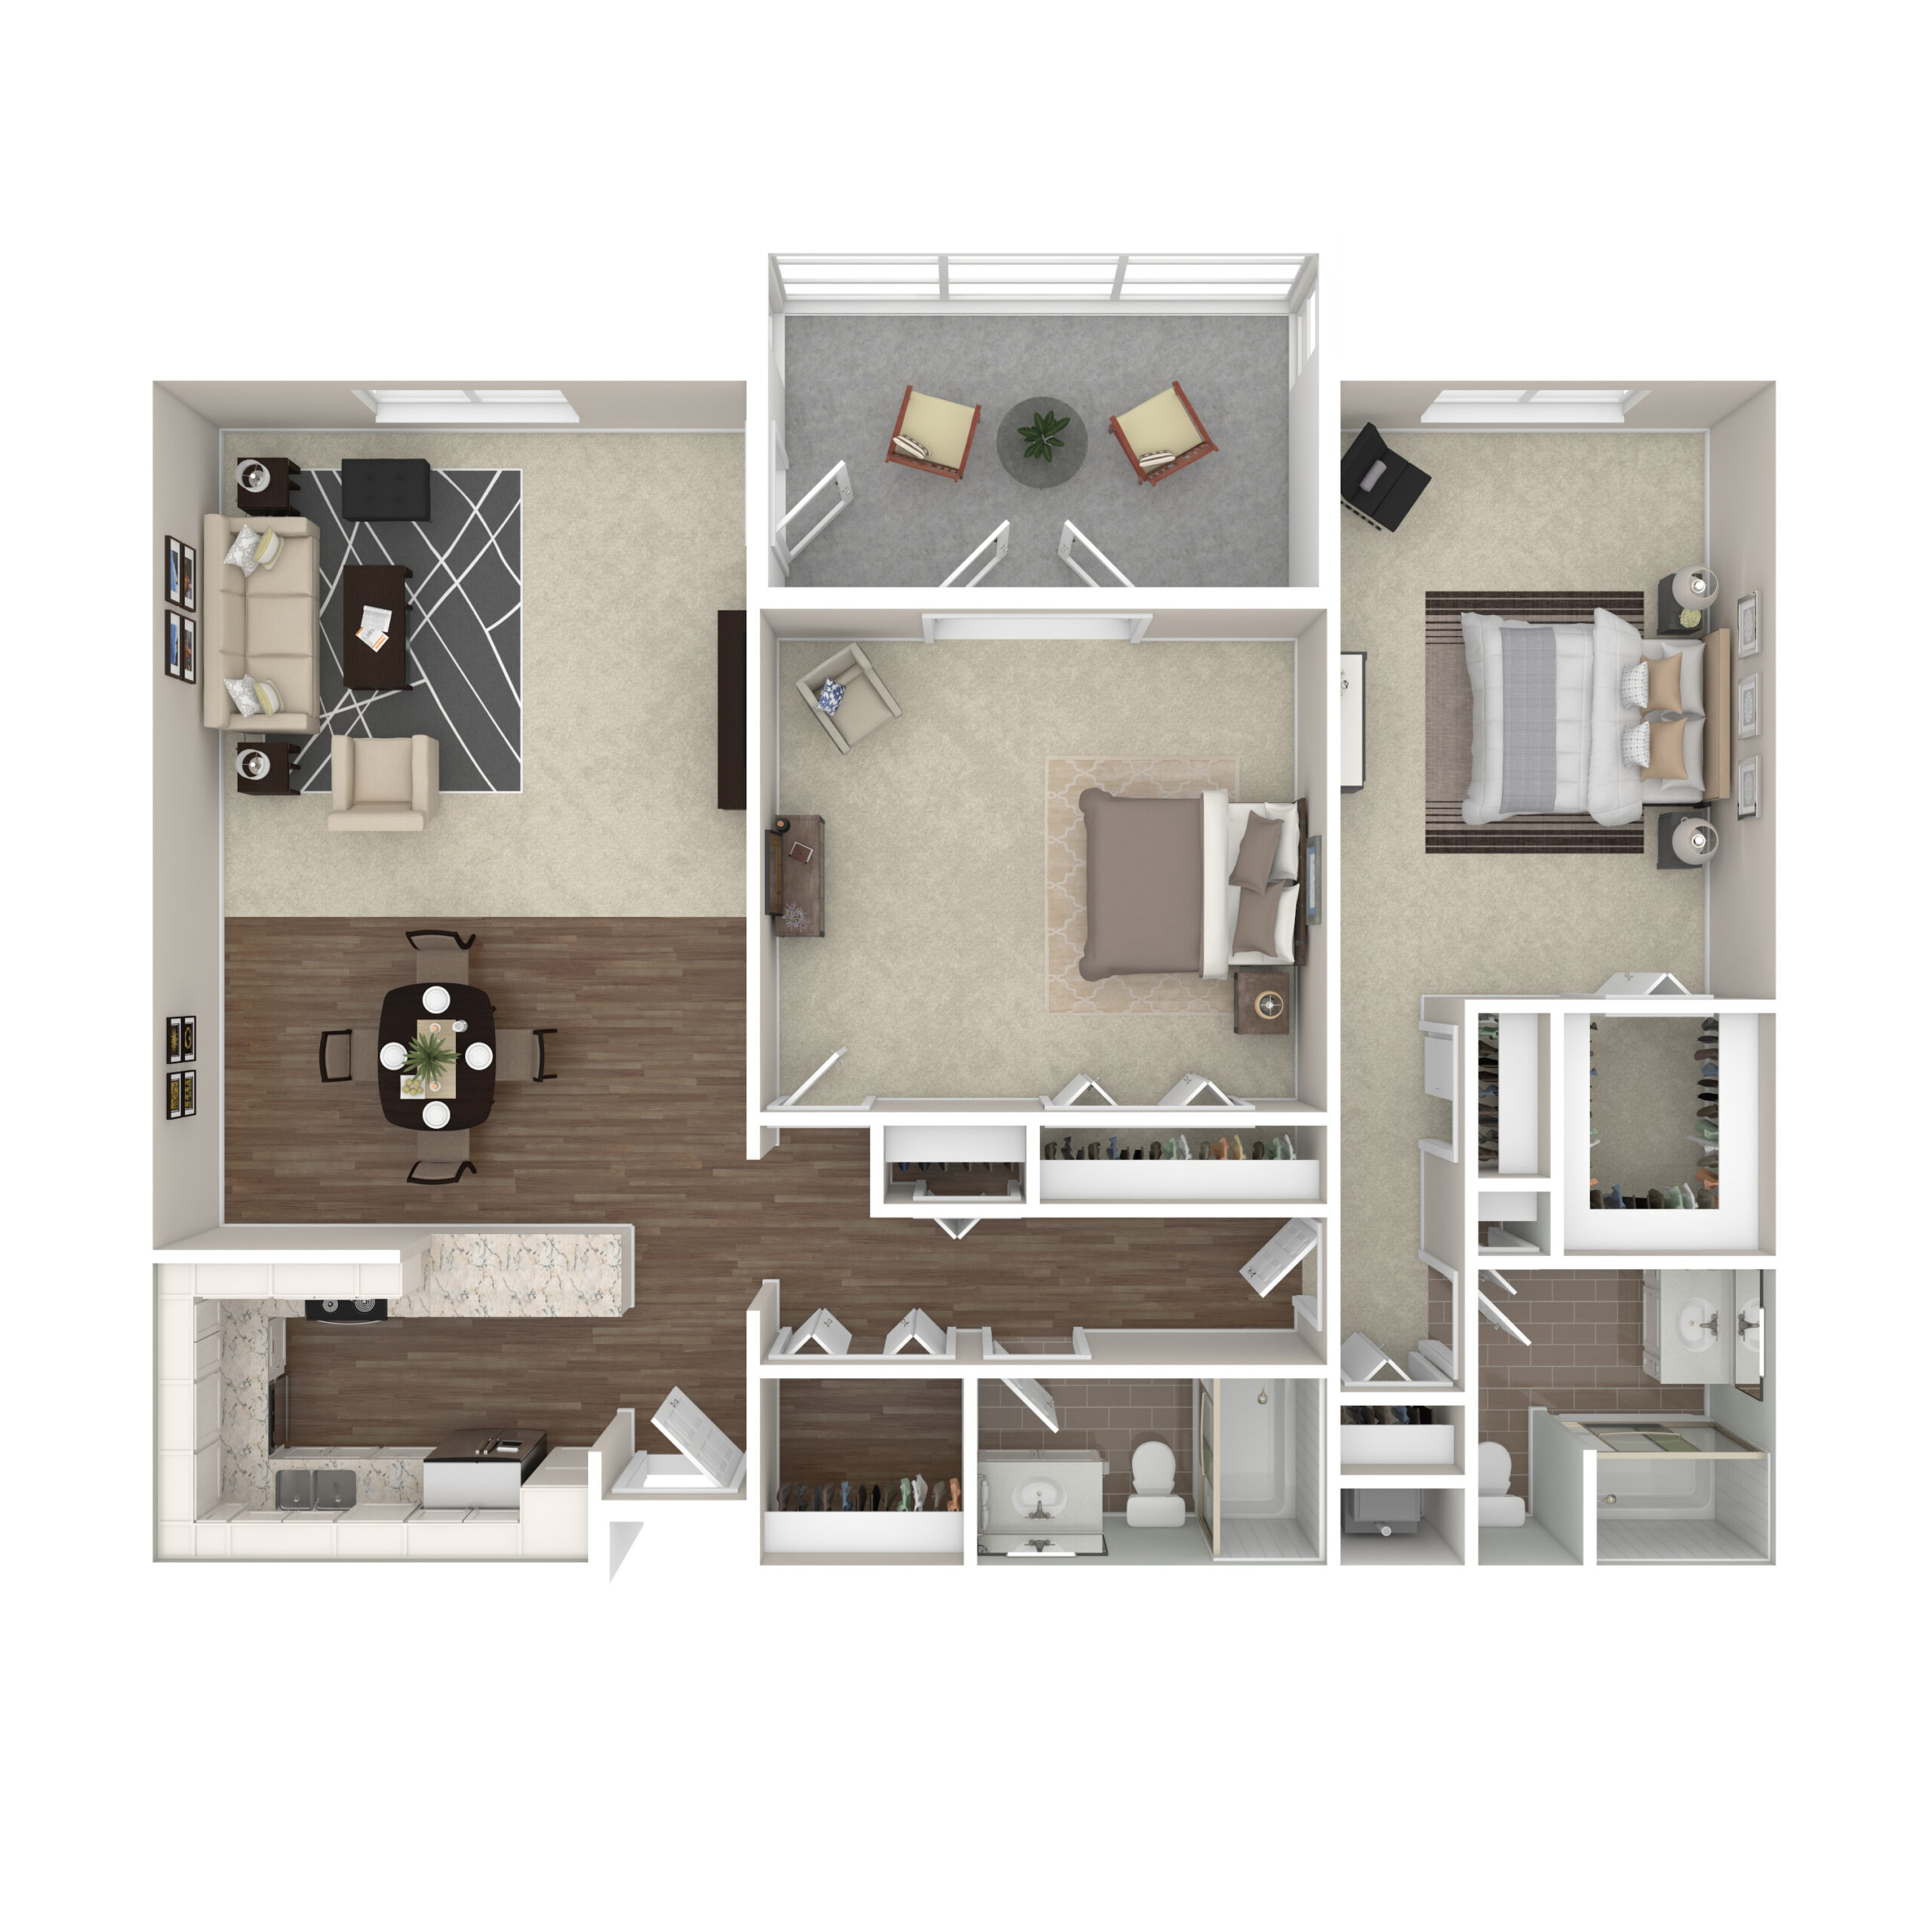
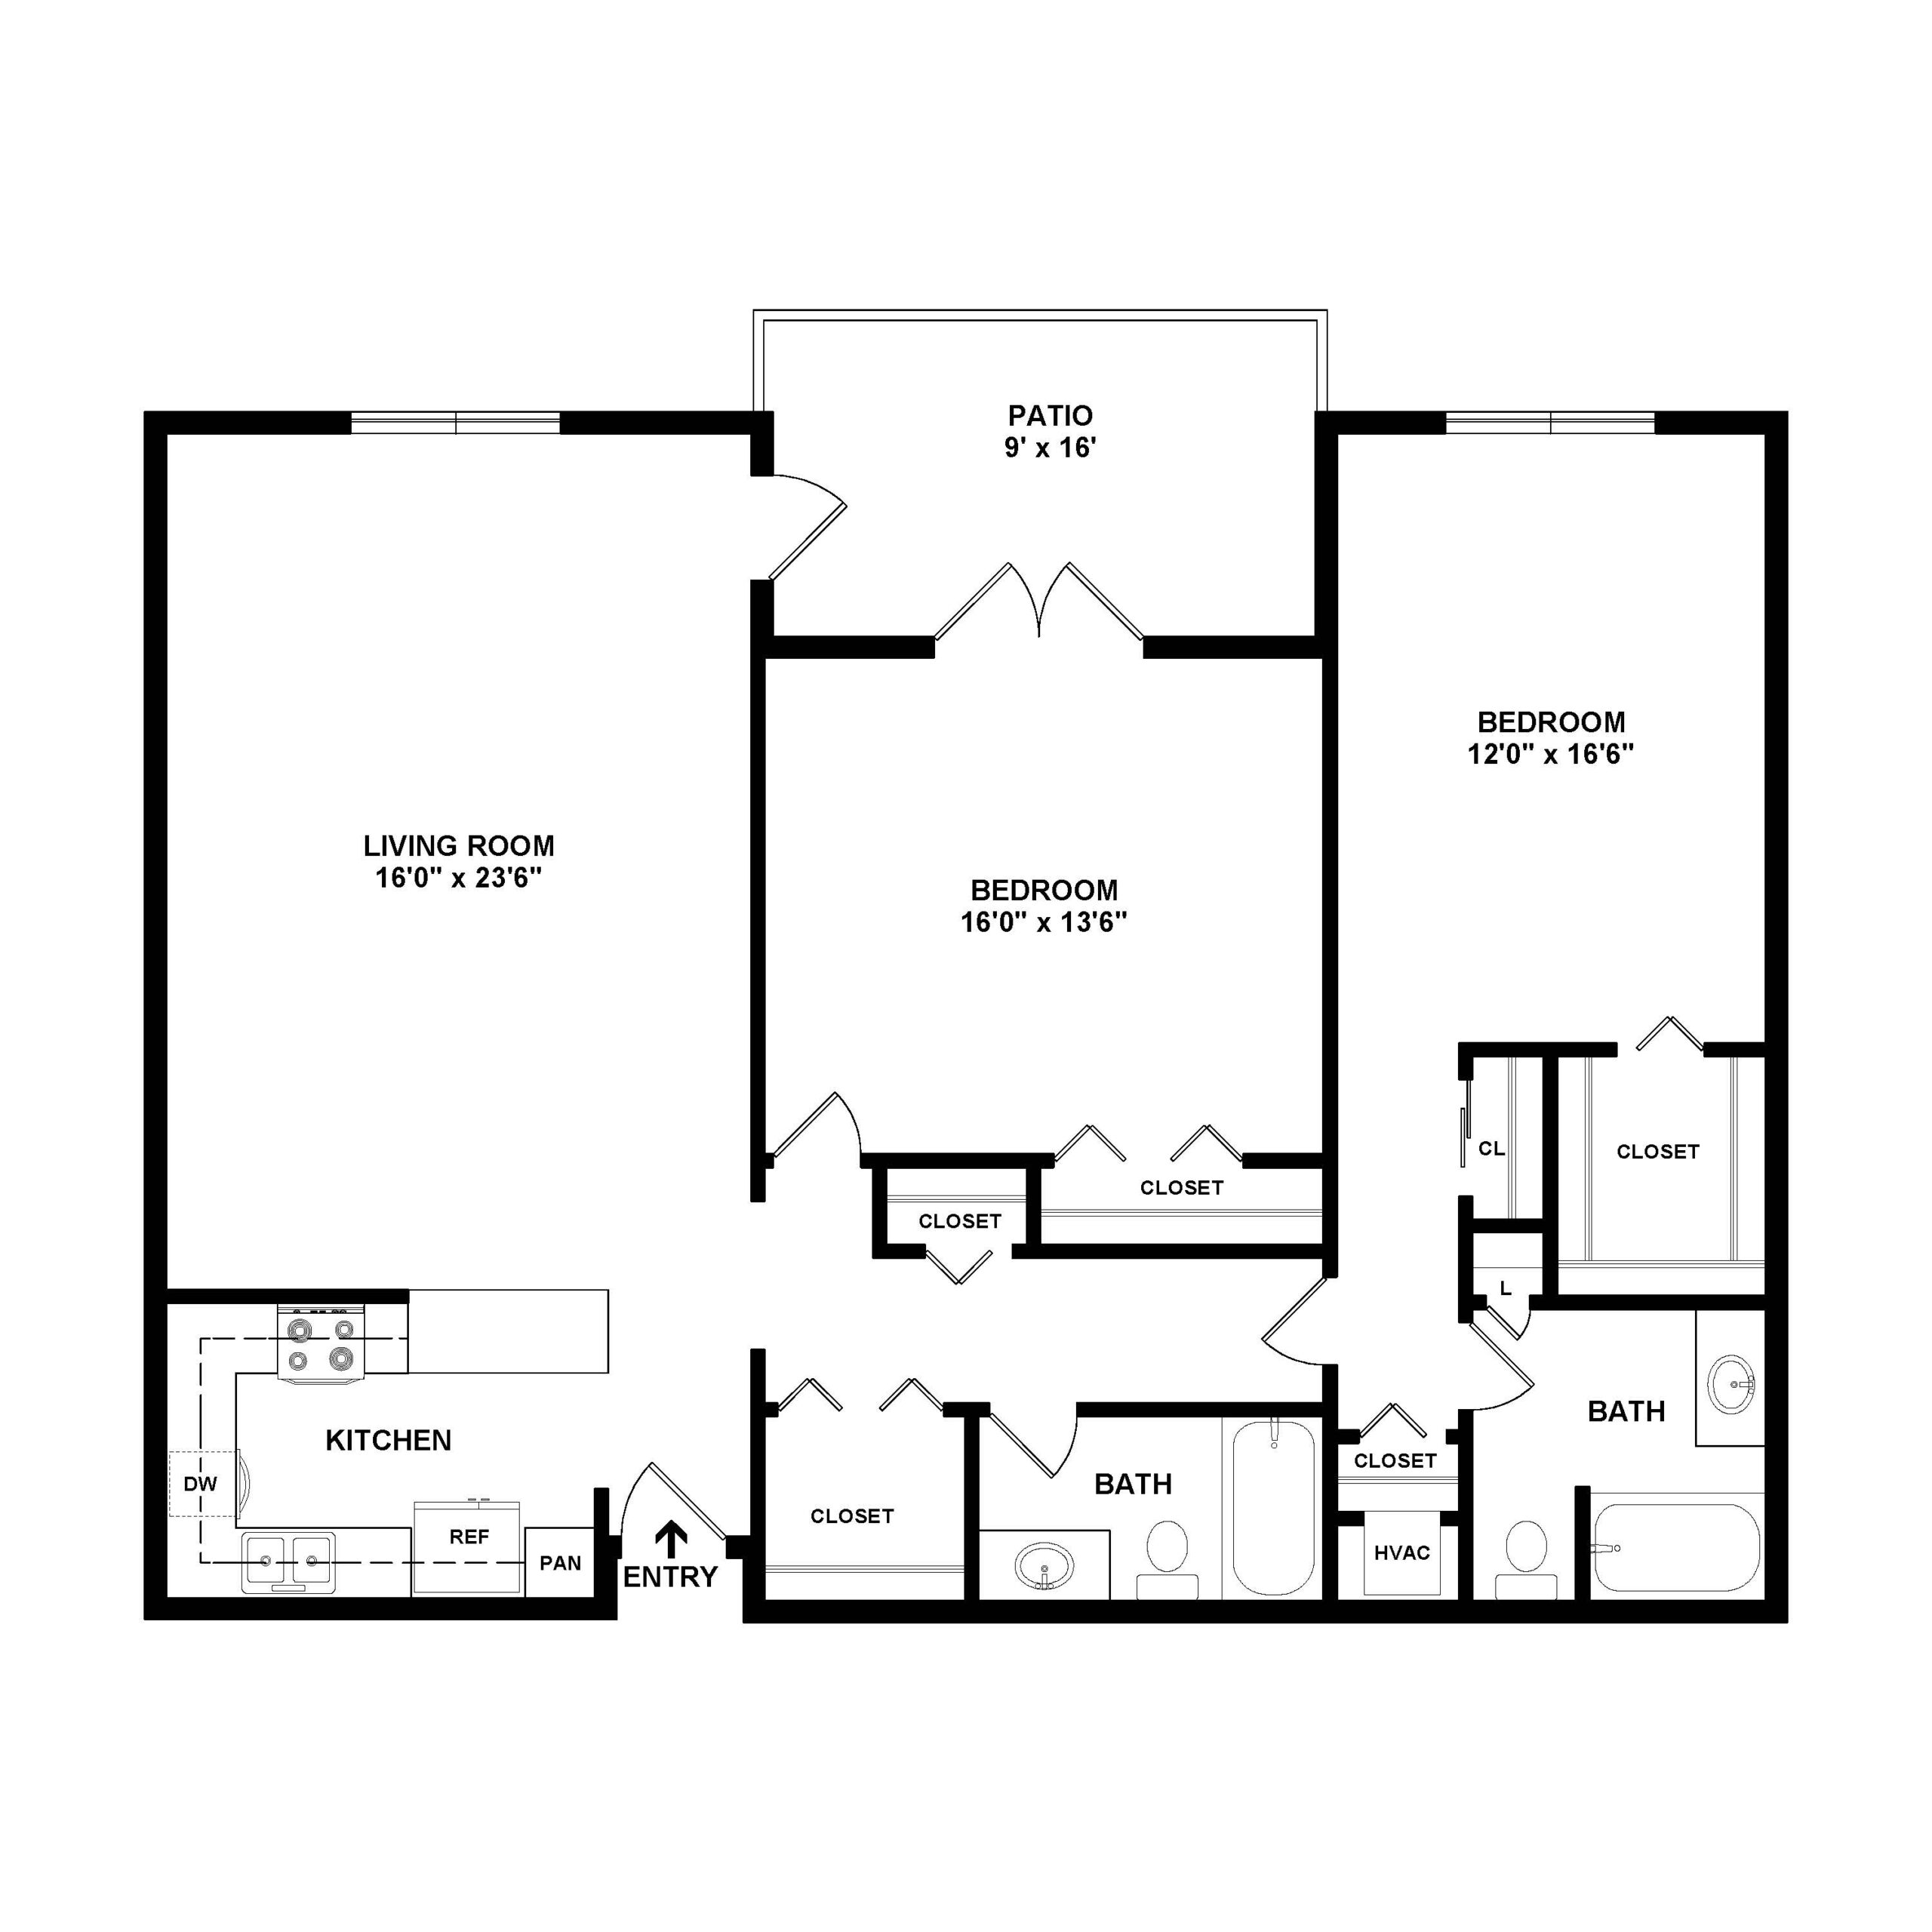
Housing Options: 1 Bed / 2 Bed
Building Type: Mid-rise
Transportation Services
Fitness and Recreation
Residents typically stay for brief periods, with frequent admissions and discharges throughout the year.
Most new residents arrive under private pay (78% of admissions), and a typical private pay stay runs around 5 - 6 months.
Coverage residents most often arrive under.
Coverage residents most often leave under.
![]() 0.9 miles from city center
0.9 miles from city center
![]() Estimated distance in miles from Holland's city center to Freedom Village's address, calculated via Google Maps.
Estimated distance in miles from Holland's city center to Freedom Village's address, calculated via Google Maps.
Add your location
Info below is compiled from CMS reports & the MI Licensing & Regulatory Affairs (LARA), senior community websites & trusted data sources such as Walk Score & BBB.
Communities are listed from highest to lowest based on our ranking methodology.
| Freedom Village | NH AL IL MC RC SNF | Holland (Columbia Avenue) | 533
Facility
533
MI AVG
74
Rank
#1 / 430 | - | - | 5.87 | +16% | +37% | $0 | 9 | 3.0 | - | 27 | - |
78
Facility
78
MI AVG
39
Rank
#36 / 703 | Steven Levato | $10.0MFiscal year ending 12/2023 | $11.5MFiscal year ending 12/2023 | 114.9%Fiscal year ending 12/2023 | 235548 | ||||
| Medilodge of Holland | NH RC SNF | Holland (Holland Heights) | 77
Facility
77
MI AVG
74
Rank
#192 / 430 |
94.3%
Facility
94.3%
MI AVG
74
Rank
#20 / 119 | +27% | 3.98 | -15% | -7% | $0 | 11 | 2.8 | 1 | 73 | - |
2
Facility
2
MI AVG
39
Rank
#672 / 703 | - | $8.9MFiscal year ending 12/2023 | $4.3MFiscal year ending 12/2023 | 47.8%Fiscal year ending 12/2023 | 235638 | ||||
| Resthaven Care Center | NH AL HC IL MC RC SNF | Holland | 145
Facility
145
MI AVG
74
Rank
#35 / 430 |
95.4%
Facility
95.4%
MI AVG
74
Rank
#14 / 119 | +29% | 4.71 | -35% | +10% | $0 | 29 | 5.8 | 1 | 138 | - |
45
Facility
45
MI AVG
39
Rank
#267 / 703 | Nathan Baumann | $20.4MFiscal year ending 12/2023 | $10.6MFiscal year ending 12/2023 | 52%Fiscal year ending 12/2023 | 235378 |
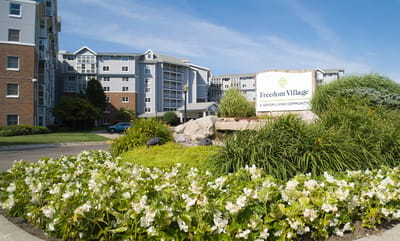
Freedom Village is located in Holland, Michigan.
Here are the financial assistance programs available to residents in Michigan.
Freedom Village is in the Columbia Avenue neighborhood of Holland.
Freedom Village is legally operated by CCRC OpCo-Holland, LLC.
Freedom Village has a walk score of 68. Moderately walkable. Some errands can be accomplished on foot, with a mix of nearby amenities.
According to MI state health department records, Freedom Village's license number is AH700364503.
According to MI state health department records, Freedom Village's license expires on July 31, 2027.
Freedom Village has been operating for approximately 35 years, based on available licensing and registration records.
Yes — see the floorplan options available at Freedom Village on this page.
Care Cost Calculator: See Prices in Your Area
Nursing Home Data Explorer
Don’t Wait Too Long: 7 Red Flag Signs Your Parent Needs Assisted Living Now
The True Cost of Assisted Living in 2025 – And How Families Are Paying For It
Understanding Senior Living Costs: Pricing Models, Discounts & Financial Assistance


