Explore Open Rooms

1 Contact details
2 What type of senior care service are you looking for?
3 What budget do you have in mind for senior care?
4 How soon do you need to find care?
5 Additional details

Thank you for your interest!

Our team will be in touch shortly to help with next steps.

Nursing Home

Garden Spring Nursing and Rehabilitation Center

Nursing Home

Garden Spring Nursing and Rehabilitation Center

1113 Easton Rd, Willow Grove, PA 19090 View map
Overview of Garden Spring Nursing and Rehabilitation Center

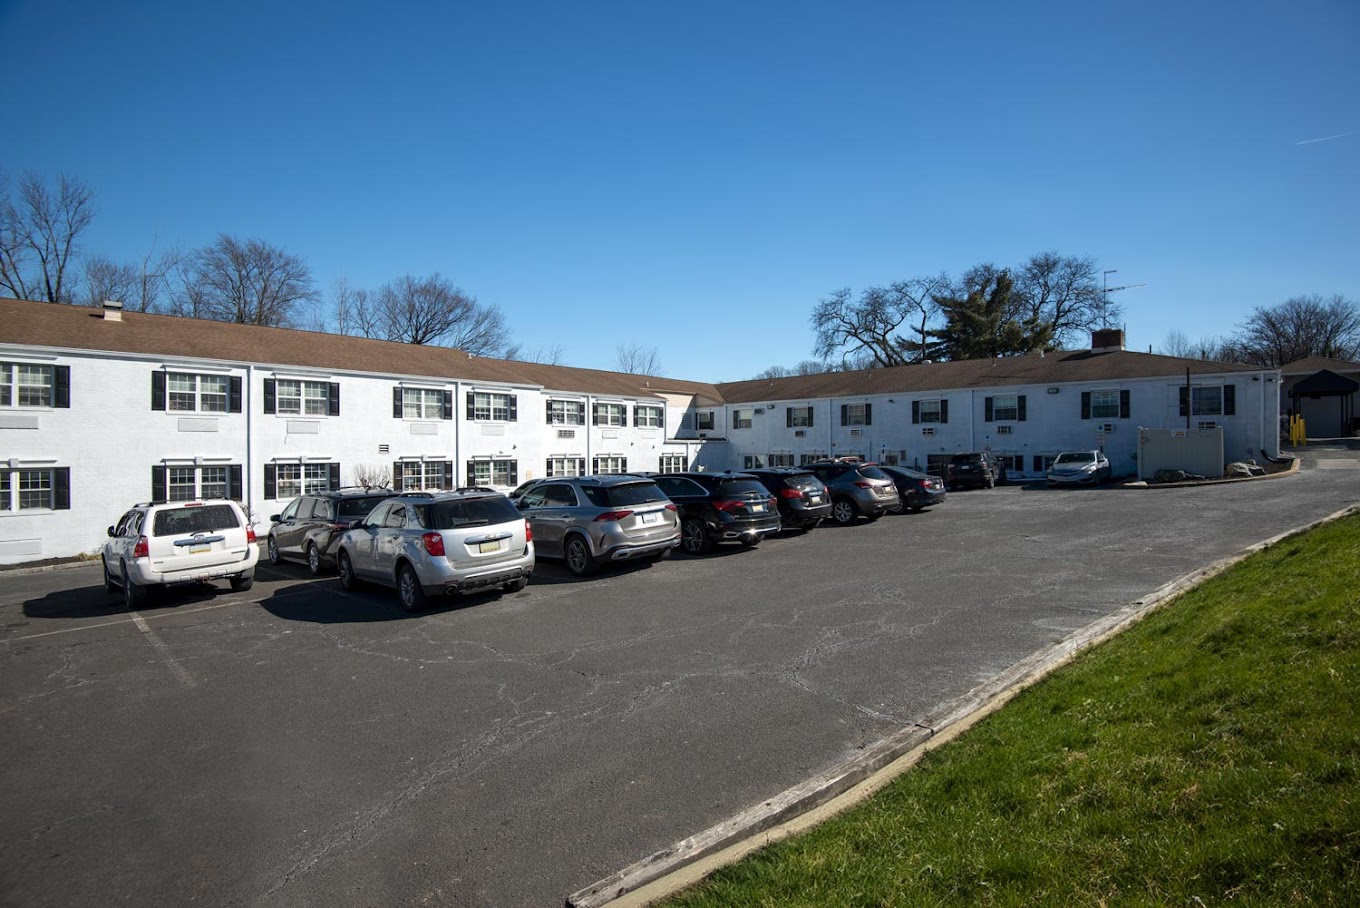
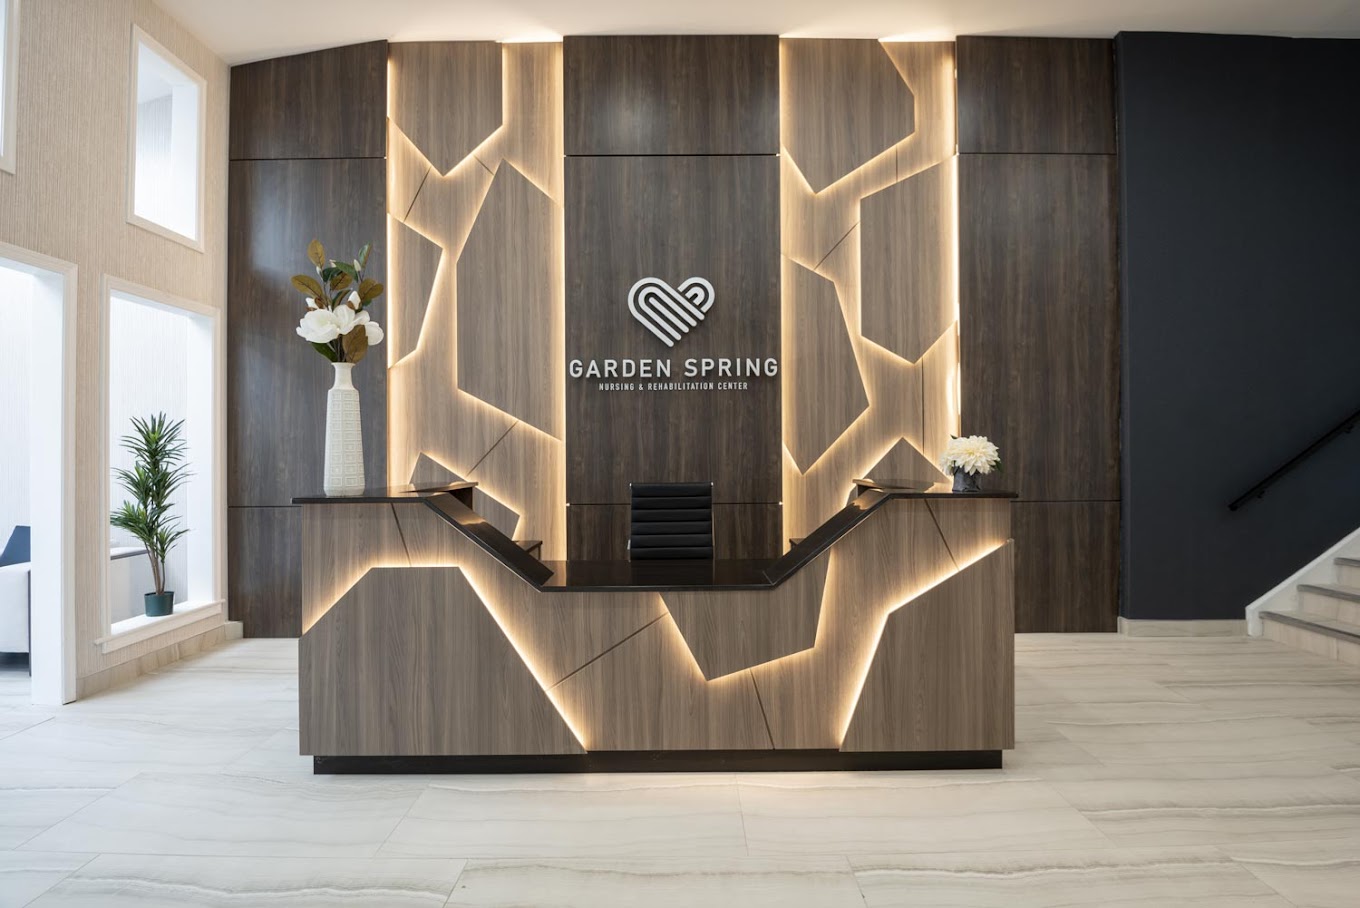
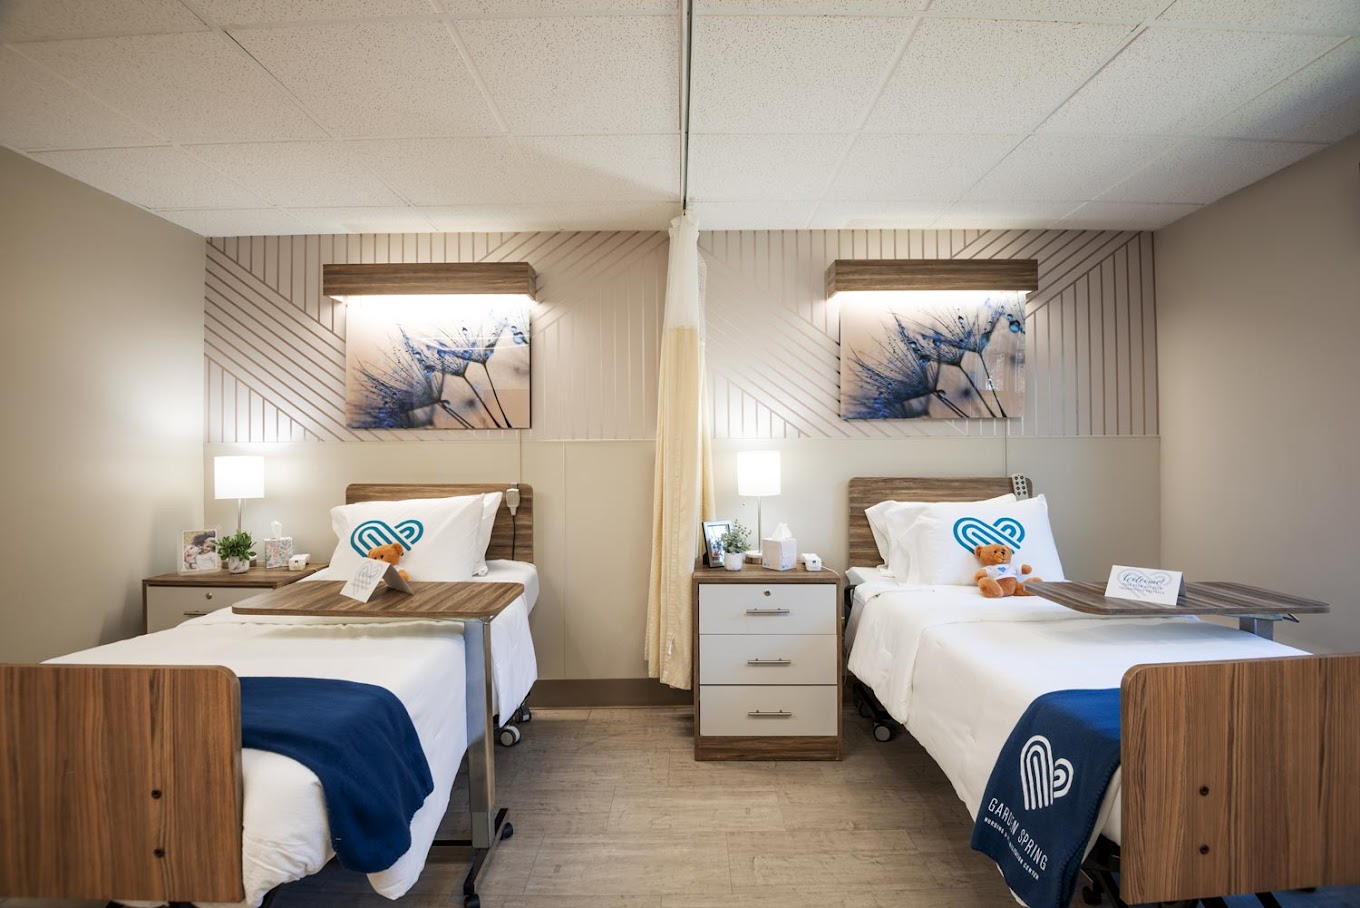
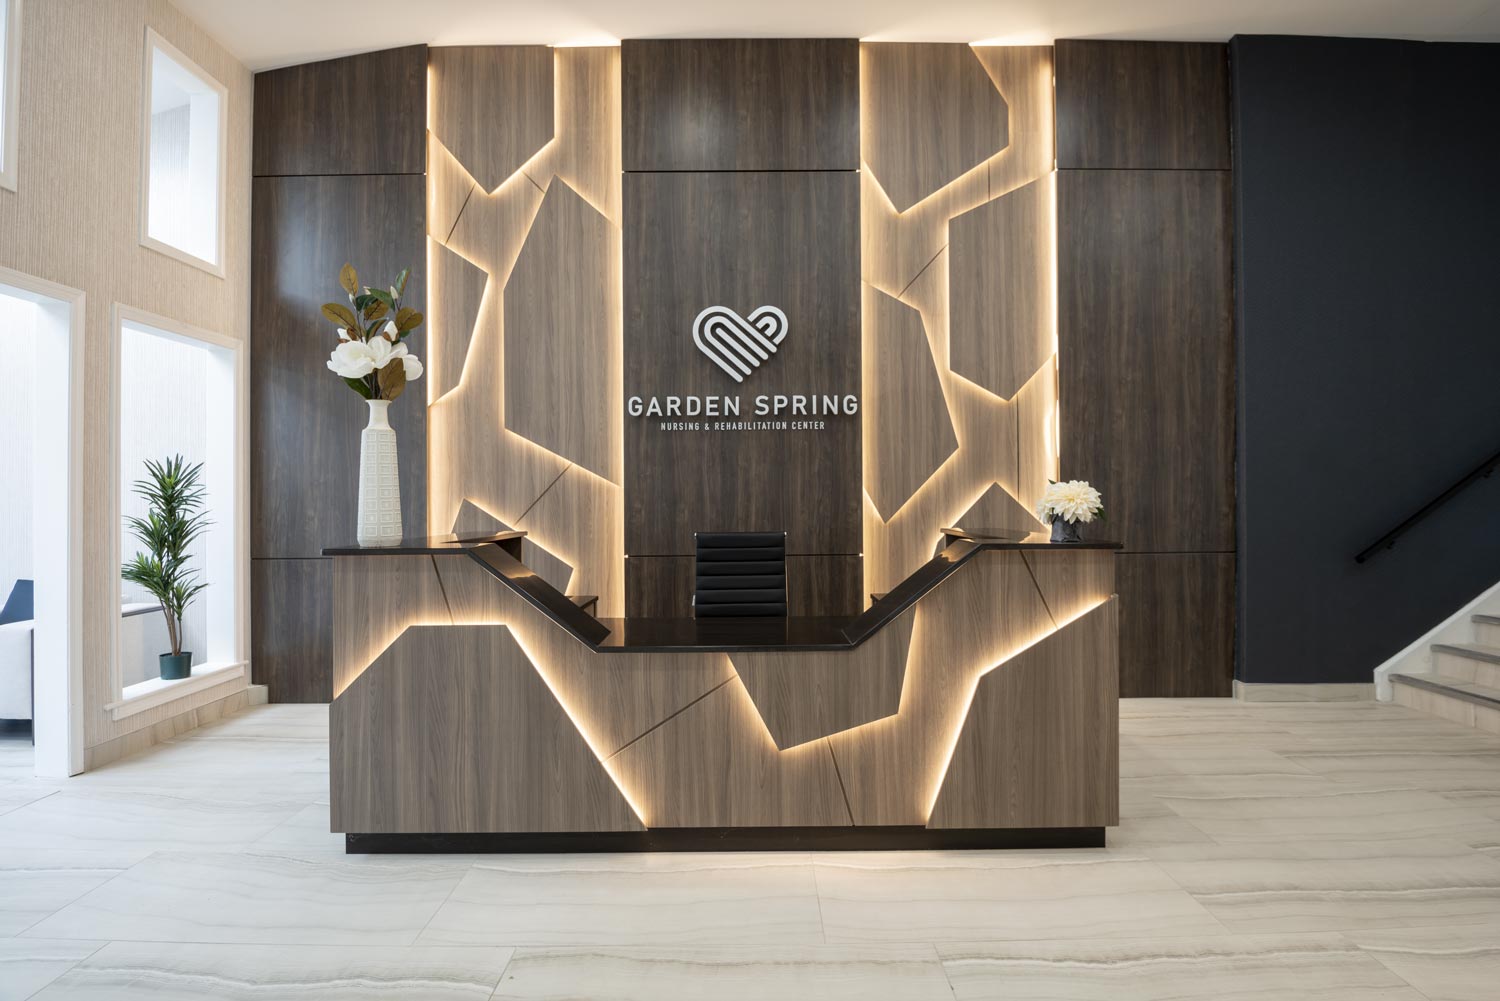
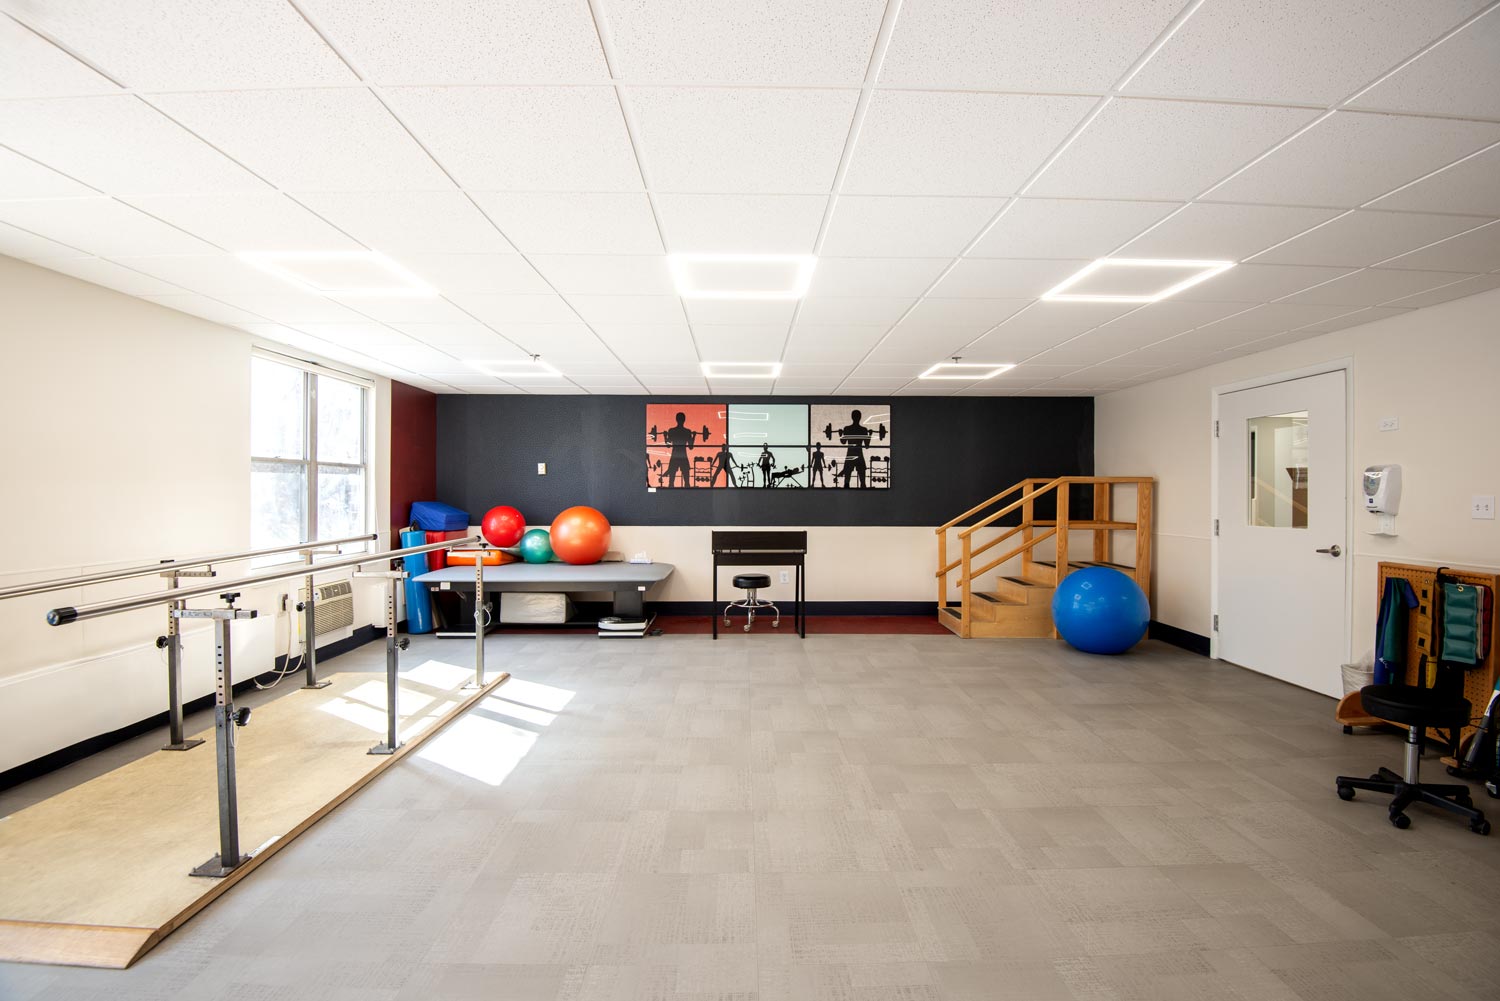
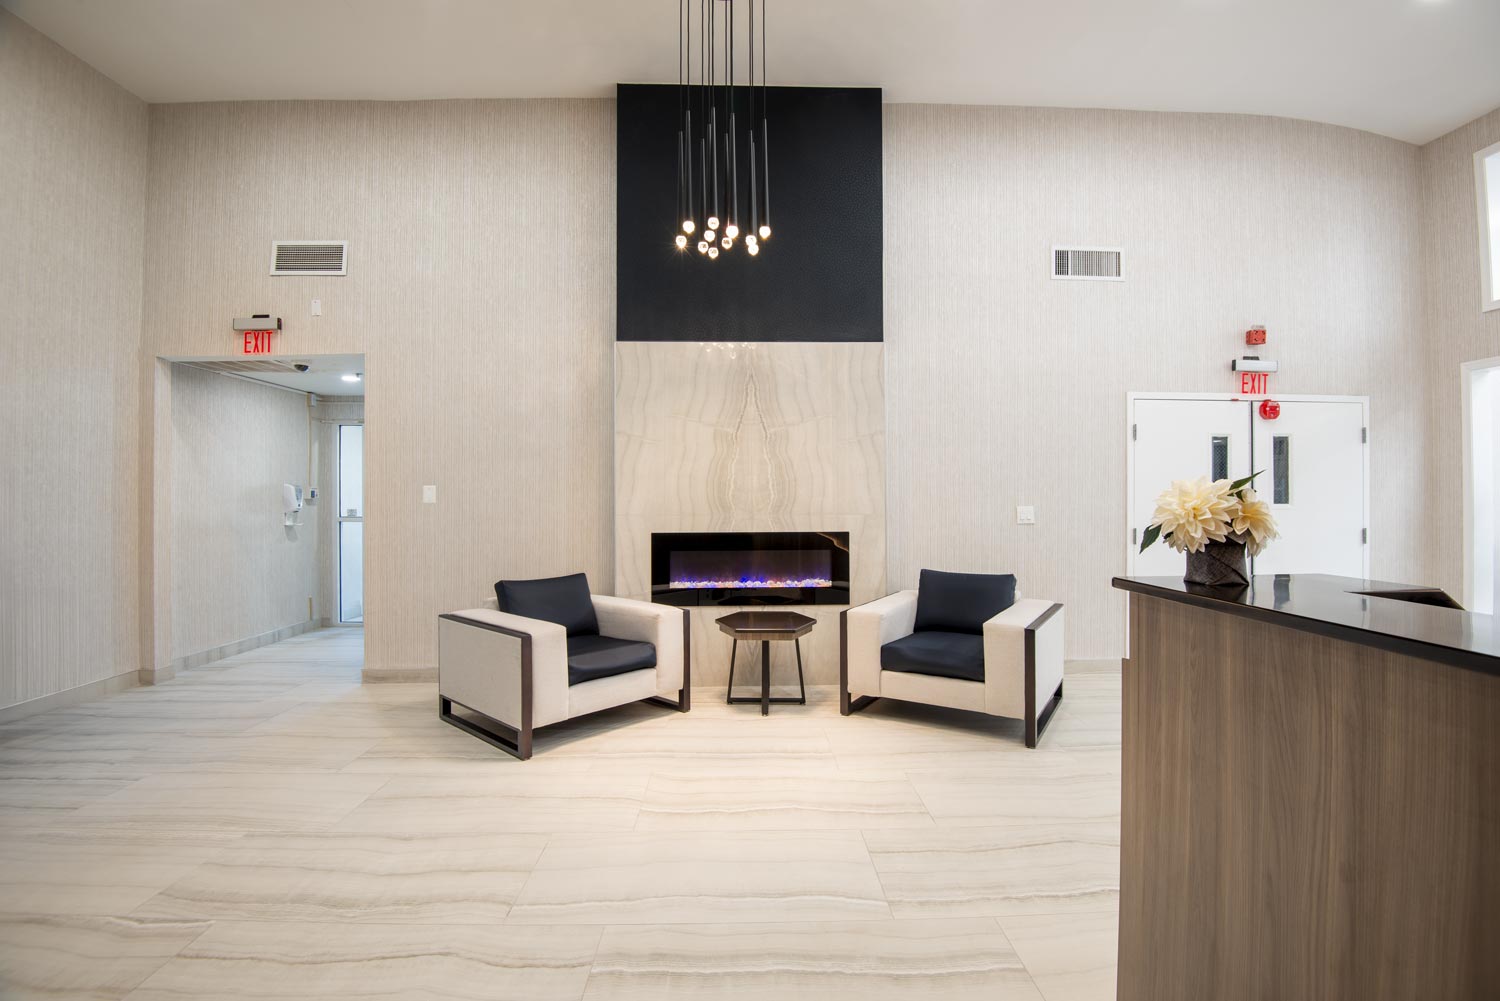
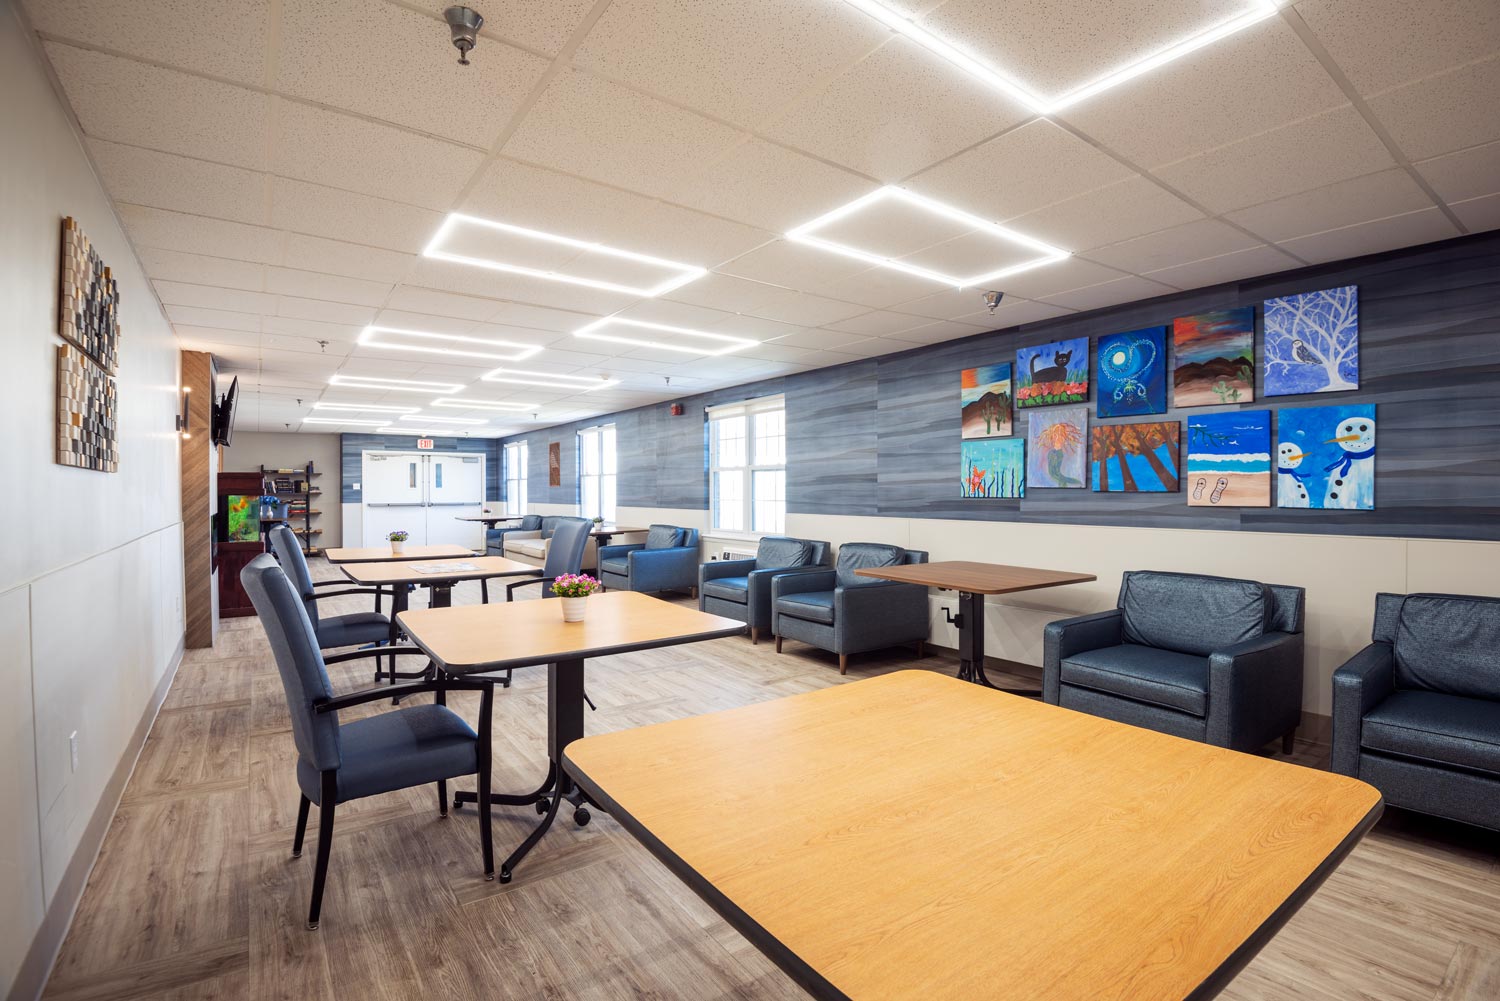
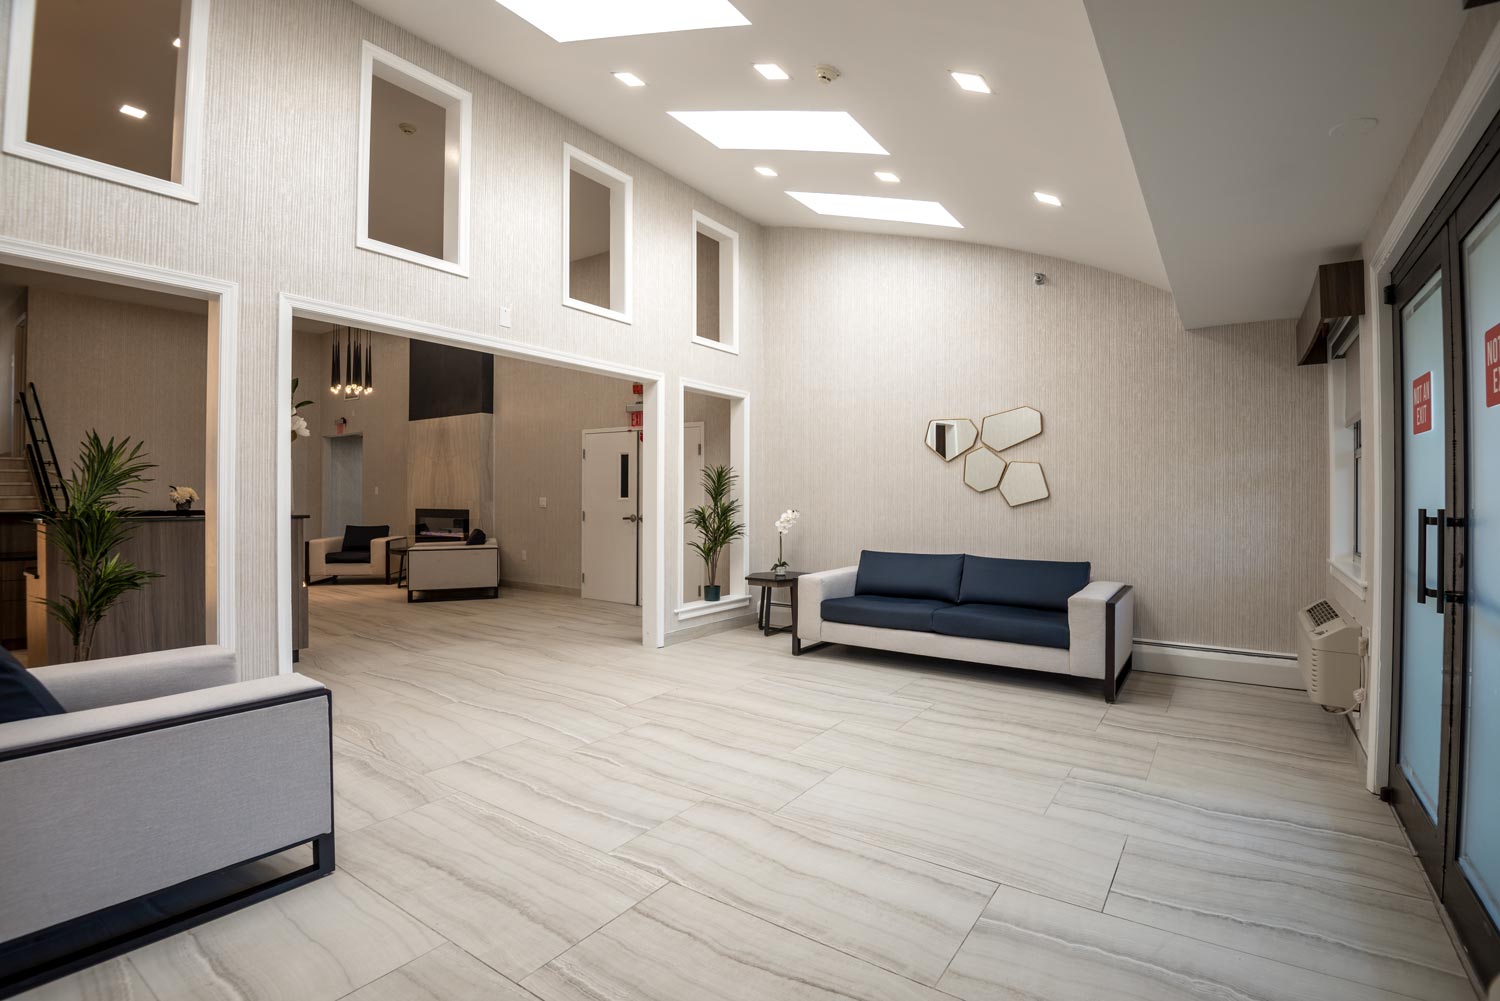
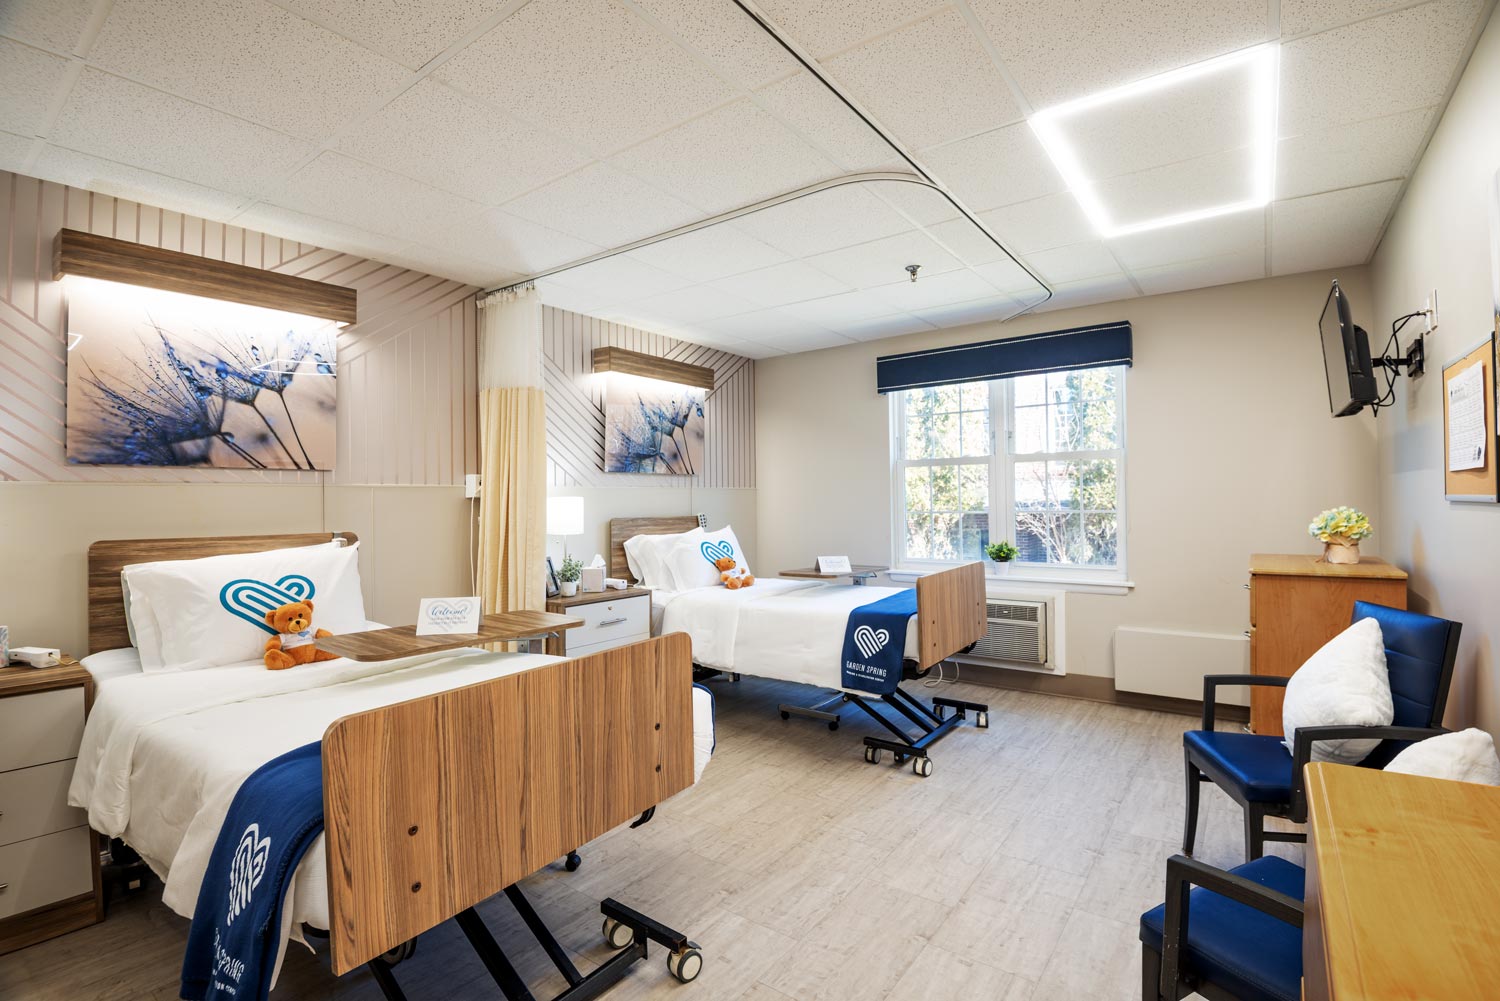
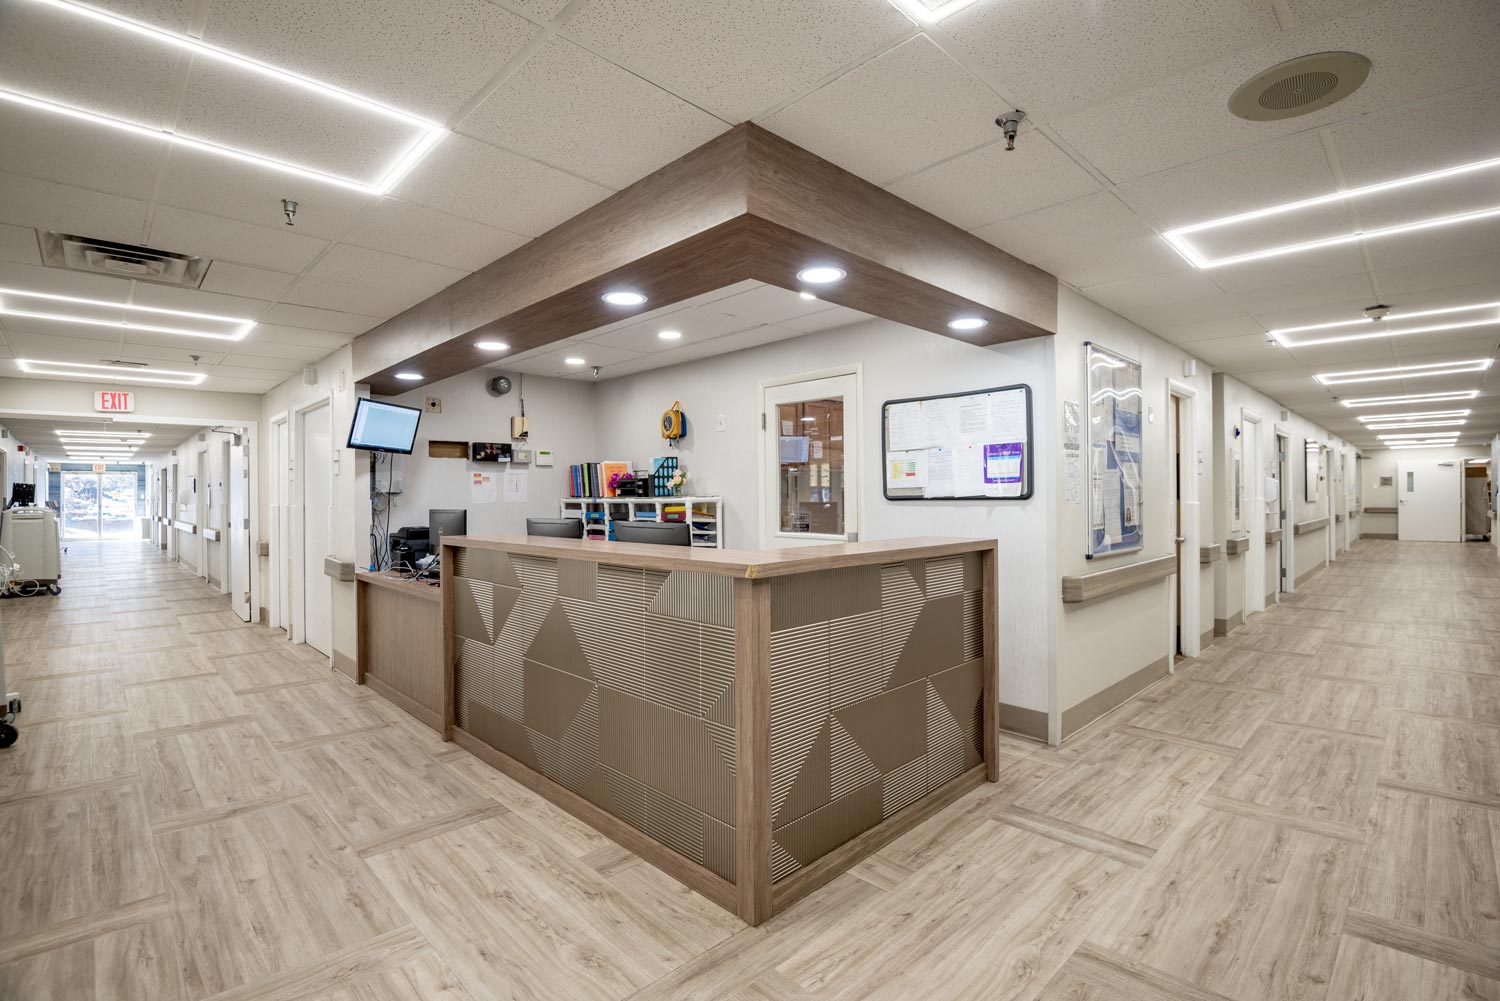
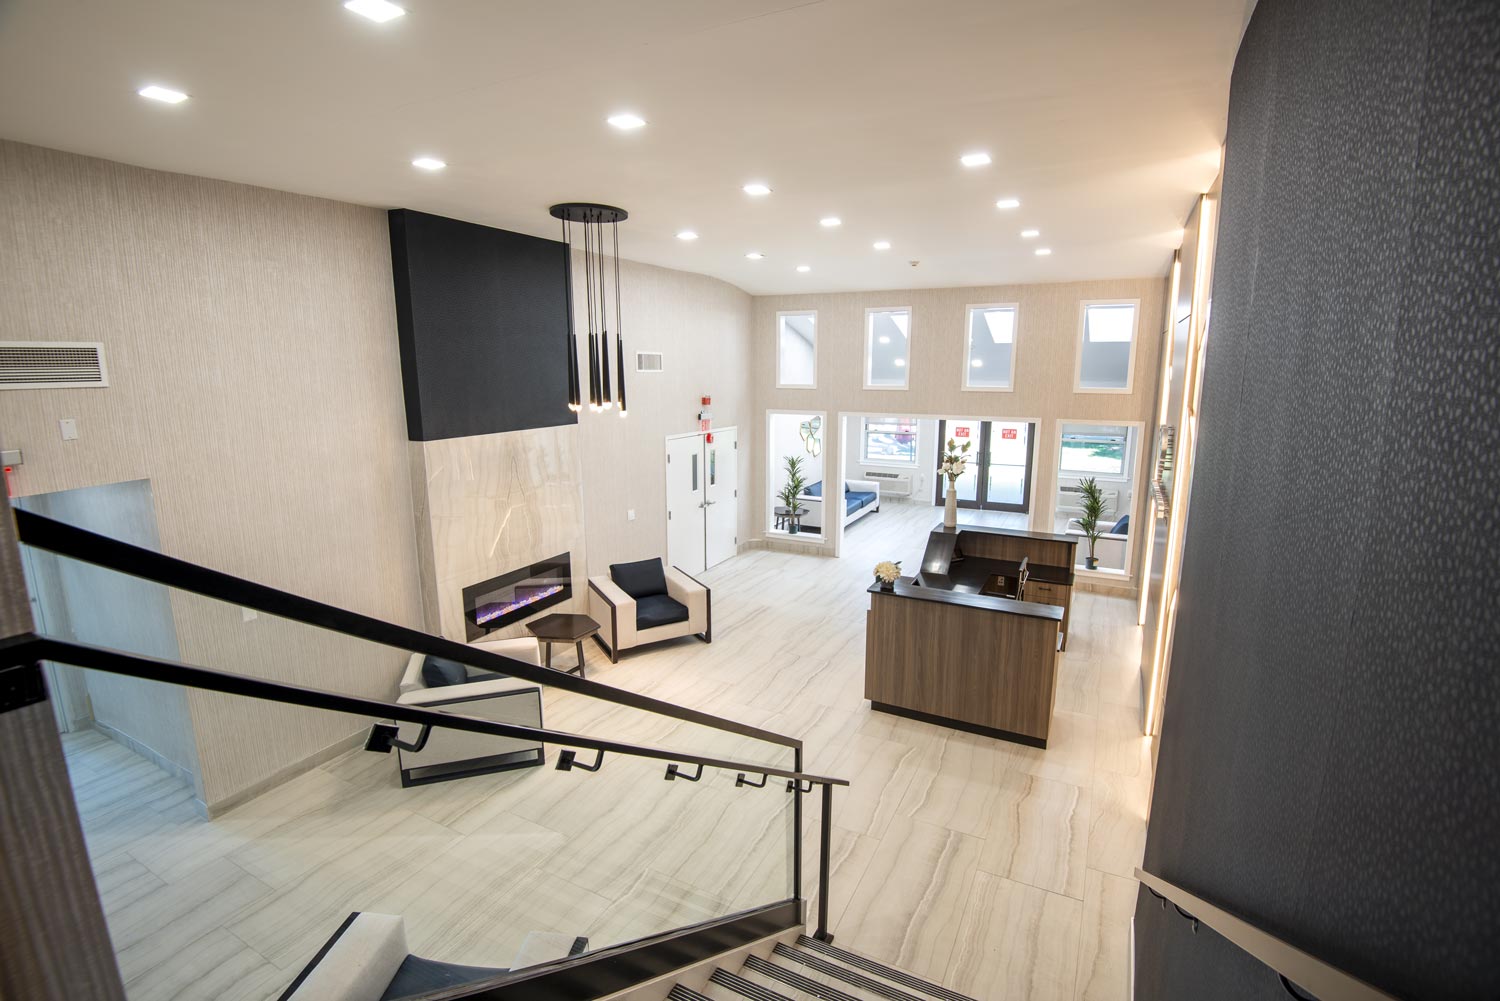
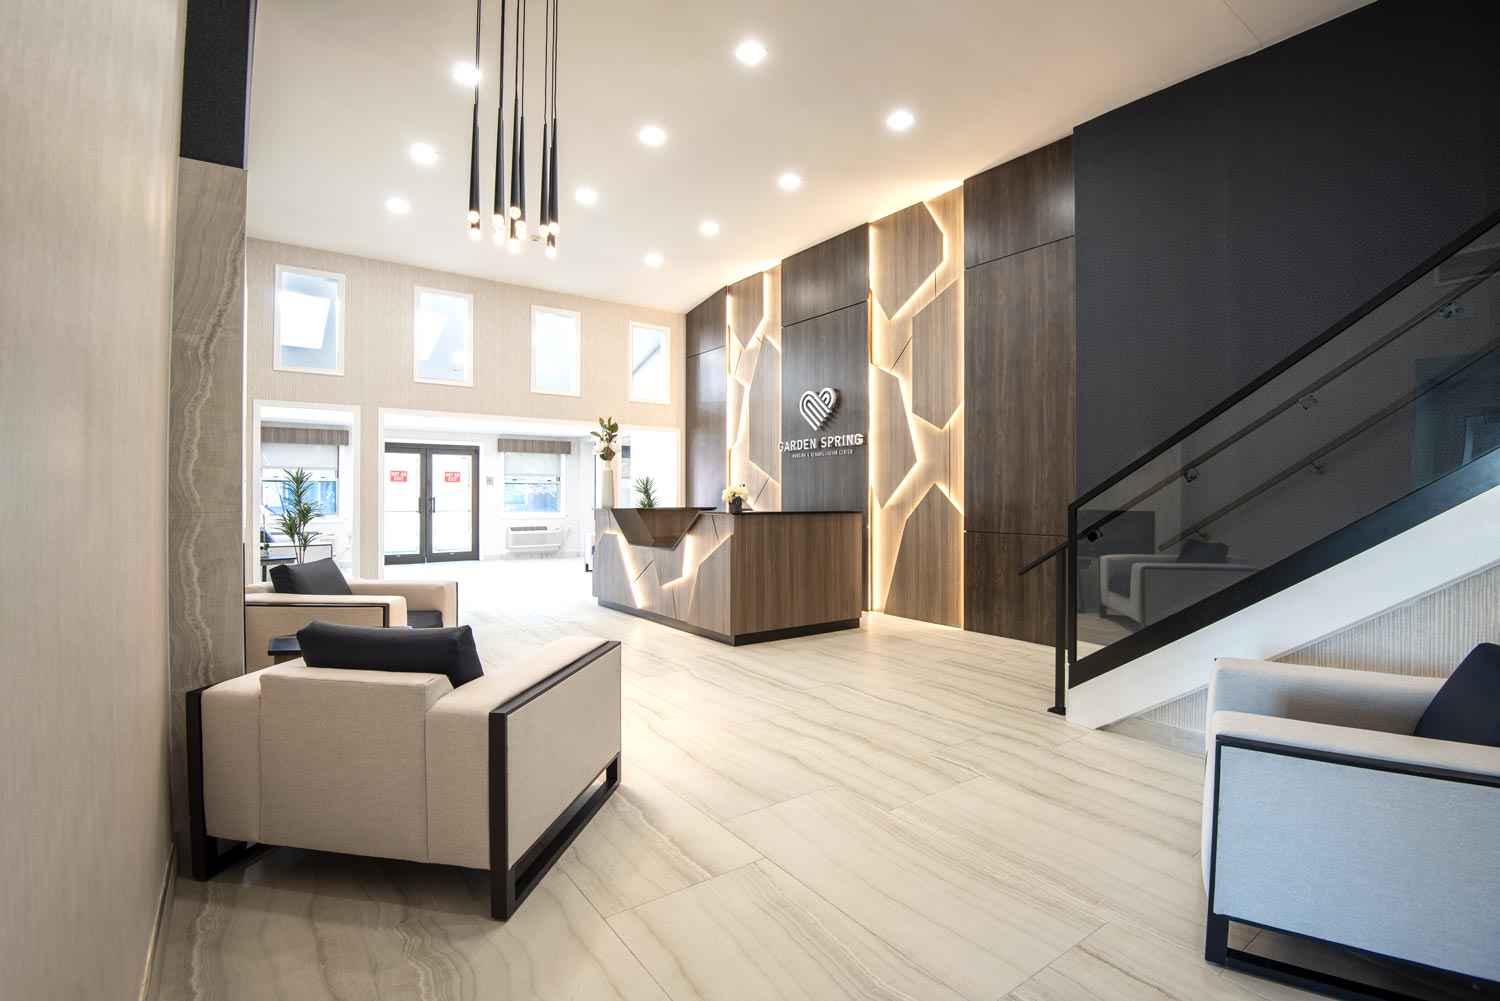
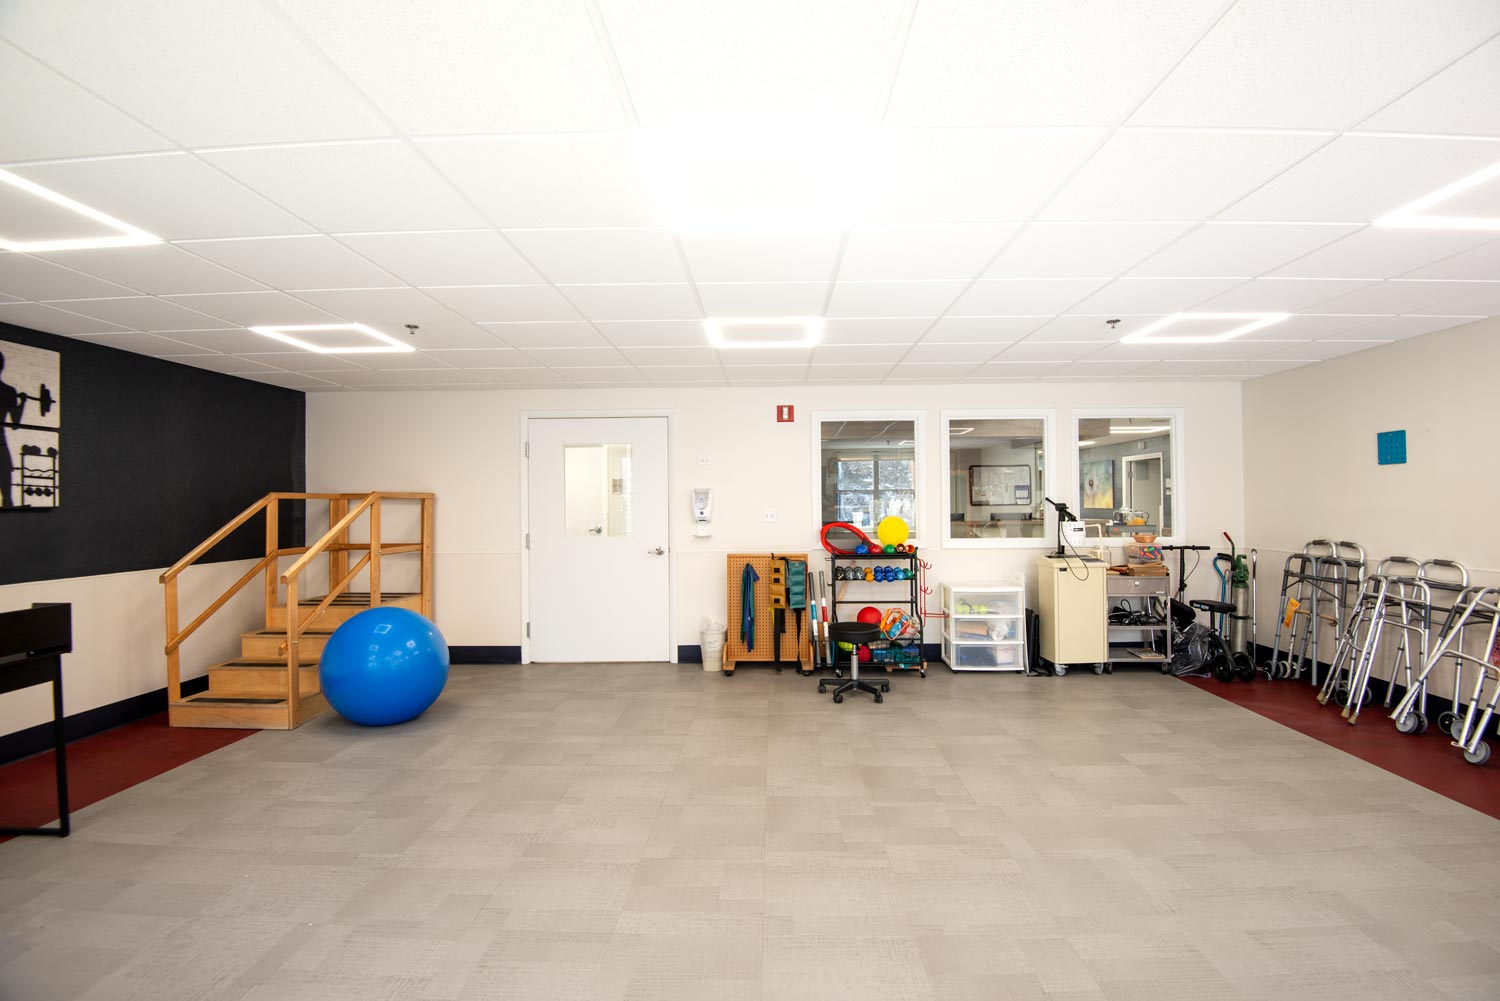
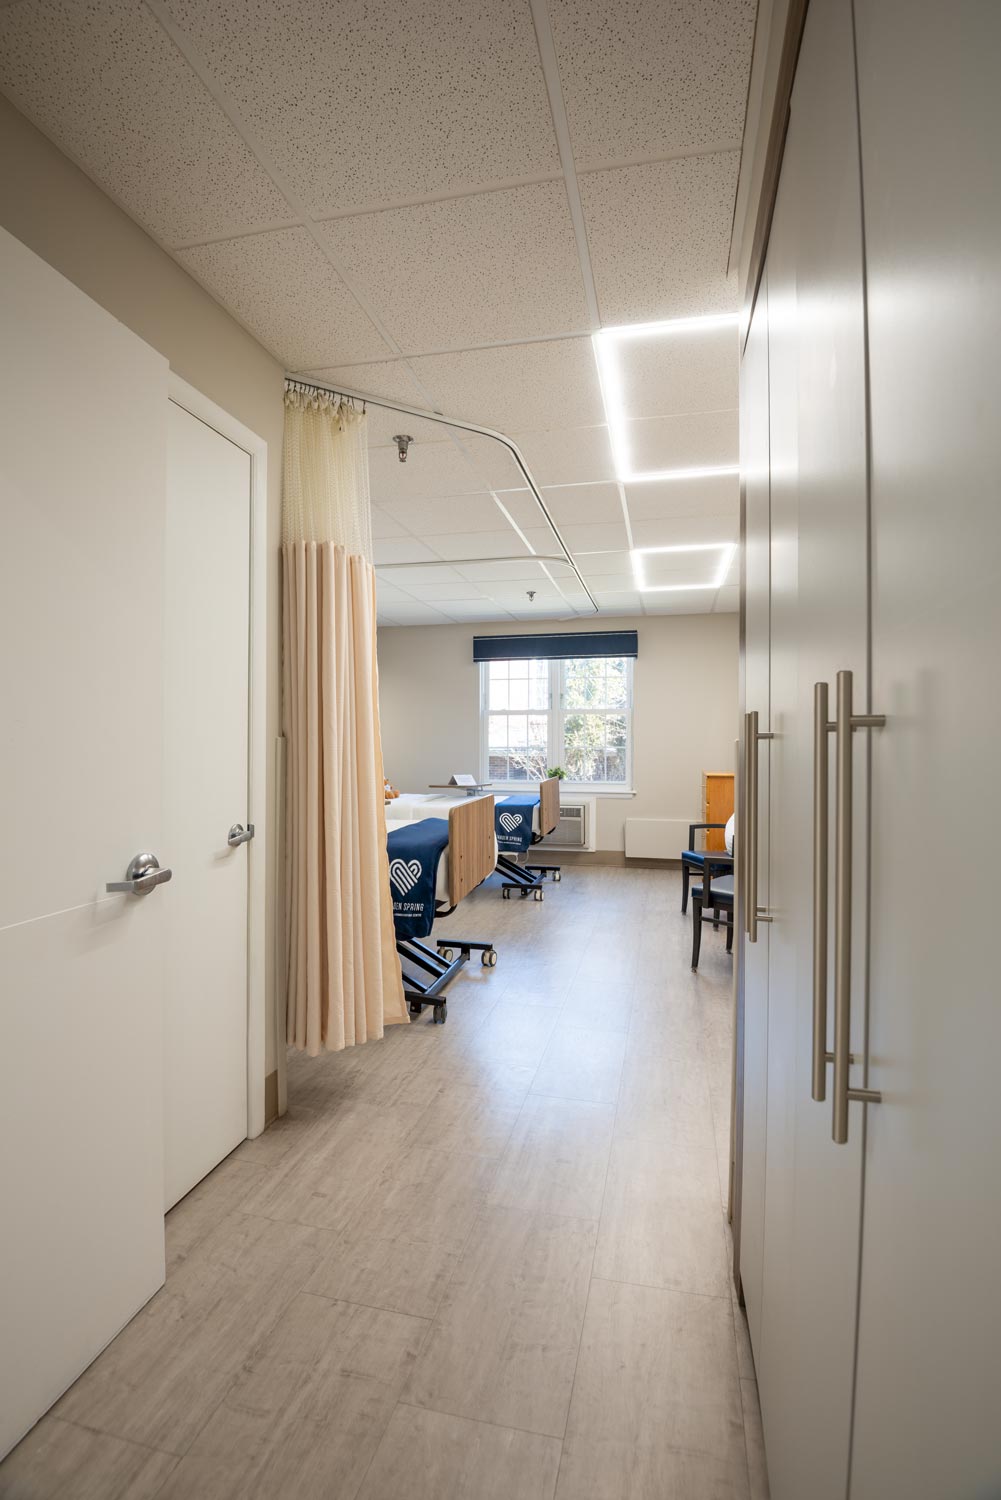
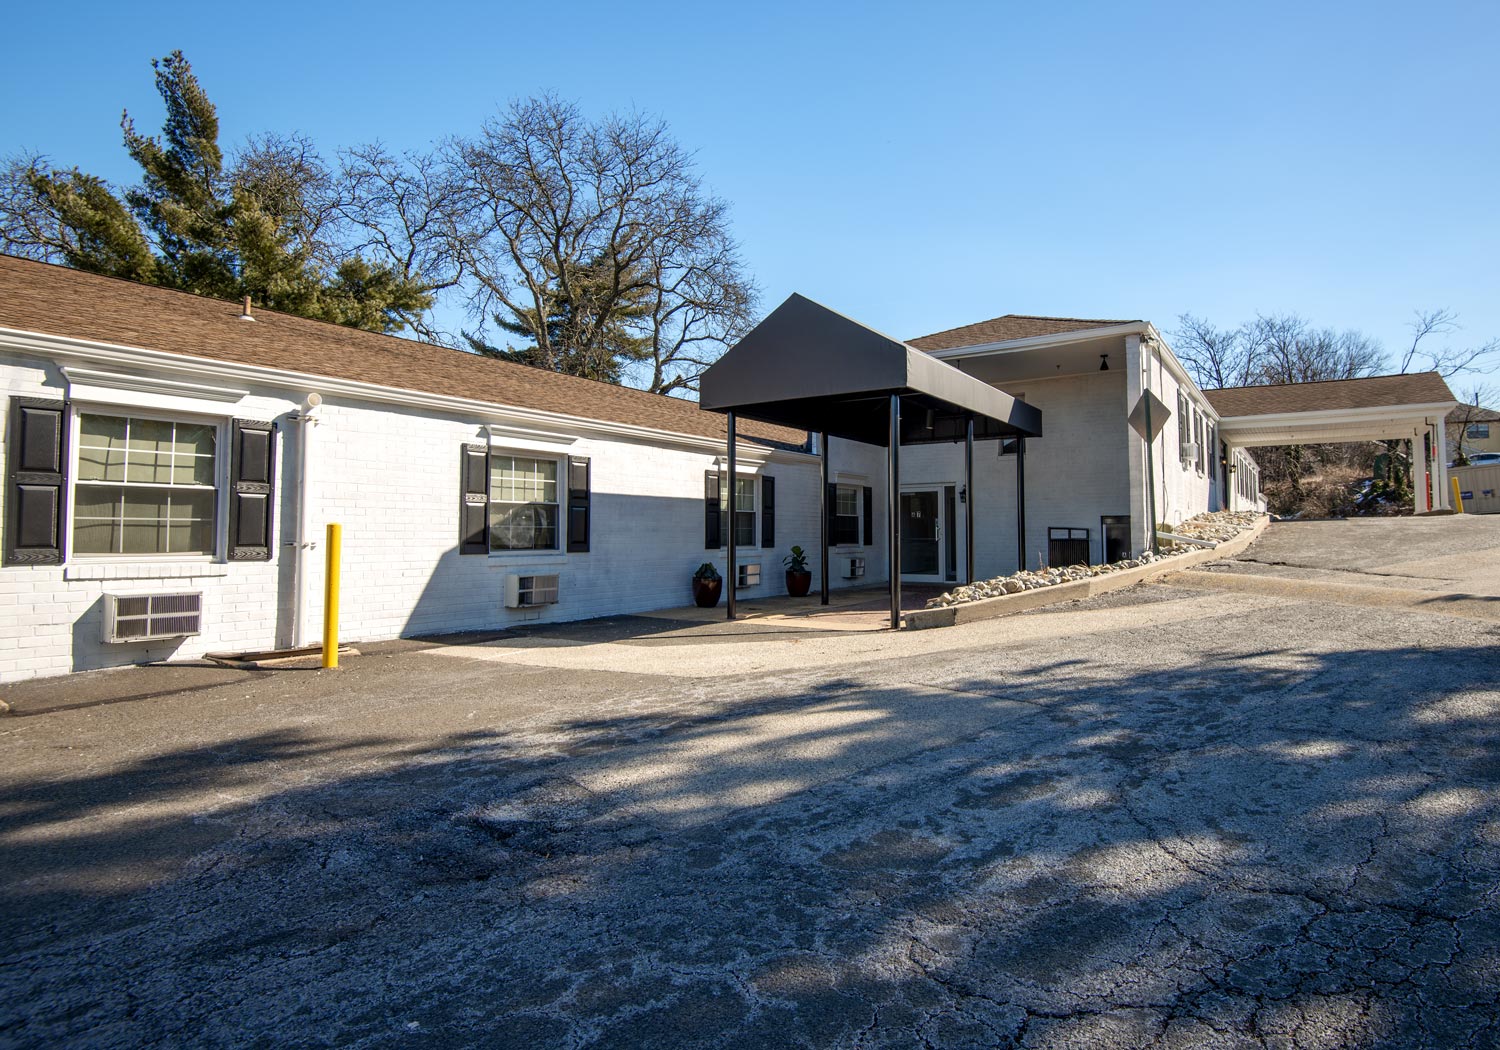
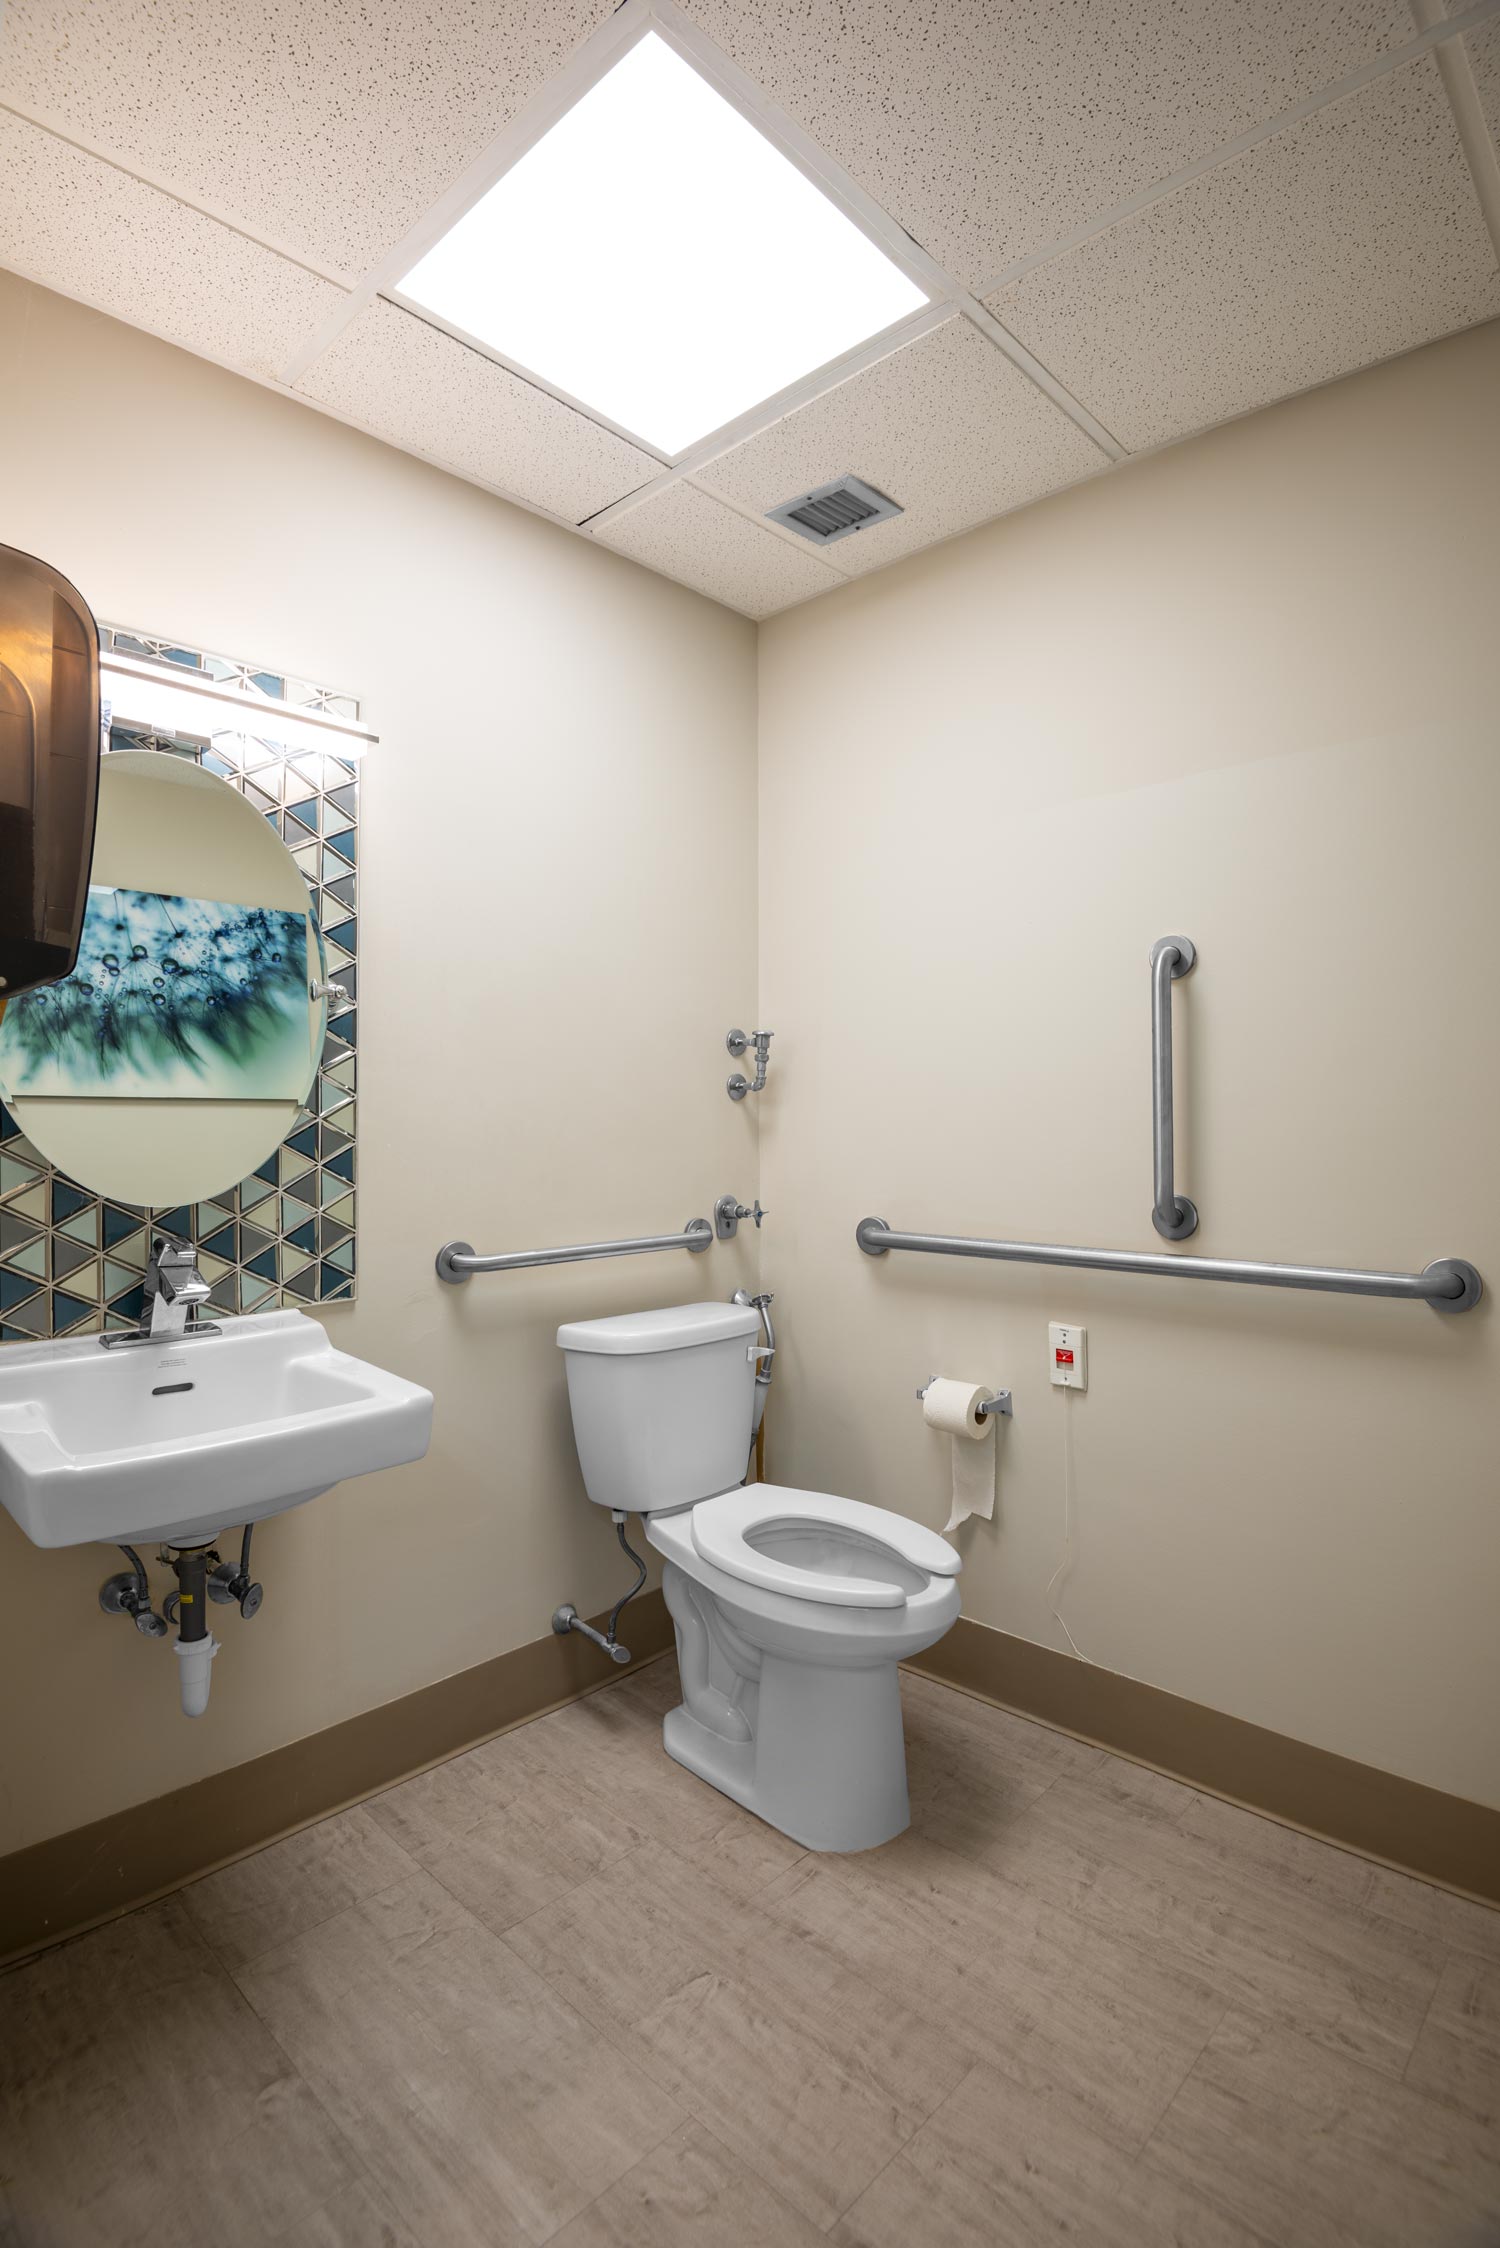
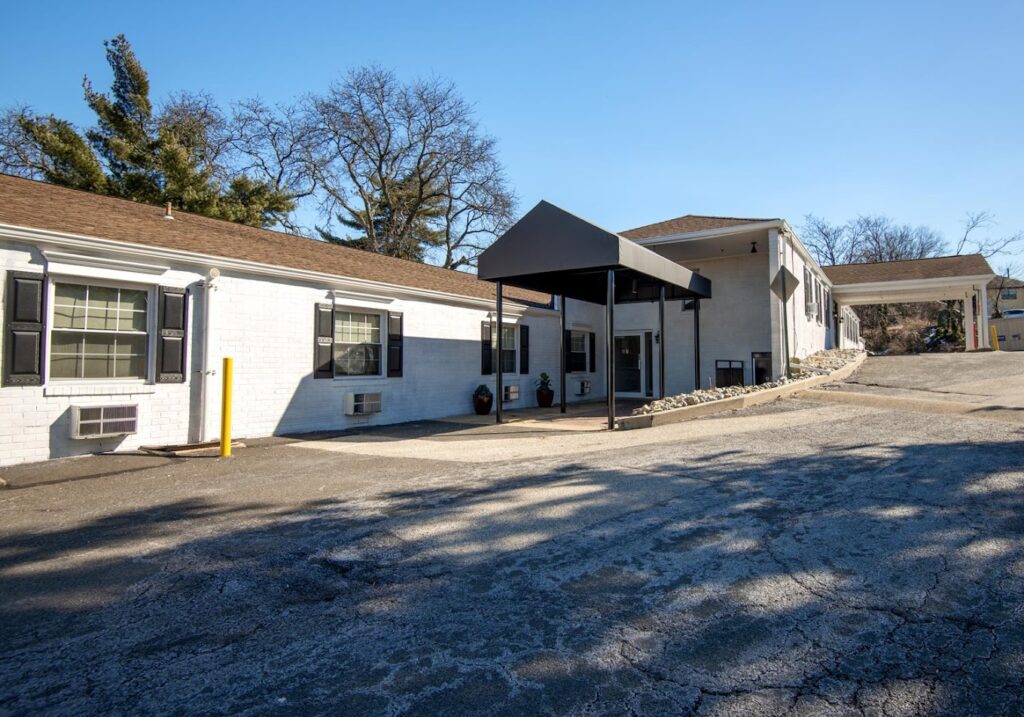
Overlooking the charming neighborhood of Willow Grove, PA, Garden Spring Nursing and Rehabilitation Center is a welcoming senior living community, offering skilled nursing and rehabilitation services. The community guarantees each resident with excellent support and care services tailored to their individual needs and care goals, ensuring a fast and comfortable recovery process. Residents here are offered comfortable accommodations and an excellent care team consisting of doctors, nurses, therapists, and social workers who work hand-in-hand to deliver exceptional care.

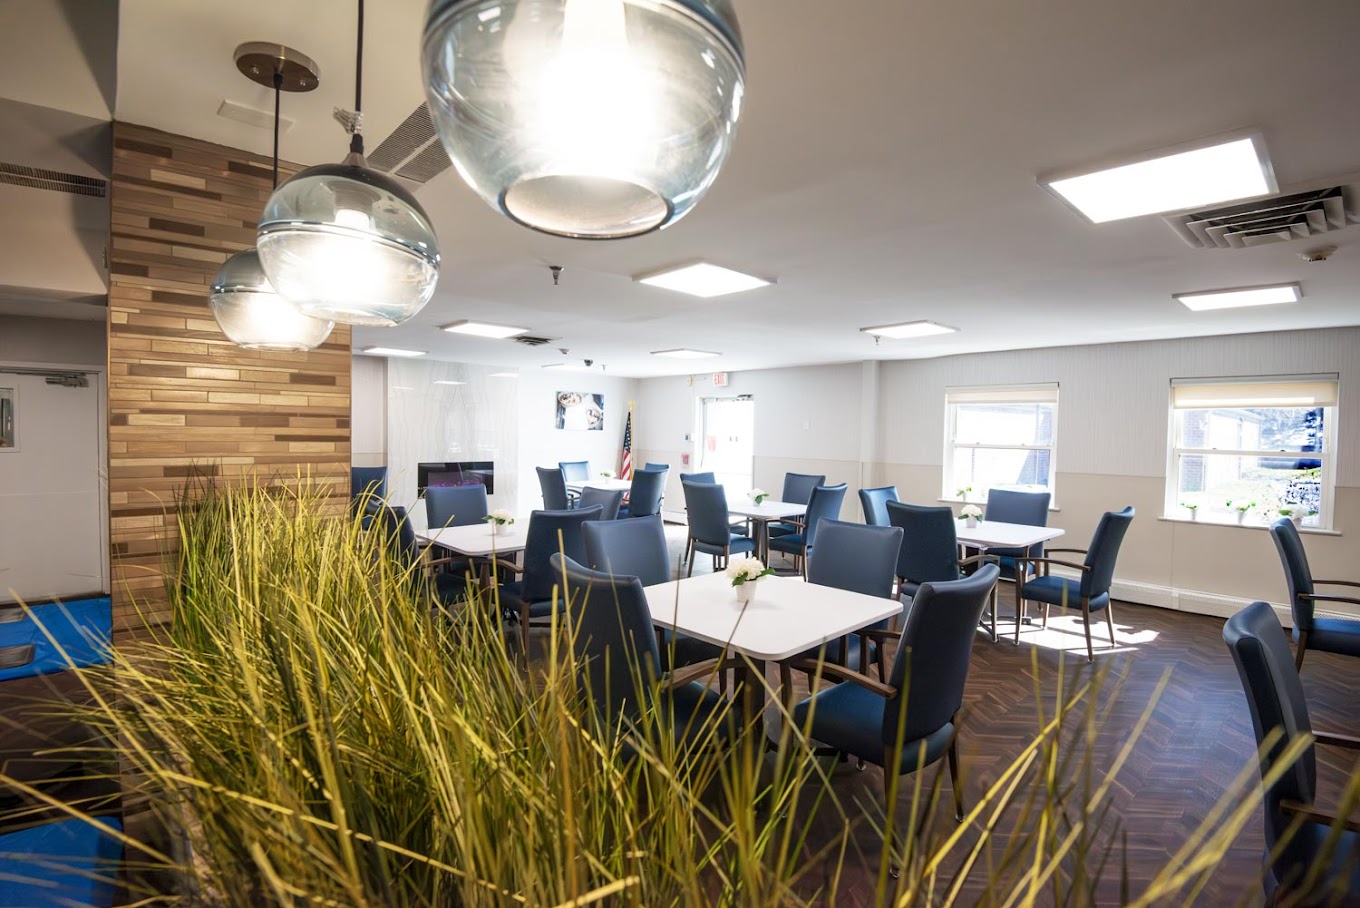
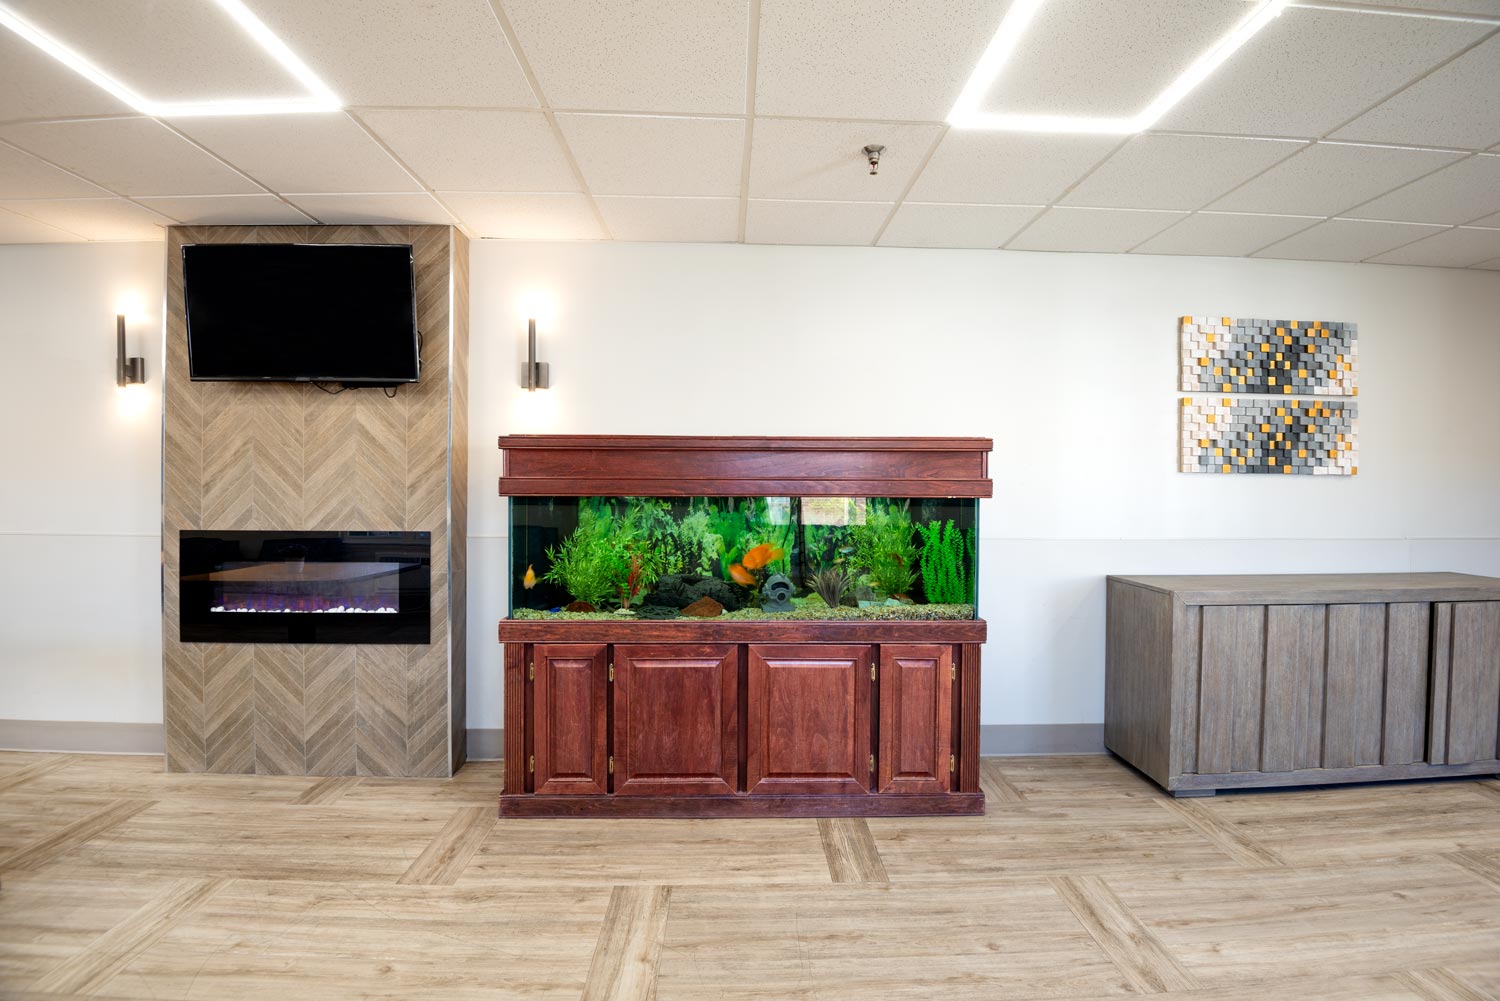
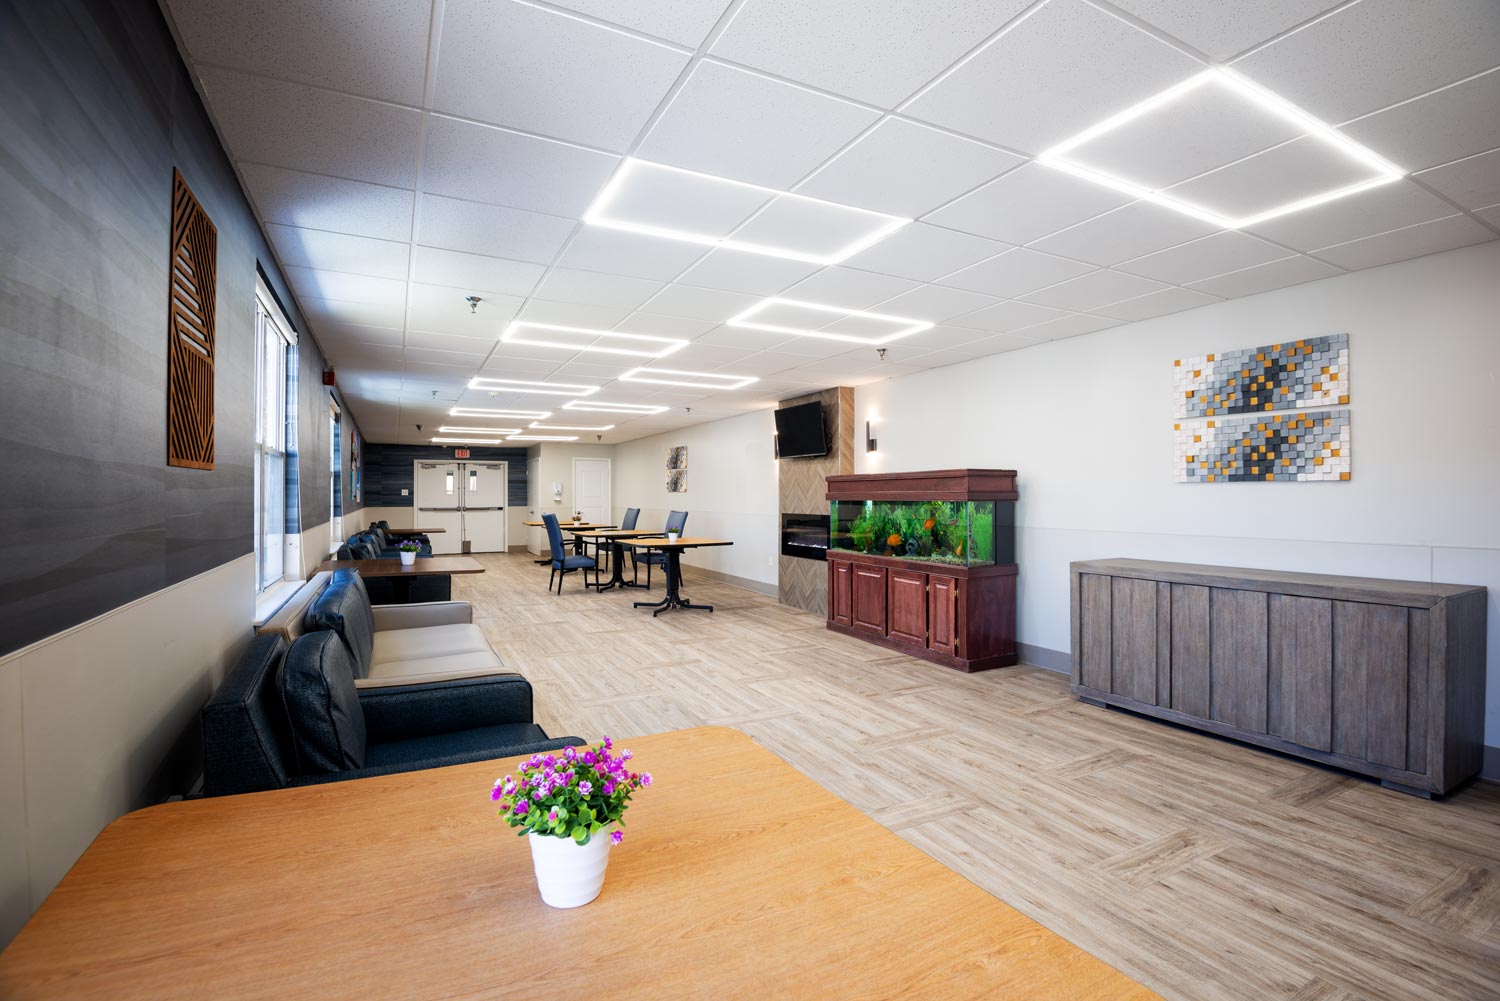
In addition to continuous care, the community offers a diverse range of activities to stimulate, engage, and entertain residents, including regular performances, bingo, and more. Nestled within abundant greenery, the community provides a safe and relaxing healing space that allows them to stay active or relax. With round the clock support, excellent support systems, and dynamic programs, residents here are bound to enjoy a dynamic and comfortable life.

Quality ratings

Measured by Centers for Medicare & Medicaid Services (CMS)

Overall rating Info The Overall CMS Rating combines results from health inspections, staffing levels and quality measures. Health inspections carry the most weight. Staffing and quality scores can increase or decrease the final rating based on performance compared to state and national standards.
3/5
Pennsylvania average: 3.0/5
Health Inspection Info Based on the results of the facility's three most recent standard inspections and any complaint investigations. CMS reviews the number, scope, and severity of deficiencies, with more recent findings weighted more heavily.
3/5
Pennsylvania average: 2.8/5
Staffing Info Measures average nursing staff hours per resident per day, including Registered Nurses (RNs) and total nursing staff. Ratings are adjusted based on the level of care residents require and are compared to state and national benchmarks.
2/5
Pennsylvania average: 3.4/5
Quality Measures Info Based on clinical and physical health indicators reported to CMS, such as hospital readmissions, falls, pressure ulcers, and improvements in mobility. These measures reflect how well residents' health needs are being managed.
4/5
Pennsylvania average: 3.4/5

Nursing care per resident

Info This shows how many total hours of nursing staff time are available per resident each day. Higher numbers usually mean more staff support.
3h 35m per day

This home provides 13% less nursing time per resident than the Pennsylvania average.

Pennsylvania average: 4h 9m per day

Staffing hours breakdown

Info Hours of care per resident per day, broken down by staff type. Data from CMS Medicare.
Staff type Facility State avg National avg
Registered Nurse (RN) Info Registered nurse hours per resident per day. 27m per day 47m per day 41m per day
Nurse Aide Info Nurse aide hours per resident per day. 1h 53m per day 2h 12m per day 2h 21m per day
Total Nursing (Weekend) Info Total number of nurse staff hours per resident per day on weekends. 3h 16m per day 3h 31m per day 3h 26m per day
Physical Therapist Info Physical therapist staff hours per resident per day. 2m per day 6m per day 4m per day
RN (Weekend) Info Registered nurse hours per resident per day on weekends. 16m per day 33m per day 29m per day

Capacity and availability

Medium-capacity home

Offers a balance of services and community atmosphere.

Total beds 173

This home usually has availability

Lower occupancy suggests more openings may be available.

Lower demand than the Pennsylvania average
Occupancy rate 71.2%
Residents per day (avg) 138
Occupancy rate
71.2%
Residents per day (avg)
138

Who this home usually serves

TYPE OF STAY

Mostly long-term care residents

Most residents stay for extended periods and receive ongoing daily care.

Might be optimal for
Long-term daily care Ongoing support needs

Breakdown by payment type

Medicare

19% of new residents, usually for short-term rehab.

Typical stay 1 months

Private pay

37% of new residents, often for short stays.

Typical stay 1 - 2 months

Medicaid

44% of new residents, often for long-term daily care.

Typical stay 8 - 9 months

Finances and operations

Privately-owned community
Operated by a partnership between two or more business owners.
Home revenue
$14.7M
Operating loss
-$2.4M
Privately-owned community Operated by a partnership between two or more business owners.
Home revenue
$14,737,911.00
Operating loss
$-2,401,195.00
Payroll costs Info The portion of the home's budget spent on staff, including nurses, caregivers, and other employees who support care and operations.
$6.2M
41.8% of revenue
Other operating costs Info All remaining costs needed to run the home, such as food, utilities, building maintenance, supplies and administrative expenses.
$11.0M
Total costs $17.1M
Walk Score
Walk Score: 54 / 100
Moderately walkable. Some errands can be accomplished on foot, with a mix of nearby amenities.

About this community

Care Services

Nursing Services
Rehabilitation Services
Respite Care
Skilled Nursing
Licensed Nurses/CNAs
24-Hour Staffing

Dining & Nutrition

Food Description
At Garden Spring Nursing and Rehabilitation Center, delicious, nutritionally balanced meals are prepared by a professional culinary team, catering to various dietary needs and preferences.
Meals Included
Yes

What does this home offer?

Accepts Medicaid icon

Accept Medicaid: Yes

Total residents icon

Total Residents: 173

Building type icon
Building type icon

Building Type: Two-story

Types of Care at Garden Spring Nursing and Rehabilitation Center

Nursing Home
Contact Garden Spring Nursing and Rehabilitation Center

Health Inspection History

Inspections
Total health inspections 11

Pennsylvania average 6.7


Last Health inspection on Nov 2025

Total health citations 45

Pennsylvania average 31.3

Citations per inspection
4.09

Pennsylvania average 4.4


Health citations are formal notices following inspections when they fail to comply with safety and care standards.

29 of 45 citations resulted from standard inspections; 15 of 45 resulted from complaint investigations; and 1 of 45 came from combined inspections (standard and complaint).

Breakdown of citation severity (last 3 years)
Critical Health citations More info 1
233% worse than Pennsylvania average

Pennsylvania average: 0.3


Serious Health citations More info 0
100% better than Pennsylvania average

Pennsylvania average: 0.6

1 critical citation More info Pennsylvania average: 0.3

0 serious citations More info Pennsylvania average: 0.6

40 moderate citations More info Pennsylvania average: 29.5

4 minor citations More info Pennsylvania average: 0.8
Citations history (last 3 years)
Infection Control critical citation Info Issues related to preventing and controlling infections, including hygiene practices and safety protocols. Nov 05, 2025

Environmental moderate citation Info Issues related to building safety, cleanliness, maintenance, and overall living conditions. Jul 11, 2025
Corrected

Infection Control moderate citation Info Issues related to preventing and controlling infections, including hygiene practices and safety protocols. Jul 11, 2025
Corrected

Quality of Care moderate citation Info Issues related to how well residents receive appropriate treatment and support for their medical and daily care needs. Jul 11, 2025
Corrected

Compare Nursing Homes around Abington The information below is reported by the Pennsylvania Department of Human Services and Department of Health.

1 facility compared · CMS & PA Dept. of Health data · Updated Mar 2026

Garden Spring Nursing and Rehabilitation Center
AL

Assisted Living A licensed, long-term care setting for seniors or individuals with disabilities who need help with daily activities — like bathing, dressing, and medication management — but not 24-hour skilled nursing. Offers housing, meals, and around-the-clock support while aiming to maximize resident independence.

IL

Independent Living Lifestyle-focused communities for older adults offering dining, activities, and transportation with minimal personal care. Best for active, independent seniors who want community without medical support.

MC

Memory Care Secured, specialized care for people living with Alzheimer's or dementia. Staff trained in cognitive impairment, with higher staff-to-resident ratios and an environment designed to reduce confusion and wandering risk.

NH

Nursing Home Licensed facility providing 24/7 skilled nursing care for residents with complex, ongoing medical needs. Staffed by RNs, LPNs, and CNAs. Inspected and star-rated annually by CMS. Accepts Medicare (short-term rehab) and Medicaid (long-term care).

Willow Grove
173
71.2%
-10%
3.59
-87%
-13%
1
45
1
138
54
Bh Opco Holdco Llc
$14,6M
$6,2M
42%
395077

Places of interest near Garden Spring Nursing and Rehabilitation Center

Address 1.0 miles from city center

Address 1113 Easton Rd, Willow Grove, PA 19090

Calculate Travel Distance to Garden Spring Nursing and Rehabilitation Center

Add your location

Address

Staffing Data (Q2 2025)

This data corresponds to Q2 2025 and is based on CMS Payroll-Based Journal.

Total staff 266
Employees 141
Contractors 125
Staff to resident ratio 2.13:1
10% better than Pennsylvania average

Pennsylvania average ratio: 1.94:1

Avg staff/day 72
Average shift 7.5 hours
0% compared with Pennsylvania average

Pennsylvania average: 7.8 hours

Total staff hours (quarter) 49,108
Nursing staff breakdown
Registered Nurse

Manages medical care and health needs.

Total count 4
Average shift length Info Average shift length. Calculated as total hours divided by days worked and average staff per day. 9.5 hours

No contractors work on this role.

Licensed Practical Nurse

Assists with medical care and medications.

Total count 73
Average shift length Info Average shift length. Calculated as total hours divided by days worked and average staff per day. 8 hours

This role is partially covered by contractors.

Certified Nursing Assistant

Helps with daily care and mobility.

Total count 136
Average shift length Info Average shift length. Calculated as total hours divided by days worked and average staff per day. 7.5 hours

This role is partially covered by contractors.

Contractor staffing

Total hours from contractors

10.3%

5,076 contractor hours this quarter

Certified Nursing Assistant: 78 Licensed Practical Nurse: 35 Occupational Therapy Assistant: 4 Qualified Activities Professional: 3 Feeding Assistant: 3 Occupational Therapy Aide: 1 Medical Director: 1
Staff by category
Certified Nursing Assistant587813621,47291100%7.5
Licensed Practical Nurse38357313,63591100%8
Clinical Nurse Specialist160163,22791100%7.7
Other Dietary Services Staff7072,70691100%7.2
Registered Nurse4041,6398593%9.5
RN Director of Nursing3038398492%6.4
Speech Language Pathologist2026457684%6.8
Respiratory Therapy Technician3035946976%6.5
Physical Therapy Assistant3035616774%6
Respiratory Therapist2025387178%7
Administrator1015206571%8
Feeding Assistant0335076571%4.3
Mental Health Service Worker1015046369%8
Nurse Practitioner1014966268%8
Qualified Social Worker2024686673%7.1
Occupational Therapy Aide0114205358%7.9
Qualified Activities Professional0332192730%7.8
Medical Director011781314%6
Occupational Therapy Assistant044422527%1.7
136 Certified Nursing Assistant
% of Days 100%
73 Licensed Practical Nurse
% of Days 100%
16 Clinical Nurse Specialist
% of Days 100%
7 Other Dietary Services Staff
% of Days 100%
4 Registered Nurse
% of Days 93%
3 RN Director of Nursing
% of Days 92%
2 Speech Language Pathologist
% of Days 84%
3 Respiratory Therapy Technician
% of Days 76%
3 Physical Therapy Assistant
% of Days 74%
2 Respiratory Therapist
% of Days 78%
1 Administrator
% of Days 71%
3 Feeding Assistant
% of Days 71%
1 Mental Health Service Worker
% of Days 69%
1 Nurse Practitioner
% of Days 68%
2 Qualified Social Worker
% of Days 73%
1 Occupational Therapy Aide
% of Days 58%
3 Qualified Activities Professional
% of Days 30%
1 Medical Director
% of Days 14%
4 Occupational Therapy Assistant
% of Days 27%

Facility Characteristics

Source: CMS Long-Term Care Facility Characteristics (Data as of Jan 2026)

Total census
125 residents
Residents by payment source
Medicare
2 residents (1.6%)
Medicaid
113 residents (90.4%)
Private pay or other
10 residents (8%)
Programs & Services
Residents' Group

Residents meet regularly to discuss policies, care quality, and activities

Active Resident Council

Organized group of residents that meets regularly to discuss facility policies, quality of life, and activities.

Quality of care over time

These measures show how residents usually do over time at this home, based on health outcomes and preventive care.

High-risk clinical events score Info A composite score based on pressure ulcers, falls with injury, weight loss, walking ability decline, and activities of daily living decline. 12.4
12% worse than Pennsylvania average

Pennsylvania average: 11.0

Functional decline score Info A composite score based on activities of daily living decline, walking ability decline, and incontinence. 21.1
5% better than Pennsylvania average

Pennsylvania average: 22.2

Long-stay resident measures
Below average Pennsylvania avg: 3.9 Info CMS star rating based on long-stay quality measure performance. 5 stars = significantly above average, 1 star = significantly below average.
Need for Help with Daily Activities Increased Info Percent of long-stay residents whose need for help with daily activities has increased 14.5%
24% better than Pennsylvania average

Pennsylvania average: 19.0%

Walking Ability Worsened Info Percent of long-stay residents whose ability to move independently worsened 23.2%
10% worse than Pennsylvania average

Pennsylvania average: 21.1%

Low Risk Residents with Bowel/Bladder Incontinence Info Percent of low risk long-stay residents who lose control of their bowels or bladder 25.6%
In line with Pennsylvania average

Pennsylvania average: 26.7%

Falls with Major Injury Info Percent of long-stay residents experiencing one or more falls with major injury 4.6%
46% worse than Pennsylvania average

Pennsylvania average: 3.2%

High Risk Residents with Pressure Ulcers Info Percent of long-stay high risk residents with pressure ulcers 9.3%
68% worse than Pennsylvania average

Pennsylvania average: 5.5%

Urinary Tract Infection Info Percent of long-stay residents with a urinary tract infection 1.3%
28% better than Pennsylvania average

Pennsylvania average: 1.8%

Lost Too Much Weight Info Percent of long-stay residents who lose too much weight 10.2%
54% worse than Pennsylvania average

Pennsylvania average: 6.6%

Depressive Symptoms Info Percent of long-stay residents who have depressive symptoms 4.3%
22% better than Pennsylvania average

Pennsylvania average: 5.5%

Antipsychotic Use Info Percent of long-stay residents who received an antipsychotic medication 14.8%
14% better than Pennsylvania average

Pennsylvania average: 17.1%

Pneumococcal Vaccine Info Percent of long-stay residents assessed and appropriately given the pneumococcal vaccine 58.9%
32% worse than Pennsylvania average

Pennsylvania average: 86.9%

Influenza Vaccine Info Percent of long-stay residents assessed and appropriately given the seasonal influenza vaccine 85.4%
9% worse than Pennsylvania average

Pennsylvania average: 93.5%

Hospitalizations per 1,000 days Info Number of hospitalizations per 1,000 long-stay resident days. 3.55
111% worse than Pennsylvania average

Pennsylvania average: 1.68

ED visits per 1,000 days Info Number of outpatient emergency department visits per 1,000 long-stay resident days. 1.04
13% better than Pennsylvania average

Pennsylvania average: 1.20

Short-stay resident measures
Average Pennsylvania avg: 2.8 Info CMS star rating based on short-stay quality measure performance. 5 stars = much above average, 1 star = much below average.
Pneumococcal Vaccine Info Percent of short-stay residents assessed and appropriately given the pneumococcal vaccine 13.7%
80% worse than Pennsylvania average

Pennsylvania average: 68.8%

Antipsychotic medication increase Info Percent of short-stay residents who newly received an antipsychotic medication 0.6%
61% better than Pennsylvania average

Pennsylvania average: 1.5%

Influenza Vaccine Info Percent of short-stay residents assessed and appropriately given the seasonal influenza vaccine 16.7%
76% worse than Pennsylvania average

Pennsylvania average: 68.7%

Re-hospitalized after SNF stay Info Percentage of short-stay residents who were re-hospitalized after their nursing home admission. 25.6%
11% worse than Pennsylvania average

Pennsylvania average: 23.1%

Emergency department visits Info Percentage of short-stay residents who had an outpatient emergency department visit. 7.0%
29% better than Pennsylvania average

Pennsylvania average: 9.8%

Falls with major injury Info Percentage of SNF residents who experience falls with major injury during their stay. 0.0%
100% better than Pennsylvania average

Pennsylvania average: 0.8%

Ability to care for self at discharge Info Percentage of residents at or above expected ability to care for themselves at discharge. 56.4%
5% better than Pennsylvania average

Pennsylvania average: 53.7%

Successful return to home or community Info Rate of successful return to home or community from a skilled nursing facility. 32.5%
36% worse than Pennsylvania average

Pennsylvania average: 50.6%

Guides for Better Senior Living

Care Cost Calculator: See Prices in Your Area

Nursing Home Data Explorer

Don’t Wait Too Long: 7 Red Flag Signs Your Parent Needs Assisted Living Now

The True Cost of Assisted Living in 2025 – And How Families Are Paying For It

Understanding Senior Living Costs: Pricing Models, Discounts & Financial Assistance

Financial Aid for Pennsylvania Seniors

Get financial aid guidance

Community HealthChoices (CHC)

PA Medicaid CHC

Age 65+ or disabled, Pennsylvania resident, Medicaid-eligible, nursing home-level care need.

~$2,829/month (300% FBR, individual).

$2,000 (individual), $3,000 (couple) (excludes home, car).

Managed care model; high urban demand (e.g., Philadelphia, Pittsburgh).

Pennsylvania OPTIONS Program

PA OPTIONS

Age 60+, Pennsylvania resident, at risk of nursing home placement.

~$2,000/month (individual, varies by region).

$8,000 (individual).

Cost-sharing required above certain income; rural/urban balance.

Living Independence for the Elderly (LIFE)

Pennsylvania LIFE (PACE)

Age 55+, PA resident (specific counties), NFLOC, safe with LIFE support.

~$2,829/month (Medicaid-eligible); private pay option available.

$2,000 (individual), $3,000 (couple) for Medicaid enrollees.

16 providers in 25 counties (e.g., Allegheny, Luzerne); LIFE branding unique to PA.

Medicare Savings Program (MSP)

Pennsylvania Medicare Savings Program

Age 65+ or disabled, PA resident, Medicare Part A/B.

~$2,510/month (QMB), ~$3,380/month (SLMB), ~$3,598/month (QI)—individual.

$9,430 (individual), $14,130 (couple).

Three tiers; includes Extra Help for Part D; no waitlist.

Low-Income Home Energy Assistance Program (LIHEAP)

Pennsylvania LIHEAP

Age 60+ prioritized, PA resident, low-income household.

~$3,970/month (individual, 185% FPL).

Not assessed; income-focused.

Cash grants and crisis aid; serves ~600,000 households annually.

Family Caregiver Support Program (FCSP)

Pennsylvania Family Caregiver Support Program

Caregivers of 60+ needing care or 55+ caregivers of others; PA resident; functional needs (2+ ADLs).

No strict cap; reimbursements up to $600/month if care recipient income < ~$2,322/month (185% FPL).

Not assessed; need-based.

High demand; includes grandparent caregivers.

Senior Community Service Employment Program (SCSEP)

Pennsylvania SCSEP

Age 55+, unemployed, low-income, PA resident.

~$1,983/month (125% FPL).

Not specified; income-focused.

Priority for veterans, rural residents; AARP partnership.

VA Aid and Attendance (A&A) and Housebound Benefits

Pennsylvania VA Aid and Attendance/Housebound

Age 65+ or disabled veteran/spouse, PA resident, wartime service, need for ADL help (A&A) or homebound.

Net income < ~$1,984/month (veteran with dependent, A&A); pension offsets income.

~$155,356 (net worth limit).

High veteran population; supports rural/urban care needs.

Property Tax/Rent Rebate Program (PTRR)

Pennsylvania Property Tax/Rent Rebate Program

Age 65+, PA resident, homeowner/renter (or widow/er 50+, disabled 18+).

~$45,000/year (individual or couple, excludes half of Social Security).

Not assessed; income-focused.

Rebates up to $1,000; ~600,000 eligible annually.

Senior Farmers’ Market Nutrition Program (SFMNP)

Pennsylvania SFMNP

Age 60+, PA resident, low-income.

~$2,322/month (individual, 185% FPL).

Not assessed.

Vouchers (~$50/season) via 52 AAAs; serves ~200,000 annually.