Garden Spring Nursing and Rehabilitation Center
Nursing Home, Assisted Living, Independent Living & Memory Care · Abington, PA
CMS overall rating Info CMS (the Centers for Medicare & Medicaid Services) is the federal agency that rates nursing home quality. Its Overall Rating runs from 1 to 5 stars, combining health inspections, staffing, and quality measures, with inspections weighted most heavily.

Garden Spring Nursing and Rehabilitation Center

Nursing Home, Assisted Living, Independent Living & Memory Care · Abington, PA
CMS overall rating Info CMS (the Centers for Medicare & Medicaid Services) is the federal agency that rates nursing home quality. Its Overall Rating runs from 1 to 5 stars, combining health inspections, staffing, and quality measures, with inspections weighted most heavily.
Calculator: See prices in your area
Garden Spring Nursing and Rehabilitation Center accepts Medicare, Medicaid, and private pay.

Overview of Garden Spring Nursing and Rehabilitation Center

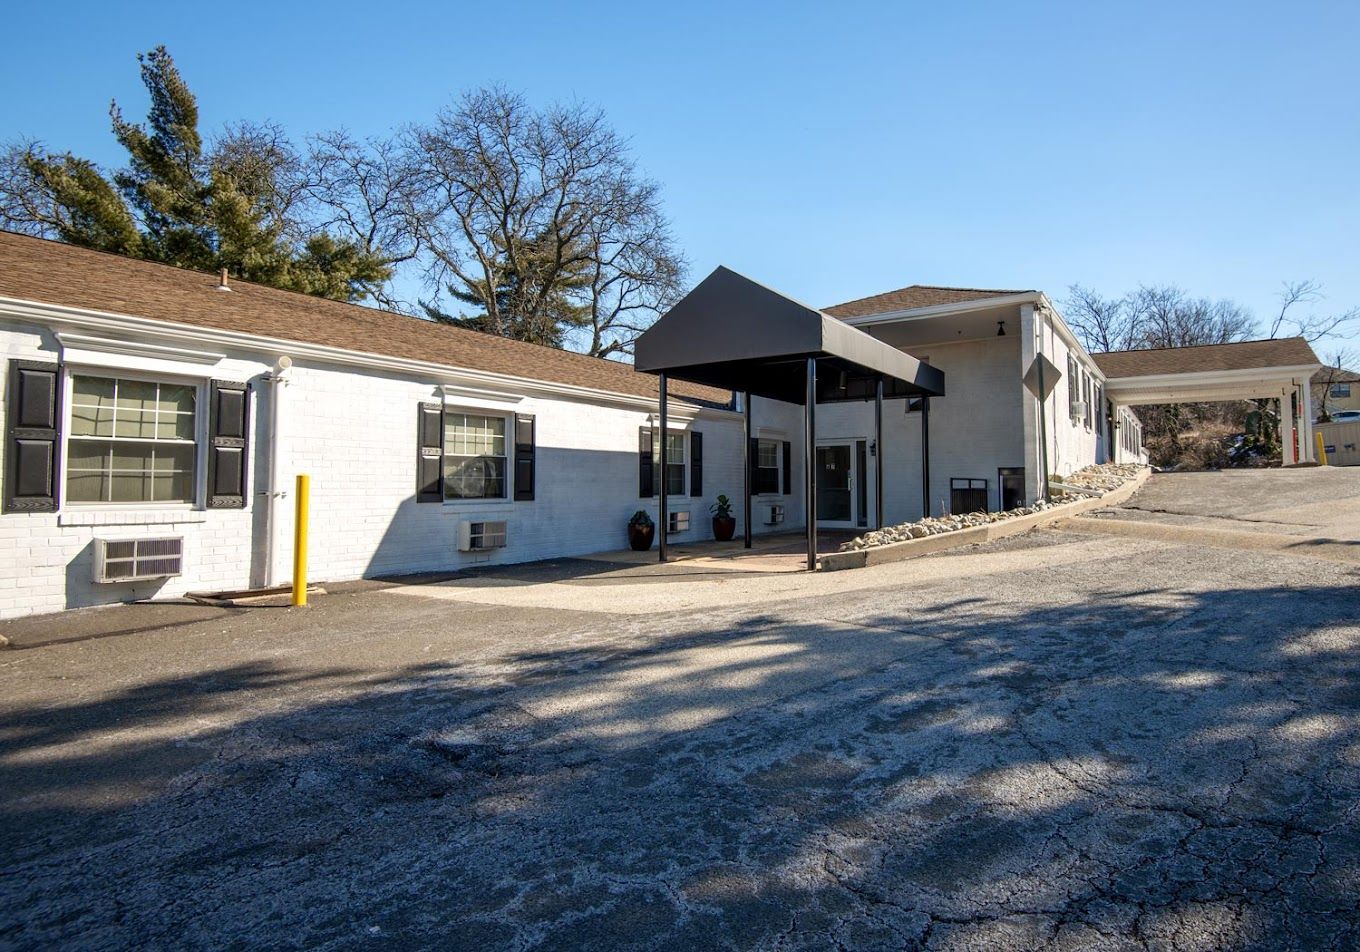
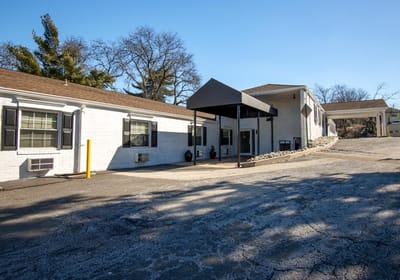
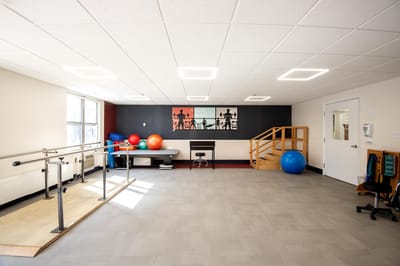
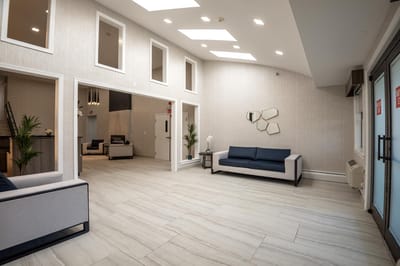
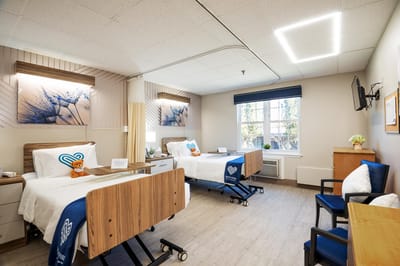
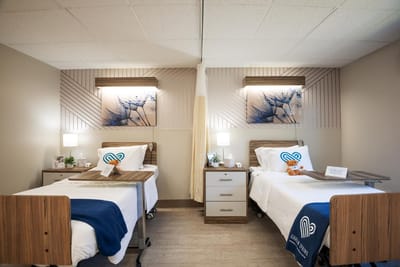
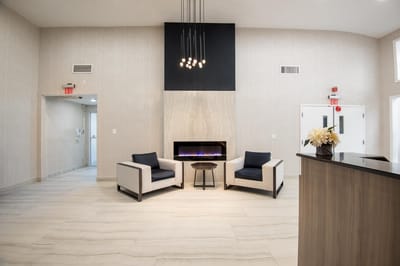
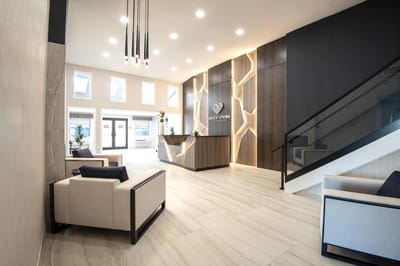
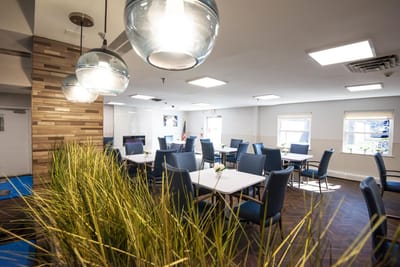
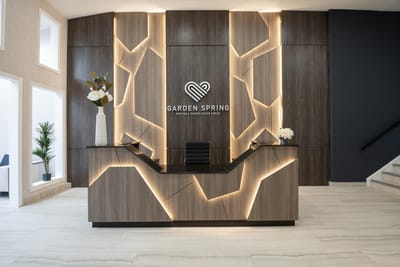
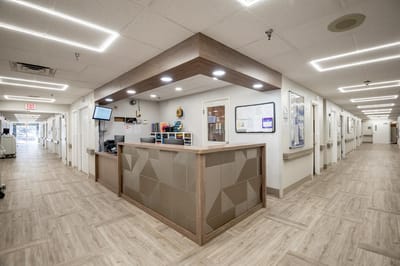
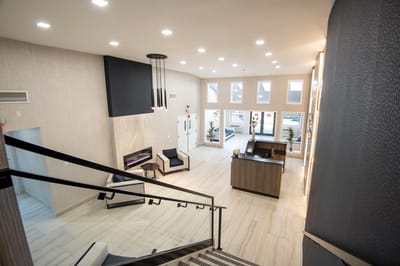
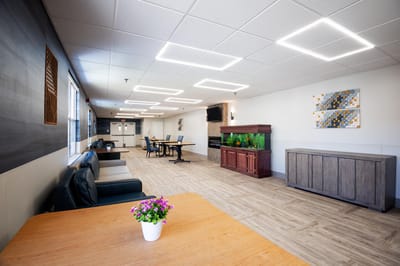
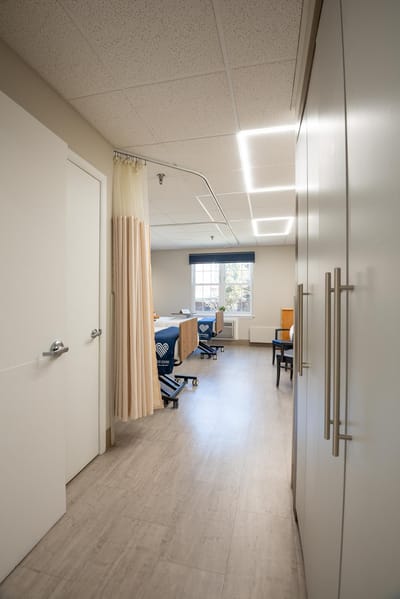
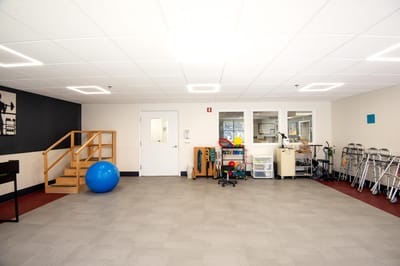
Overlooking the charming neighborhood of Willow Grove, PA, Garden Spring Nursing and Rehabilitation Center is a welcoming senior living community, offering skilled nursing and rehabilitation services. The community guarantees each resident with excellent support and care services tailored to their individual needs and care goals, ensuring a fast and comfortable recovery process. Residents here are offered comfortable accommodations and an excellent care team consisting of doctors, nurses, therapists, and social workers who work hand-in-hand to deliver exceptional care.

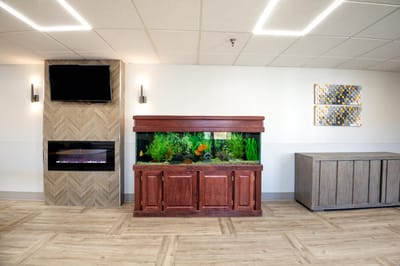
In addition to continuous care, the community offers a diverse range of activities to stimulate, engage, and entertain residents, including regular performances, bingo, and more. Nestled within abundant greenery, the community provides a safe and relaxing healing space that allows them to stay active or relax. With round the clock support, excellent support systems, and dynamic programs, residents here are bound to enjoy a dynamic and comfortable life.

Quality ratings

Measured by Centers for Medicare & Medicaid Services (CMS)

Overall rating Info The Overall CMS Rating combines results from health inspections, staffing levels and quality measures. Health inspections carry the most weight. Staffing and quality scores can increase or decrease the final rating based on performance compared to state and national standards.
▼ 33.3% Below PA avg. ▼ 33.3% Below PA avg.PA average: 3.0Click the badge to see the full State ranking.Click here to see the full State ranking.
Health Inspection Info Based on the results of the facility's three most recent standard inspections and any complaint investigations. CMS reviews the number, scope, and severity of deficiencies, with more recent findings weighted more heavily.
▼ 28.5% Below PA avg. ▼ 28.5% Below PA avg.PA average: 2.8Click the badge to see the full State ranking.Click here to see the full State ranking.
Staffing Info Measures average nursing staff hours per resident per day, including Registered Nurses (RNs) and total nursing staff. Ratings are adjusted based on the level of care residents require and are compared to state and national benchmarks.
▼ 41.0% Below PA avg. ▼ 41.0% Below PA avg.PA average: 3.4Click the badge to see the full State ranking.Click here to see the full State ranking.
Quality Measures Info Based on clinical and physical health indicators reported to CMS, such as hospital readmissions, falls, pressure ulcers, and improvements in mobility. These measures reflect how well residents' health needs are being managed.
▼ 11.6% Below PA avg. ▼ 11.6% Below PA avg.PA average: 3.4Click the badge to see the full State ranking.Click here to see the full State ranking.

Staffing hours breakdown

Info Daily nursing hours per resident by staff type, reported to CMS. Higher is generally better — compare this facility to state and national averages to see where staffing stands.

Hours per resident per day — compared to Pennsylvania state averages

Total nursing care / resident Info This home is ranked 168th out of 207 homes in Pennsylvania for nurse hours. Total adjusted nursing hours per resident per day, combining RN, LPN, and aide time. CMS adjusts this for case-mix so facilities can be fairly compared.
3h 35m per day
Rank #168 / 207Nurse hours — State benchmarkedThis home is ranked 168th out of 207 homes in Pennsylvania. Shows adjusted nurse hours per resident per day benchmarked to the Pennsylvania average, with a ranking across 207 Pennsylvania facilities. More hours mean more direct care. The national average is about 3.5 hrs; below 3.0 is a red flag.Rankings are based only on facilities in Pennsylvania that report data for that category. Facilities without available data are excluded from the ranking.Click the rank badge to see the full State ranking.Click here to see the full State ranking.
This facility Pennsylvania avg (4h 9m per day)
vs Pennsylvania avg
-13%

5 of 6 metrics below state avg

Standout metric LPN / LVN is +32% above state avg
Staff typeHours / Day / Residentvs state avg
Registered Nurse (RN) Info RNs hold the highest nursing license and can assess residents, interpret test results, and direct care plans. More RN hours per day often signals stronger clinical oversight and faster response to health changes. 26m per day ▼ 45% State avg: 47m per day · National avg: 41m per day
LPN / LVN Info Licensed Practical Nurses (LPNs) or Licensed Vocational Nurses (LVNs) deliver routine hands-on care — medication administration, wound dressing, and monitoring vital signs. They work under RN supervision and make up a large share of daily bedside care. 1h 13m per day ▲ 32% State avg: 55m per day · National avg: 52m per day
Nurse Aide Info Certified Nurse Aides (CNAs) provide the most direct day-to-day assistance: bathing, dressing, feeding, and mobility. Nurse aide hours are typically the largest staffing category and directly affect residents' quality of life. 2h 0m per day ▼ 9% State avg: 2h 12m per day · National avg: 2h 21m per day
Weekend Total Nursing Info Combined nursing hours (RN + LPN + Nurse Aide) per resident per day on weekends. Staffing often drops on weekends — this figure reveals whether the facility maintains adequate coverage outside of weekday hours. 3h 25m per day ▼ 3% State avg: 3h 31m per day · National avg: 3h 26m per day
Physical Therapist Info Hours per resident per day provided by licensed Physical Therapists (PTs) or PT Assistants. PT services help residents recover mobility after injury or illness and are especially important for post-acute (short-stay) rehabilitation. 3m per day ▼ 47% State avg: 6m per day · National avg: 4m per day
Weekend RN Info Registered nurse hours specifically on weekends. Facilities sometimes reduce RN presence on Saturdays and Sundays — a low weekend RN figure compared to weekday hours can indicate reduced clinical oversight when most administrative staff are absent. 16m per day ▼ 52% State avg: 33m per day · National avg: 29m per day

Capacity and availability

This home usually has availability

Lower occupancy than the Pennsylvania average: 78.7%
Occupancy rate
71.2% Rank #257 / 518Occupancy rate — State benchmarkedThis home is ranked 257th out of 518 homes in Pennsylvania. Shows this facility's occupancy rate versus the Pennsylvania average, with its Statewide rank out of 518. Higher occupancy signals strong local demand and financial stability.Rankings are based only on facilities in Pennsylvania that report data for that category. Facilities without available data are excluded from the ranking.Click the rank badge to see the full State ranking.Click here to see the full State ranking.
Avg. Length of Stay
132 days
Bed community size
173-bed community Rank #34 / 555Bed count — State benchmarkedThis home is ranked 34th out of 555 homes in Pennsylvania. Shows this facility's certified or reported bed count compared to other Pennsylvania facilities. Larger communities may offer more amenities, programs, and on-site services for residents and families.Rankings are based only on facilities in Pennsylvania that report data for that category. Facilities without available data are excluded from the ranking.Click the rank badge to see the full State ranking.Click here to see the full State ranking.
A large-scale community that may provide a wide range of amenities, services, and structured programs.
Walk Score
Walk Score: 54 / 100 Rank #249 / 668Walk Score — State benchmarkedThis home is ranked 249th out of 668 homes in Pennsylvania. Shows how walkable this facility's neighborhood is compared to the average Walk Score across Pennsylvania facilities. Higher scores benefit residents, families, and staff.Rankings are based only on facilities in Pennsylvania that report data for that category. Facilities without available data are excluded from the ranking.Click the rank badge to see the full State ranking.Click here to see the full State ranking.
Moderately walkable. Some errands can be accomplished on foot, with a mix of nearby amenities.

Therapy & Rehabilitation

2 services
Rehabilitation Services
Respite Care

Staffing & Medical

1 service
24-Hour Staffing

Dining & Nutrition

Food DescriptionAt Garden Spring Nursing and Rehabilitation Center, delicious, nutritionally balanced meals are prepared by a professional culinary team, catering to various dietary needs and preferences.

Contact Garden Spring Nursing and Rehabilitation Center

Staffing Data

Reporting period: October 1 – December 31, 2025 (Q4 2025). Source: CMS Payroll-Based Journal report.

Total staff 315
Employees 130
Contractors 185
Staff to resident ratio 2.52 : 1
37% more staff per resident than Pennsylvania average
Pennsylvania average ratio: 1.83 : 1 Pennsylvania average ratio: 1.83 : 1See full Pennsylvania ranking
Avg staff/day 67
Average shift 8.2 hours
5% better than Pennsylvania average
Pennsylvania average: 7.8 hours Pennsylvania average shift: 7.8 hoursSee full Pennsylvania ranking
Total staff hours (quarter) 50,238

Nursing staff breakdown

Q4 2025 · Oct 1 – Dec 31 More info This data comes from the CMS Payroll-Based Journal report covering October 1 – December 31, 2025.
Registered Nurse

Manages medical care and health needs.

RN Staff Info All 3 RN Staff are full-time employees. No contractors work on this role. 3
Average shift length Info Average shift length. Calculated as total hours divided by days worked and average staff per day. 10.2 hours
Licensed Practical Nurse

Assists with medical care and medications.

LPN Staff Info 95 total: 38 full-time employees and 57 contractors. 95
Average shift length Info Average shift length. Calculated as total hours divided by days worked and average staff per day. 8.4 hours
Certified Nursing Assistant

Helps with daily care and mobility.

CNA Staff Info 179 total: 51 full-time employees and 128 contractors. 179
Average shift length Info Average shift length. Calculated as total hours divided by days worked and average staff per day. 8.2 hours

Contractor staffing

Q4 2025 · Oct 1 – Dec 31 More info This data comes from the CMS Payroll-Based Journal report covering October 1 – December 31, 2025.

Total hours from contractors

20.3%

10,204 contractor hours this quarter

Certified Nursing Assistant: 128 Licensed Practical Nurse: 57

Staff by category

Q4 2025 · Oct 1 – Dec 31 More info This data comes from the CMS Payroll-Based Journal report covering October 1 – December 31, 2025.
Certified Nursing Assistant5112817924,37792100%8.2
Licensed Practical Nurse38579514,18992100%8.4
Clinical Nurse Specialist170173,24292100%7.9
Other Dietary Services Staff7072,25592100%7.6
Registered Nurse3031,5197885%10.2
Respiratory Therapy Technician2026517278%6.9
RN Director of Nursing2025607582%5.7
Physical Therapy Assistant2025436874%7.3
Administrator1015206571%8
Nurse Practitioner1015126470%8
Speech Language Pathologist2025056773%6.9
Mental Health Service Worker1014866166%8
Respiratory Therapist1014556470%7.1
Qualified Social Worker2024246571%6.5
179 Certified Nursing Assistant
% of Days 100%
95 Licensed Practical Nurse
% of Days 100%
17 Clinical Nurse Specialist
% of Days 100%
7 Other Dietary Services Staff
% of Days 100%
3 Registered Nurse
% of Days 85%
2 Respiratory Therapy Technician
% of Days 78%
2 RN Director of Nursing
% of Days 82%
2 Physical Therapy Assistant
% of Days 74%
1 Administrator
% of Days 71%
1 Nurse Practitioner
% of Days 70%
2 Speech Language Pathologist
% of Days 73%
1 Mental Health Service Worker
% of Days 66%
1 Respiratory Therapist
% of Days 70%
2 Qualified Social Worker
% of Days 71%

Penalties and fines

Federal penalties imposed by CMS for regulatory violations, including civil money penalties (fines) and denials of payment for new Medicare/Medicaid admissions.

Source: CMS Penalties Database

No penalties in the past 3 years

No civil money penalties or payment denials were reported in the last 3 years.

Quality of care over time

These measures show how residents usually do over time at this home, based on health outcomes and preventive care.

High-risk clinical events score Info A composite score based on pressure ulcers, falls with injury, weight loss, walking ability decline, and activities of daily living decline. 12.4
12% worse than Pennsylvania average

Pennsylvania average: 11.0

Functional decline score Info A composite score based on activities of daily living decline, walking ability decline, and incontinence. 21.1
5% better than Pennsylvania average

Pennsylvania average: 22.2

Long-stay resident measures
Below average Pennsylvania avg: 3.7 Info CMS star rating based on long-stay quality measure performance. 5 stars = significantly above average, 1 star = significantly below average.
Need for Help with Daily Activities Increased Info Percent of long-stay residents whose need for help with daily activities has increased 14.5%
24% better than Pennsylvania average

Pennsylvania average: 19.0%

Walking Ability Worsened Info Percent of long-stay residents whose ability to move independently worsened 23.2%
10% worse than Pennsylvania average

Pennsylvania average: 21.1%

Low Risk Residents with Bowel/Bladder Incontinence Info Percent of low risk long-stay residents who lose control of their bowels or bladder 25.6%
In line with Pennsylvania average

Pennsylvania average: 26.7%

Falls with Major Injury Info Percent of long-stay residents experiencing one or more falls with major injury 4.6%
46% worse than Pennsylvania average

Pennsylvania average: 3.2%

High Risk Residents with Pressure Ulcers Info Percent of long-stay high risk residents with pressure ulcers 9.3%
68% worse than Pennsylvania average

Pennsylvania average: 5.5%

Urinary Tract Infection Info Percent of long-stay residents with a urinary tract infection 1.3%
28% better than Pennsylvania average

Pennsylvania average: 1.8%

Lost Too Much Weight Info Percent of long-stay residents who lose too much weight 10.2%
54% worse than Pennsylvania average

Pennsylvania average: 6.6%

Depressive Symptoms Info Percent of long-stay residents who have depressive symptoms 4.3%
22% better than Pennsylvania average

Pennsylvania average: 5.5%

Antipsychotic Use Info Percent of long-stay residents who received an antipsychotic medication 14.8%
14% better than Pennsylvania average

Pennsylvania average: 17.1%

Pneumococcal Vaccine Info Percent of long-stay residents assessed and appropriately given the pneumococcal vaccine 58.9%
32% worse than Pennsylvania average

Pennsylvania average: 86.9%

Influenza Vaccine Info Percent of long-stay residents assessed and appropriately given the seasonal influenza vaccine 85.4%
9% worse than Pennsylvania average

Pennsylvania average: 93.5%

Hospitalizations per 1,000 days Info Number of hospitalizations per 1,000 long-stay resident days. 3.55
111% worse than Pennsylvania average

Pennsylvania average: 1.68

ED visits per 1,000 days Info Number of outpatient emergency department visits per 1,000 long-stay resident days. 1.04
13% better than Pennsylvania average

Pennsylvania average: 1.20

Short-stay resident measures
Average Pennsylvania avg: 3.2 Info CMS star rating based on short-stay quality measure performance. 5 stars = much above average, 1 star = much below average.
Pneumococcal Vaccine Info Percent of short-stay residents assessed and appropriately given the pneumococcal vaccine 13.7%
80% worse than Pennsylvania average

Pennsylvania average: 68.8%

Antipsychotic medication increase Info Percent of short-stay residents who newly received an antipsychotic medication 0.6%
61% better than Pennsylvania average

Pennsylvania average: 1.5%

Influenza Vaccine Info Percent of short-stay residents assessed and appropriately given the seasonal influenza vaccine 16.7%
76% worse than Pennsylvania average

Pennsylvania average: 68.7%

Re-hospitalized after SNF stay Info Percentage of short-stay residents who were re-hospitalized after their nursing home admission. 25.6%
11% worse than Pennsylvania average

Pennsylvania average: 23.1%

Emergency department visits Info Percentage of short-stay residents who had an outpatient emergency department visit. 7.0%
29% better than Pennsylvania average

Pennsylvania average: 9.8%

Falls with major injury Info Percentage of SNF residents who experience falls with major injury during their stay. 0.0%
100% better than Pennsylvania average

Pennsylvania average: 0.8%

Ability to care for self at discharge Info Percentage of residents at or above expected ability to care for themselves at discharge. 56.4%
5% better than Pennsylvania average

Pennsylvania average: 53.7%

Successful return to home or community Info Rate of successful return to home or community from a skilled nursing facility. 32.5%
36% worse than Pennsylvania average

Pennsylvania average: 50.6%

Breakdown by payment type

Medicare

19% of new residents, usually for short-term rehab.

Typical stay 1 months

Private pay

37% of new residents, often for short stays.

Typical stay 1 - 2 months

Medicaid

44% of new residents, often for long-term daily care.

Typical stay 8 - 9 months

Facility Characteristics

Source: CMS Long-Term Care Facility Characteristics (Data as of Jan 2026)

Total residents 125
Medicare
2
1.6% of residents
Medicaid
113
90.4% of residents
Private pay or other
10
8% of residents
Programs & Services
Residents Group

Residents meet regularly to discuss policies, care quality, and activities

Active Resident Council

Organized group of residents that meets regularly to discuss facility policies, quality of life, and activities.

Finances and operations

Based on CMS SNF Cost Report for fiscal year ending in 06/2024.

Voluntary non-profit community
Operated by a church.
Net patient revenue Info Net patient revenue — what the home actually collects for resident care, after contractual allowances, bad debt and discounts are subtracted from its gross charges (CMS cost report, Worksheet G-3). It covers resident care only; money the home earns from other sources is shown separately as "Other income."
$13.9M
Net patient income Info Net patient income: net patient revenue minus the home's total operating expenses. A positive figure means it earns more from resident care than it spends to deliver it; a negative figure means the opposite. It excludes non-operating "other income."
-$2.5M
Voluntary non-profit community Operated by a church.
Net patient revenue Info Net patient revenue — what the home actually collects for resident care, after contractual allowances, bad debt and discounts are subtracted from its gross charges (CMS cost report, Worksheet G-3). It covers resident care only; money the home earns from other sources is shown separately as "Other income."
$13.9M Rank #159 / 209Revenue — State benchmarkedThis home is ranked 159th out of 209 homes in Pennsylvania. Shows this facility's annual revenue compared to the Pennsylvania average. Higher revenue generally means more resources for staffing and capital — read alongside Payroll %.Rankings are based only on facilities in Pennsylvania that report data for that category. Facilities without available data are excluded from the ranking.Click the rank badge to see the full State ranking.Click here to see the full State ranking.
Net patient income Info Net patient income: net patient revenue minus the home's total operating expenses. A positive figure means it earns more from resident care than it spends to deliver it; a negative figure means the opposite. It excludes non-operating "other income."
-$2.5M
Other income Info Money the home earns outside of resident care — such as investments, grants, rentals and other non-operating sources (CMS cost report, Worksheet G-3). It is tracked separately from net patient revenue: it is not part of that figure, and it is not included in net patient income.
$89.7K
Payroll costs Info Staff salaries plus wage-related costs — benefits such as payroll taxes, health insurance and retirement — from the home's own accounting records (CMS cost report, Worksheet A). Contract or agency labor is counted separately, under other operating costs. Rank #129 / 209Payroll — State benchmarkedThis home is ranked 129th out of 209 homes in Pennsylvania. Shows total annual staff payroll benchmarked to the Pennsylvania average. Higher payroll investment relative to peers often signals better staffing and less reliance on cheaper contract labor.Rankings are based only on facilities in Pennsylvania that report data for that category. Facilities without available data are excluded from the ranking.Click the rank badge to see the full State ranking.Click here to see the full State ranking.
$6.8M 49.2% of net patient revenue Info Payroll as a share of revenue: staff salaries and wage-related benefits divided by net patient revenue. A higher figure means more of each revenue dollar goes to staff pay. Rank #24 / 209Payroll % — State benchmarkedThis home is ranked 24th out of 209 homes in Pennsylvania. Shows payroll as a percentage of revenue versus the Pennsylvania average. Well-run Pennsylvania facilities typically land around 53–61% — the top third Statewide. Below 25% may signal understaffing or heavy agency use — read with Staffing ratings.Rankings are based only on facilities in Pennsylvania that report data for that category. Facilities without available data are excluded from the ranking.Click the rank badge to see the full State ranking.Click here to see the full State ranking.
Other operating costs Info Everything it costs to run the home apart from payroll — food, utilities, supplies, maintenance, contract labor and administration. Calculated as total operating expense minus payroll (staff salaries and wage-related benefits).
$9.5M
Total costs Info The home's total operating expense for the year — all the costs of running it, salaries included (CMS cost report, Worksheet G-3).
$16.4M

What does this home offer?

Building type icon
Building type icon

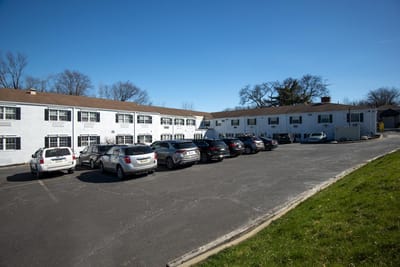
Building Type: Two-story

Who this home usually serves

TYPE OF STAY

Mostly long-term care residents

Most residents stay for extended periods and receive ongoing daily care.

New residents most often arrive under Medicaid (44% of admissions), and a typical Medicaid stay runs around 8 - 9 months.

Admissions
335 total

Coverage residents most often arrive under.

Medicare 19%
Private pay 37%
Medicaid 44%
Discharges
342 total

Coverage residents most often leave under.

Medicare 11%
Private pay 29%
Medicaid 61%

Places of interest near Garden Spring Nursing and Rehabilitation Center

Address 1.0 miles from city center Info Estimated distance in miles from Willow Grove's city center to Garden Spring Nursing and Rehabilitation Center's address, calculated via Google Maps.

Calculate Travel Distance to Garden Spring Nursing and Rehabilitation Center

Add your location

Address

Compare Nursing Homes around Abington

The information below is reported by the Pennsylvania Department of Human Services and Department of Health.

2 facilities compared · CMS & PA Dept. of Health data

Lima Estates
NH
AL
IL
MC
Media
60
Facility 60
PA AVG 94
Rank #399 / 555
62.3%
Facility 62.3%
PA AVG 78.7%
Rank #336 / 518
-21%
4.54
Facility 4.54
PA AVG 4.15
Rank #78 / 207
+122%+10%
$0
Facility $0
PA AVG $61.2k
Rank #1 / 210
----5A+
24
Facility 24
PA AVG 46
Rank #511 / 668
-
$16.5M
Facility $16.5M
PA AVG $32.8M
Rank #113 / 209
$8.3M
Facility $8.3M
PA AVG $6.7M
Rank #134 / 209
50.7%
Facility 50.7%
PA AVG 40%
Rank #165 / 209
395492
Garden Spring Nursing and Rehabilitation Center
NH
AL
IL
MC
Willow Grove
173
Facility 173
PA AVG 94
Rank #34 / 555
71.2%
Facility 71.2%
PA AVG 78.7%
Rank #257 / 518
-10%
3.59
Facility 3.59
PA AVG 4.15
Rank #168 / 207
-92%-13%
$0
Facility $0
PA AVG $61.2k
Rank #1 / 210
-
45
Facility 45
PA AVG 31.3
Rank #171 / 207
4.1
Facility 4.1
PA AVG 4.4
Rank #121 / 207
1133-
54
Facility 54
PA AVG 46
Rank #249 / 668
Bh Opco Holdco LLC
$13.9M
Facility $13.9M
PA AVG $32.8M
Rank #159 / 209
$6.8M
Facility $6.8M
PA AVG $6.7M
Rank #129 / 209
49.2%
Facility 49.2%
PA AVG 40%
Rank #24 / 209
395077

Financial Assistance for
Nursing Home in Pennsylvania

Garden Spring Nursing and Rehabilitation Center is located in Willow Grove, Pennsylvania.
Here are the financial assistance programs available to residents in Pennsylvania.

Get Financial aid guidance

Community HealthChoices (CHC)

PA Medicaid CHC

Age 65+ or disabled
General Pennsylvania resident, Medicaid-eligible, nursing home-level care need.
Income Limits (2025) ~$2,829/month 300% FBR, individual
Asset Limits $2,000 (individual), $3,000 (couple) (excludes home, car).
PA

Managed care model; high urban demand (e.g., Philadelphia, Pittsburgh).

Benefits
Personal care (5-7 hours/day, e.g., bathing, dressing) Respite care (up to 240 hours/year) Adult day care ($70/day) Home modifications ($1,500 avg.)

Pennsylvania OPTIONS Program

PA OPTIONS

Age 60+
General Pennsylvania resident, at risk of nursing home placement.
Income Limits ~$2,000/month individual, varies by region
Asset Limits $8,000 individual
PA

Cost-sharing required above certain income; rural/urban balance.

Benefits
In-home care (3-5 hours/week) Respite (up to 10 days/year) Adult day care (~$70/day) Transportation (~5 trips/month)

Living Independence for the Elderly (LIFE)

Pennsylvania LIFE (PACE)

Age 55+
General PA resident (specific counties), NFLOC, safe with LIFE support.
Income Limits (2025) ~$2,829/month (Medicaid-eligible); private pay option available.
Asset Limits $2,000 (individual), $3,000 (couple) for Medicaid enrollees.
PA

16 providers in 25 counties (e.g., Allegheny, Luzerne); LIFE branding unique to PA.

Benefits
Personal care (5-7 hours/day) Medical care Meals Transportation Respite Therapies

Medicare Savings Program (MSP)

Pennsylvania Medicare Savings Program

Age 65+ or disabled
General PA resident, Medicare Part A/B.
Income Limits (2025) ~$2,510/month (QMB), ~$3,380/month (SLMB), ~$3,598/month (QI)—individual.
Asset Limits $9,430 (individual), $14,130 (couple).
PA

Three tiers; includes Extra Help for Part D; no waitlist.

Benefits
Covers Part B premiums ($174.70/month) Deductibles ($240/year) Copays (~20%)

Family Caregiver Support Program (FCSP)

Pennsylvania Family Caregiver Support Program

Age
General Caregivers of 60+ needing care or 55+ caregivers of others; PA resident; functional needs (2+ ADLs).
Income Limits (2025) No strict cap; reimbursements up to $600/month if care recipient income < ~$2,322/month 185% FPL
Asset Limits Not assessed; need-based.
PA

High demand; includes grandparent caregivers.

Benefits
Respite (4-6 hours/week or 5 days/year) Adult day care ($60/day) Supplies (~$2,000/year) Caregiver training

VA Aid and Attendance (A&A) and Housebound Benefits

Pennsylvania VA Aid and Attendance/Housebound

Age 65+ or disabled veteran/spouse
General PA resident, wartime service, need for ADL help (A&A) or homebound.
Income Limits (2025) Net income < ~$1,984/month (veteran with dependent, A&A); pension offsets income.
Asset Limits ~$155,356 net worth limit
PA

High veteran population; supports rural/urban care needs.

Benefits
Cash (~$1,433-$2,642/month veteran, ~$951-$1,318 spouse) for care costs (e.g., in-home, assisted living)

Property Tax/Rent Rebate Program (PTRR)

Pennsylvania Property Tax/Rent Rebate Program

Age 65+
General PA resident, homeowner/renter (or widow/er 50+, disabled 18+).
Income Limits (2025) ~$45,000/year individual or couple, excludes half of Social Security
Asset Limits Not assessed; income-focused.
PA

Rebates up to $1,000; ~600,000 eligible annually.

Benefits
Rebates ($250-$1,000 based on income; e.g., $1,000 if income < $8,000)

Senior Farmers’ Market Nutrition Program (SFMNP)

Pennsylvania SFMNP

Age 60+
General PA resident, low-income.
Income Limits (2025) ~$2,322/month individual, 185% FPL
Asset Limits Not assessed.
PA

Vouchers (~$50/season) via 52 AAAs; serves ~200,000 annually.

Benefits
Vouchers (~$50/season) for fresh produce at approved markets

Frequently Asked Questions about Garden Spring Nursing and Rehabilitation Center

What neighborhood is Garden Spring Nursing and Rehabilitation Center in?

Garden Spring Nursing and Rehabilitation Center is in the Willow Grove neighborhood.

Is Garden Spring Nursing and Rehabilitation Center in a walkable area?

Garden Spring Nursing and Rehabilitation Center has a walk score of 54. Moderately walkable. Some errands can be accomplished on foot, with a mix of nearby amenities.

What is the occupancy rate at Garden Spring Nursing and Rehabilitation Center?

Garden Spring Nursing and Rehabilitation Center's occupancy is 71.2%.

Are there photos of Garden Spring Nursing and Rehabilitation Center?

Yes — there are 23 photos of Garden Spring Nursing and Rehabilitation Center in the photo gallery on this page.

What is the address of Garden Spring Nursing and Rehabilitation Center?

Garden Spring Nursing and Rehabilitation Center is located at 1113 Easton Rd, Willow Grove, PA 19090.

What is the phone number of Garden Spring Nursing and Rehabilitation Center?

(215) 830-5400 will put you in contact with the team at Garden Spring Nursing and Rehabilitation Center.

Is Garden Spring Nursing and Rehabilitation Center Medicare or Medicaid certified?

Yes — Garden Spring Nursing and Rehabilitation Center is a CMS-certified provider of Medicare and Medicaid.

Guides for Better Senior Living

Care Cost Calculator: See Prices in Your Area

Nursing Home Data Explorer

Don’t Wait Too Long: 7 Red Flag Signs Your Parent Needs Assisted Living Now

The True Cost of Assisted Living in 2025 – And How Families Are Paying For It

Understanding Senior Living Costs: Pricing Models, Discounts & Financial Assistance