


Hospitalizations per 1,000 days
 Number of hospitalizations per 1,000 long-stay resident days.
3.86
Number of hospitalizations per 1,000 long-stay resident days.
3.86
Texas average: 2.13
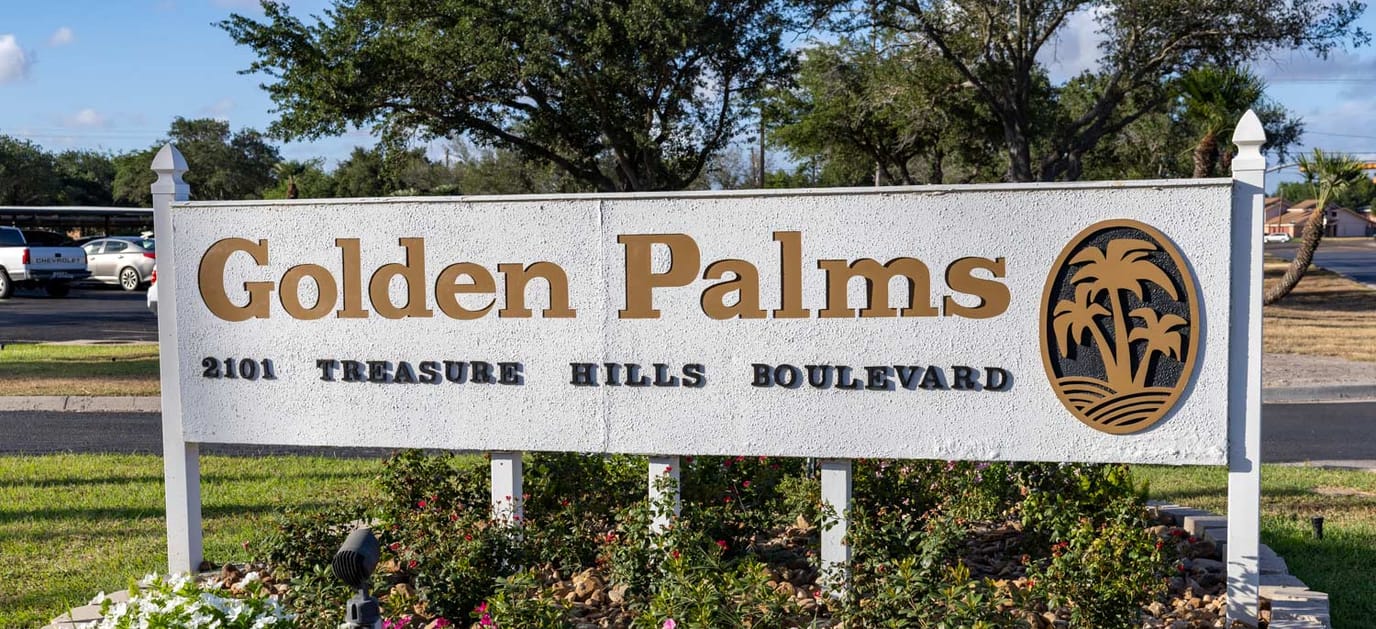


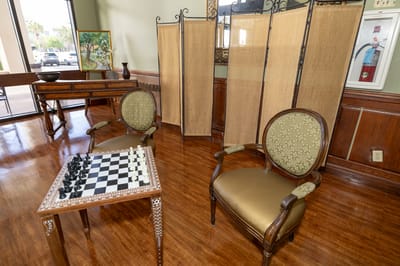

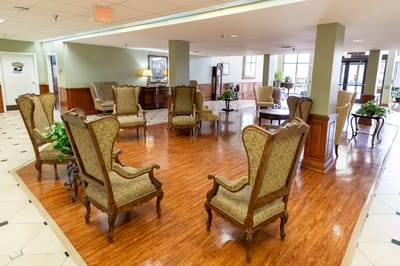


Golden Palms Rehabilitation and Retirement is a skilled nursing community in Harlingen, Texas, offering independent living, assisted living, skilled nursing, recovery services, respite care, and on-site therapy. Managed by Keystone Care LLC under the legal entity Santiago Healthcare LLC in Cameron County, this privately owned, 60-bed community is approved to accept both Medicare and Medicaid. It also achieved an overall CMS score of 3 out of 5 stars, which matches the Texas state average.
The community maintains a 3-star CMS Health Inspection score, which is marginally higher than the Texas average of 2.9, alongside a 2-star staffing score. Over the last three years, it documented 18 total health findings. However, it has faced three federal financial penalties, which is 80% lower than the state average, with no instances of denied payments. Notably, the most recent thorough state review in December 2023 identified zero deficiencies.
Constant staffing is provided with a caregiver-to-resident ratio of 1.65 to 1, performing 9% better than the state average. Physical therapy hours provided to each resident daily are 250% above the Texas average. The team includes speech language pathologists, physical therapy assistants, respiratory technicians, and occupational therapists. Restaurant-style meals are also served three times a day, and the community provides monthly schedules featuring group excursions, faith-based services, and active councils for residents and families.
It has a current occupancy rate of 82.8%, which is 30% higher than the state average. With an average residency of 42 days, the community reflects a clear focus on post-acute recovery for older adults. Additionally, Medicare represents 30% of stays, typically lasting 25 days, while those paying privately make up 69% of admissions and usually stay for about one month. The community also assists long-term Medicaid recipients. Its high numbers for rehabilitation staff, a strong rate of residents returning to their homes at 64.7%, and higher-than-average occupancy signify steady local interest and positive results.
Golden Palms Rehabilitation and Retirement is a great fit for older adults needing recovery support after a hospital visit and looking for short-term recovery options in the Harlingen area.
Staffing hours
![]() Daily nursing hours per resident by staff type, reported to CMS. Higher is generally better — compare this facility to state and national averages to see where staffing stands.
Daily nursing hours per resident by staff type, reported to CMS. Higher is generally better — compare this facility to state and national averages to see where staffing stands.
Hours per resident per day vs Texas averages
Total nursing care
![]() This home is ranked 117th out of 233 homes in Texas for nurse hours. Total adjusted nursing hours per resident per day, combining RN, LPN, and aide time. CMS adjusts this for case-mix so facilities can be fairly compared.
This home is ranked 117th out of 233 homes in Texas for nurse hours. Total adjusted nursing hours per resident per day, combining RN, LPN, and aide time. CMS adjusts this for case-mix so facilities can be fairly compared.
3h 30m
4% below state avg2 of 6 metrics below state avg
Golden Palms Rehabilitation and Retirement is legally operated by Santiago Healthcare LLC.
In Texas, the Health and Human Services Commission (HHSC) is the primary regulatory body that conducts unannounced inspections and publishes quality reports for all long-term care homes.
Citations
| This Facility | TX Average | vs. TX Avg |
|---|---|---|---|
|
Total citations
| 4 | 6 | This facility has 33% fewer total citations than a typical Texas nursing home (4 vs. TX avg 6).↓ 33% better |
|
Health citations
| 4 | 2 | This facility has 100% more health citations than a typical Texas nursing home (4 vs. TX avg 2).↑ 100% worse |
Inspections
| This Facility | TX Average | vs. TX Avg |
|---|---|---|---|
|
Inspections with citations
| 1 | 1 | This facility has inspections with citations in line with the Texas average (1 vs. TX avg 1).— At avg |
Federal penalties imposed by CMS for regulatory violations, including civil money penalties (fines) and denials of payment for new Medicare/Medicaid admissions.
Source: CMS Penalties Database
No penalties in the past 3 years
No civil money penalties or payment denials were reported in the last 3 years.
These measures show how residents usually do over time at this home, based on health outcomes and preventive care.
Texas average: 2.13
Texas average: 2.07
Texas average: 25.9%
Texas average: 12.0%
Texas average: 0.8%
Texas average: 53.7%
Texas average: 50.6%
Quality measures are calculated from Minimum Data Set (MDS) assessments. For most measures, lower percentages indicate better care quality.
30% of new residents, usually for short-term rehab.
69% of new residents, often for short stays.
1% of new residents, often for long-term daily care.
Based on CMS SNF Cost Report for fiscal year ending in 12/2023.
Pets Allowed
Residents typically stay for brief periods, with frequent admissions and discharges throughout the year.
Most new residents arrive under private pay (69% of admissions), and a typical private pay stay runs around 1 months.
Coverage residents most often arrive under.
Coverage residents most often leave under.
![]() 5.6 miles from city center
5.6 miles from city center
![]() Estimated distance in miles from Harlingen's city center to Golden Palms Rehabilitation and Retirement's address, calculated via Google Maps.
Estimated distance in miles from Harlingen's city center to Golden Palms Rehabilitation and Retirement's address, calculated via Google Maps.
Add your location
Golden Palms Rehabilitation and Retirement is located in HARLINGEN, Texas.
Here are the financial assistance programs available to residents in Texas.
Golden Palms Rehabilitation and Retirement is legally operated by Santiago Healthcare LLC.
Golden Palms Rehabilitation and Retirement's occupancy is 82.8%.
Yes, Golden Palms Rehabilitation and Retirement allows residents to bring their pets.
Golden Palms Rehabilitation and Retirement is registered as a for-profit in TX.
Golden Palms Rehabilitation and Retirement has 60 beds.
Golden Palms Rehabilitation and Retirement has had 4 reported citations since 2026 according to records from Texas Health and Human Services (HHSC).
Yes — there are 16 photos of Golden Palms Rehabilitation and Retirement in the photo gallery on this page.
Care Cost Calculator: See Prices in Your Area
Nursing Home Data Explorer
Don’t Wait Too Long: 7 Red Flag Signs Your Parent Needs Assisted Living Now
The True Cost of Assisted Living in 2025 – And How Families Are Paying For It
Understanding Senior Living Costs: Pricing Models, Discounts & Financial Assistance


