Good Samaritan Society – Hutchinson Village
Nursing Home, Assisted Living, Independent Living & Respite Care · Hutchinson, KS
CMS overall rating Info CMS (the Centers for Medicare & Medicaid Services) is the federal agency that rates nursing home quality. Its Overall Rating runs from 1 to 5 stars, combining health inspections, staffing, and quality measures, with inspections weighted most heavily.

Good Samaritan Society – Hutchinson Village

Nursing Home, Assisted Living, Independent Living & Respite Care · Hutchinson, KS
CMS overall rating Info CMS (the Centers for Medicare & Medicaid Services) is the federal agency that rates nursing home quality. Its Overall Rating runs from 1 to 5 stars, combining health inspections, staffing, and quality measures, with inspections weighted most heavily.
Calculator: See prices in your area
Good Samaritan Society – Hutchinson Village accepts Medicare, Medicaid, and private pay.

Overview of Good Samaritan Society – Hutchinson Village

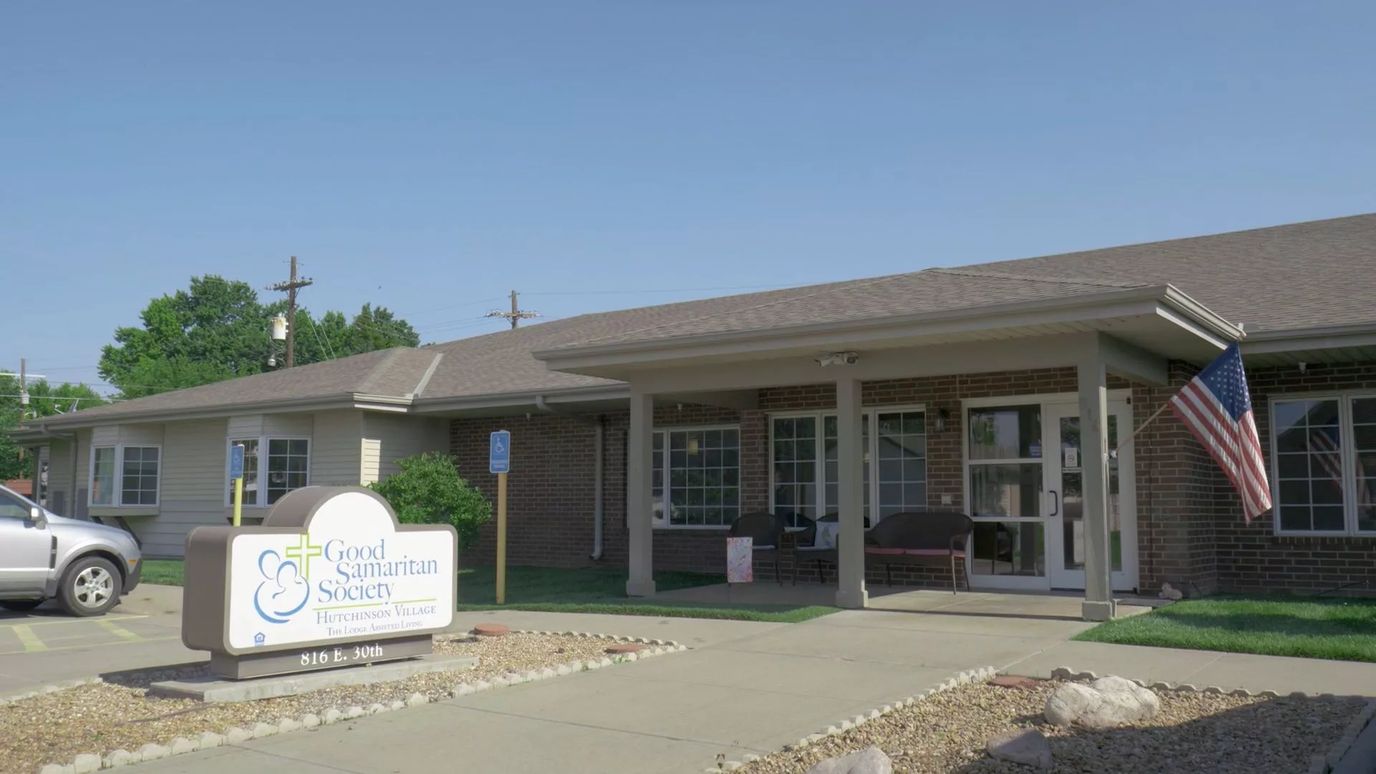
Nestled in the heart of Hutchinson, Kansas, Good Samaritan Society – Hutchinson Village is a haven of compassionate care for seniors, surpassing mere housing. This vibrant village provides a spectrum of living options tailored to individual needs, such as a specialized Memory Care unit for those with memory challenges. Hutchinson Village caters to diverse requirements. The devoted staff at Hutchinson Village goes beyond attending to physical well-being, extending their care to encompass the mind and spirit of each senior resident. 
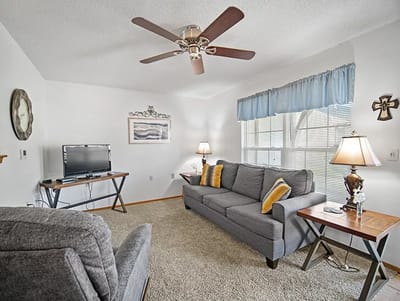
At Good Samaritan Society – Hutchinson Village, seniors share their stories and celebrate them. The community is dedicated to prioritizing the well-being of its residents, providing a space where they can find solace in their hearts and embrace a fulfilling season. The abundance of amenities adds to the community’s allure, from the inviting clubhouse patio to the wellness center promoting a healthy lifestyle. The dining room, chapel, library, and salon collectively contribute to fostering a sense of community, seamlessly weaving home comforts into the fabric of daily life. Engaging in friendly conversations, participating in spiritual gatherings, or enjoying the well-appointed game room, residents flourish in an environment that places a premium on top-notch service and holistic memory care services. 

(620) 888-7287

Quality ratings

Measured by Centers for Medicare & Medicaid Services (CMS)

Overall rating Info The Overall CMS Rating combines results from health inspections, staffing levels and quality measures. Health inspections carry the most weight. Staffing and quality scores can increase or decrease the final rating based on performance compared to state and national standards.
▲ 38.3% Above KS avg. ▲ 38.3% Above KS avg.KS average: 2.9Click the badge to see the full State ranking.Click here to see the full State ranking.
Health Inspection Info Based on the results of the facility's three most recent standard inspections and any complaint investigations. CMS reviews the number, scope, and severity of deficiencies, with more recent findings weighted more heavily.
▲ 44.8% Above KS avg. ▲ 44.8% Above KS avg.KS average: 2.8Click the badge to see the full State ranking.Click here to see the full State ranking.
Staffing Info Measures average nursing staff hours per resident per day, including Registered Nurses (RNs) and total nursing staff. Ratings are adjusted based on the level of care residents require and are compared to state and national benchmarks.
▲ 15.7% Above KS avg. ▲ 15.7% Above KS avg.KS average: 3.5Click the badge to see the full State ranking.Click here to see the full State ranking.
Quality Measures Info Based on clinical and physical health indicators reported to CMS, such as hospital readmissions, falls, pressure ulcers, and improvements in mobility. These measures reflect how well residents' health needs are being managed.
▼ 35.3% Below KS avg. ▼ 35.3% Below KS avg.KS average: 3.1Click the badge to see the full State ranking.Click here to see the full State ranking.

Staffing hours breakdown

Info Daily nursing hours per resident by staff type, reported to CMS. Higher is generally better — compare this facility to state and national averages to see where staffing stands.

Hours per resident per day — compared to Kansas state averages

Total nursing care / resident Info Total adjusted nursing hours per resident per day, combining RN, LPN, and aide time. CMS adjusts this for case-mix so facilities can be fairly compared.
4h 15m per day
This facility Kansas avg (4h 38m per day)
vs Kansas avg
-8%

6 of 6 metrics below state avg

Staff typeHours / Day / Residentvs state avg
Registered Nurse (RN) Info RNs hold the highest nursing license and can assess residents, interpret test results, and direct care plans. More RN hours per day often signals stronger clinical oversight and faster response to health changes. 36m per day ▼ 15% State avg: 43m per day · National avg: 41m per day
LPN / LVN Info Licensed Practical Nurses (LPNs) or Licensed Vocational Nurses (LVNs) deliver routine hands-on care — medication administration, wound dressing, and monitoring vital signs. They work under RN supervision and make up a large share of daily bedside care. 29m per day ▼ 27% State avg: 40m per day · National avg: 52m per day
Nurse Aide Info Certified Nurse Aides (CNAs) provide the most direct day-to-day assistance: bathing, dressing, feeding, and mobility. Nurse aide hours are typically the largest staffing category and directly affect residents' quality of life. 2h 21m per day ▼ 13% State avg: 2h 42m per day · National avg: 2h 21m per day
Weekend Total Nursing Info Combined nursing hours (RN + LPN + Nurse Aide) per resident per day on weekends. Staffing often drops on weekends — this figure reveals whether the facility maintains adequate coverage outside of weekday hours. 2h 47m per day ▼ 22% State avg: 3h 35m per day · National avg: 3h 26m per day
Physical Therapist Info Hours per resident per day provided by licensed Physical Therapists (PTs) or PT Assistants. PT services help residents recover mobility after injury or illness and are especially important for post-acute (short-stay) rehabilitation. 1m per day ▼ 41% State avg: 2m per day · National avg: 4m per day
Weekend RN Info Registered nurse hours specifically on weekends. Facilities sometimes reduce RN presence on Saturdays and Sundays — a low weekend RN figure compared to weekday hours can indicate reduced clinical oversight when most administrative staff are absent. 19m per day ▼ 34% State avg: 29m per day · National avg: 29m per day

Capacity and availability

This home usually has availability

Lower occupancy than the Kansas average: 79.5%
Occupancy rate
75.4%
Avg. Length of Stay
102 days
Bed community size
65-bed community Rank #88 / 224Bed count — State benchmarkedThis home is ranked 88th out of 224 homes in Kansas. Shows this facility's certified or reported bed count compared to other Kansas facilities. Larger communities may offer more amenities, programs, and on-site services for residents and families.Ranking totals vary by category as each rank only includes facilities that report data for that metric. Homes missing that data point aren't included in the ranking.Click the rank badge to see the full State ranking.Click here to see the full State ranking.
A moderately sized community that may balance personal attention with shared amenities and social activities.
Walk Score
Walk Score: 59 / 100 Rank #104 / 363Walk Score — State benchmarkedThis home is ranked 104th out of 363 homes in Kansas. Shows how walkable this facility's neighborhood is compared to the average Walk Score across Kansas facilities. Higher scores benefit residents, families, and staff.Ranking totals vary by category as each rank only includes facilities that report data for that metric. Homes missing that data point aren't included in the ranking.Click the rank badge to see the full State ranking.Click here to see the full State ranking.
Moderately walkable. Some errands can be accomplished on foot, with a mix of nearby amenities.

About this community

Contact Good Samaritan Society – Hutchinson Village

Staffing Data

Reporting period: October 1 – December 31, 2025 (Q4 2025). Source: CMS Payroll-Based Journal report.

Total staff 67
Employees 62
Contractors 5
Staff to resident ratio 1.26 : 1
44% fewer staff per resident than Kansas average
Kansas average ratio: 2.24 : 1 Kansas average ratio: 2.24 : 1See full Kansas ranking
Avg staff/day 28
Average shift 7.5 hours
0% compared with Kansas average
Kansas average: 7.7 hours Kansas average shift: 7.7 hoursSee full Kansas ranking
Total staff hours (quarter) 19,299

Nursing staff breakdown

Q4 2025 · Oct 1 – Dec 31 More info This data comes from the CMS Payroll-Based Journal report covering October 1 – December 31, 2025.
Registered Nurse

Manages medical care and health needs.

RN Staff Info All 3 RN Staff are full-time employees. No contractors work on this role. 3
Average shift length Info Average shift length. Calculated as total hours divided by days worked and average staff per day. 8.3 hours
Licensed Practical Nurse

Assists with medical care and medications.

LPN Staff Info All 5 LPN Staff are full-time employees. No contractors work on this role. 5
Average shift length Info Average shift length. Calculated as total hours divided by days worked and average staff per day. 10.6 hours
Certified Nursing Assistant

Helps with daily care and mobility.

CNA Staff Info All 25 CNA Staff are full-time employees. No contractors work on this role. 25
Average shift length Info Average shift length. Calculated as total hours divided by days worked and average staff per day. 7 hours

Contractor staffing

Q4 2025 · Oct 1 – Dec 31 More info This data comes from the CMS Payroll-Based Journal report covering October 1 – December 31, 2025.

Total hours from contractors

0.4%

70 contractor hours this quarter

Occupational Therapy Assistant: 2 Administrator: 1 Medical Director: 1 Occupational Therapy Aide: 1

Staff by category

Q4 2025 · Oct 1 – Dec 31 More info This data comes from the CMS Payroll-Based Journal report covering October 1 – December 31, 2025.
Certified Nursing Assistant250256,86592100%7
Medication Aide/Technician140144,76892100%7.6
Licensed Practical Nurse5052,41592100%10.6
Registered Nurse3031,5439199%8.3
Clinical Nurse Specialist3039477480%6.9
Physical Therapy Aide1015296470%8.3
Nurse Practitioner1015286672%8
Dental Services Staff1014955964%8.4
Administrator2134775964%7.7
Dietitian1014636874%6.8
Respiratory Therapy Technician202992123%3.9
Qualified Social Worker101883841%2.3
Occupational Therapy Aide01136910%4
Medical Director0111533%5.1
Mental Health Service Worker1011333%4.2
Occupational Therapy Assistant022111112%1
Physical Therapy Assistant20281112%0.7
25 Certified Nursing Assistant
% of Days 100%
14 Medication Aide/Technician
% of Days 100%
5 Licensed Practical Nurse
% of Days 100%
3 Registered Nurse
% of Days 99%
3 Clinical Nurse Specialist
% of Days 80%
1 Physical Therapy Aide
% of Days 70%
1 Nurse Practitioner
% of Days 72%
1 Dental Services Staff
% of Days 64%
3 Administrator
% of Days 64%
1 Dietitian
% of Days 74%
2 Respiratory Therapy Technician
% of Days 23%
1 Qualified Social Worker
% of Days 41%
1 Occupational Therapy Aide
% of Days 10%
1 Medical Director
% of Days 3%
1 Mental Health Service Worker
% of Days 3%
2 Occupational Therapy Assistant
% of Days 12%
2 Physical Therapy Assistant
% of Days 12%

Penalties and fines

Includes penalties issued in 2023

Federal penalties imposed by CMS for regulatory violations, including civil money penalties (fines) and denials of payment for new Medicare/Medicaid admissions.

Source: CMS Penalties Database (Data as of Jan 2026)

Total fines amount $9K
80% lower than Kansas average

Kansas average: $44K

Number of fines 1
59% fewer fines than Kansas average

Kansas average: 2.4

Payment Denials Info Serious action where Medicare and/or Medicaid temporarily stops payments for new residents until issues are fixed. 0
100% fewer payment denials than Kansas average

Kansas average: 0.3

Fines amount comparison
This facility $9K
Kansas average $44K
Penalty History

Penalties are imposed by CMS for violations of federal nursing home regulations.

1 penalty in the past 3 years

Aug 15, 2023 · $9K

Civil Money Penalty Info Fines imposed for noncompliance, which can be assessed per day or per instance of violation. Aug 15, 2023
$9K

Last updated: Jan 2026

Quality of care over time

These measures show how residents usually do over time at this home, based on health outcomes and preventive care.

High-risk clinical events score Info A composite score based on pressure ulcers, falls with injury, weight loss, walking ability decline, and activities of daily living decline. 10.5
In line with Kansas average

Kansas average: 10.5

Functional decline score Info A composite score based on activities of daily living decline, walking ability decline, and incontinence. 24.2
17% worse than Kansas average

Kansas average: 20.7

Long-stay resident measures
Below average Kansas avg: 3.0 Info CMS star rating based on long-stay quality measure performance. 5 stars = significantly above average, 1 star = significantly below average.
Need for Help with Daily Activities Increased Info Percent of long-stay residents whose need for help with daily activities has increased 19.6%
In line with Kansas average

Kansas average: 19.0%

Walking Ability Worsened Info Percent of long-stay residents whose ability to move independently worsened 20.5%
6% worse than Kansas average

Kansas average: 19.4%

Low Risk Residents with Bowel/Bladder Incontinence Info Percent of low risk long-stay residents who lose control of their bowels or bladder 32.6%
37% worse than Kansas average

Kansas average: 23.8%

Falls with Major Injury Info Percent of long-stay residents experiencing one or more falls with major injury 5.1%
16% worse than Kansas average

Kansas average: 4.4%

High Risk Residents with Pressure Ulcers Info Percent of long-stay high risk residents with pressure ulcers 2.7%
42% better than Kansas average

Kansas average: 4.6%

Urinary Tract Infection Info Percent of long-stay residents with a urinary tract infection 0.6%
81% better than Kansas average

Kansas average: 3.1%

Lost Too Much Weight Info Percent of long-stay residents who lose too much weight 4.6%
10% better than Kansas average

Kansas average: 5.1%

Depressive Symptoms Info Percent of long-stay residents who have depressive symptoms 0.0%
100% better than Kansas average

Kansas average: 5.2%

Antipsychotic Use Info Percent of long-stay residents who received an antipsychotic medication 15.3%
10% better than Kansas average

Kansas average: 16.9%

Pneumococcal Vaccine Info Percent of long-stay residents assessed and appropriately given the pneumococcal vaccine 98.3%
7% better than Kansas average

Kansas average: 91.9%

Influenza Vaccine Info Percent of long-stay residents assessed and appropriately given the seasonal influenza vaccine 97.8%
In line with Kansas average

Kansas average: 95.5%

Hospitalizations per 1,000 days Info Number of hospitalizations per 1,000 long-stay resident days. 3.41
85% worse than Kansas average

Kansas average: 1.84

ED visits per 1,000 days Info Number of outpatient emergency department visits per 1,000 long-stay resident days. 1.53
29% better than Kansas average

Kansas average: 2.16

Short-stay resident measures
Significantly below average Kansas avg: 2.6 Info CMS star rating based on short-stay quality measure performance. 5 stars = much above average, 1 star = much below average.
Pneumococcal Vaccine Info Percent of short-stay residents assessed and appropriately given the pneumococcal vaccine 75.3%
In line with Kansas average

Kansas average: 75.6%

Antipsychotic medication increase Info Percent of short-stay residents who newly received an antipsychotic medication 5.2%
140% worse than Kansas average

Kansas average: 2.2%

Influenza Vaccine Info Percent of short-stay residents assessed and appropriately given the seasonal influenza vaccine 84.1%
14% better than Kansas average

Kansas average: 73.5%

Re-hospitalized after SNF stay Info Percentage of short-stay residents who were re-hospitalized after their nursing home admission. 23.9%
In line with Kansas average

Kansas average: 23.0%

Emergency department visits Info Percentage of short-stay residents who had an outpatient emergency department visit. 12.3%
5% worse than Kansas average

Kansas average: 11.7%

Falls with major injury Info Percentage of SNF residents who experience falls with major injury during their stay. 8.7%
1030% worse than Kansas average

Kansas average: 0.8%

Ability to care for self at discharge Info Percentage of residents at or above expected ability to care for themselves at discharge. 43.2%
19% worse than Kansas average

Kansas average: 53.7%

Successful return to home or community Info Rate of successful return to home or community from a skilled nursing facility. 45.7%
10% worse than Kansas average

Kansas average: 50.6%

Breakdown by payment type

Medicare

26% of new residents, usually for short-term rehab.

Typical stay 26 days

Private pay

40% of new residents, often for short stays.

Typical stay 3 - 4 months

Medicaid

34% of new residents, often for long-term daily care.

Typical stay 6 - 7 months

Facility Characteristics

Source: CMS Long-Term Care Facility Characteristics (Data as of Jan 2026)

Total residents 53
Medicare
9
17% of residents
Medicaid
35
66% of residents
Private pay or other
9
17% of residents
Programs & Services
Residents Group

Residents meet regularly to discuss policies, care quality, and activities

Active Resident Council

Organized group of residents that meets regularly to discuss facility policies, quality of life, and activities.

Finances and operations

Based on CMS SNF Cost Report for fiscal year ending in 12/2023.

Governmental community
Operated by a subsidized facility district.
Net patient revenue Info Net patient revenue — what the home actually collects for resident care, after contractual allowances, bad debt and discounts are subtracted from its gross charges (CMS cost report, Worksheet G-3). It covers resident care only; money the home earns from other sources is shown separately as "Other income."
$6.6M
Net patient income Info Net patient income: net patient revenue minus the home's total operating expenses. A positive figure means it earns more from resident care than it spends to deliver it; a negative figure means the opposite. It excludes non-operating "other income."
-$325.3K
Governmental community Operated by a subsidized facility district.
Net patient revenue Info Net patient revenue — what the home actually collects for resident care, after contractual allowances, bad debt and discounts are subtracted from its gross charges (CMS cost report, Worksheet G-3). It covers resident care only; money the home earns from other sources is shown separately as "Other income."
$6.6M
Net patient income Info Net patient income: net patient revenue minus the home's total operating expenses. A positive figure means it earns more from resident care than it spends to deliver it; a negative figure means the opposite. It excludes non-operating "other income."
-$325.3K
Other income Info Money the home earns outside of resident care — such as investments, grants, rentals and other non-operating sources (CMS cost report, Worksheet G-3). It is tracked separately from net patient revenue: it is not part of that figure, and it is not included in net patient income.
$886.2K
Payroll costs Info Staff salaries plus wage-related costs — benefits such as payroll taxes, health insurance and retirement — from the home's own accounting records (CMS cost report, Worksheet A). Contract or agency labor is counted separately, under other operating costs.
$3.6M 54.8% of net patient revenue Info Payroll as a share of revenue: staff salaries and wage-related benefits divided by net patient revenue. A higher figure means more of each revenue dollar goes to staff pay.
Other operating costs Info Everything it costs to run the home apart from payroll — food, utilities, supplies, maintenance, contract labor and administration. Calculated as total operating expense minus payroll (staff salaries and wage-related benefits).
$3.3M
Total costs Info The home's total operating expense for the year — all the costs of running it, salaries included (CMS cost report, Worksheet G-3).
$6.9M

Who this home usually serves

TYPE OF STAY

Mix of rehab and long-term care

This home supports both short-term rehab and long-term care, with residents staying for a wide range of durations.

New residents most often arrive under private pay (40% of admissions), and a typical private pay stay runs around 3 - 4 months.

Admissions
194 total

Coverage residents most often arrive under.

Medicare 26%
Private pay 40%
Medicaid 34%
Discharges
202 total

Coverage residents most often leave under.

Medicare 19%
Private pay 41%
Medicaid 41%

Places of interest near Good Samaritan Society – Hutchinson Village

Address 2.0 miles from city center Info Estimated distance in miles from Hutchinson's city center to Good Samaritan Society – Hutchinson Village's address, calculated via Google Maps. — 1.04 miles to nearest hospital (The Little Clinic)

Calculate Travel Distance to Good Samaritan Society – Hutchinson Village

Add your location

Address

Compare Nursing Home around Hutchinson

The information below is reported by the Kansas Department for Aging and Disability Services.

3 facilities compared · CMS & KS Dept. of Health data

Good Samaritan Society – Hutchinson Village
NH
AL
IL
RC
Hutchinson
65
Facility 65
KS AVG 69
Rank #88 / 224
75.4% -5%4.25 -56%-8%$8.6k256.3254-
59
Facility 59
KS AVG 46
Rank #104 / 363
Courtney Bailey$6.6M$3.6M54.8%175260
Diversicare of Hutchinson, LLC
NH
HC
MC
Hutchinson
73
Facility 73
KS AVG 69
Rank #75 / 224
87.7% +10%3.75 -26%-19%$8.4k276.8167-
80
Facility 80
KS AVG 46
Rank #18 / 363
Diversicare Kansas LLC$6.9M$3.0M43.1%175114
Waldron Place Senior Living
NH
AL
HC
MC
RC
Hutchinson
60
Facility 60
KS AVG 69
Rank #94 / 224
58.1% -27%5.77 -41%+25%$0175.7-33-
32
Facility 32
KS AVG 46
Rank #252 / 363
Kimberle Doty$3.3M$2.0M61.3%175559

Financial Assistance for
Nursing Home in Kansas

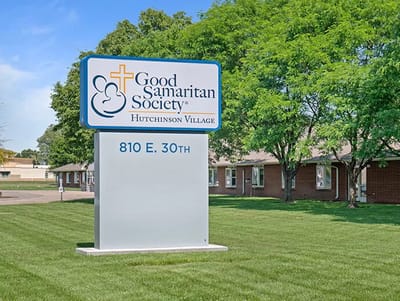
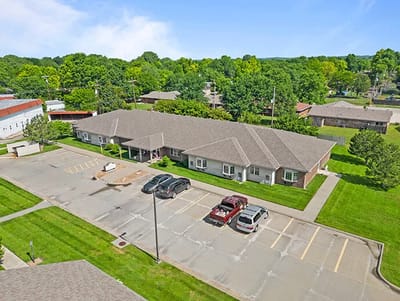
Good Samaritan Society – Hutchinson Village is located in Hutchinson, Kansas.
Here are the financial assistance programs available to residents in Kansas.

Get Financial aid guidance

Frail Elderly Waiver

Kansas Medicaid FE Waiver

Age 65+
General Kansas resident, Medicaid-eligible, nursing home- level care need.
Income Limits (2025) ~$2,829/month 300% FBR, individual
Asset Limits $2,000 (individual), $3,000 (couple).
KS

Requires care level assessment.

Benefits
Personal care (5-7 hours/day) Respite (240 hours/year) Adult day care (~$60/day) Home aides

Senior Care Act

Kansas SCA

Age 60+
General Kansas resident, at risk of nursing home.
Income Limits ~$1,800/month individual, varies
Asset Limits $2,000 individual
KS

Limited funding; waitlists common.

Benefits
In-home care (3-5 hours/week) Respite (up to 10 days/year) Homemaker services

Medicare Savings Program (MSP)

Kansas Medicare Savings Program

Age 65+ or disabled
General Kansas resident, Medicare Part A/B.
Income Limits (2025) ~$2,510/month (QMB), ~$3,380/month (SLMB), ~$3,598/month (QI)—individual.
Asset Limits $9,430 (individual), $14,130 (couple).
KS

Three tiers; no waitlist.

Benefits
Covers Part B premiums ($174.70/month) Deductibles ($240/year) Copays (~20%)

National Family Caregiver Support Program (NFCSP) Respite

Kansas NFCSP Respite Care

Age
General Caregivers of 60+ needing care or 55+ caregivers of others; Kansas resident; functional needs (2+ ADLs).
Income Limits (2025) Prioritizes ~$24,980/year (individual); no strict cap.
Asset Limits Not assessed; need-based.
KS

11 AAAs; prioritizes low-income, rural caregivers.

Benefits
Respite (4-6 hours/week or 5 days/year) Adult day care ($60/day) Caregiver training

VA Aid and Attendance (A&A) and Housebound Benefits

Kansas VA Aid and Attendance/Housebound

Age 65+ or disabled veteran/spouse
General Kansas resident, wartime service, need for ADL help (A&A) or homebound.
Income Limits (2025) Net income < ~$1,984/month (veteran with dependent, A&A); pension offsets income.
Asset Limits ~$155,356 net worth limit
KS

High veteran demand in rural/urban areas.

Benefits
Cash (~$1,433-$2,642/month veteran, ~$951-$1,318 spouse) for care costs (e.g., in-home, assisted living)

Frequently Asked Questions about Good Samaritan Society – Hutchinson Village

Is Good Samaritan Society – Hutchinson Village in a walkable area?

Good Samaritan Society – Hutchinson Village has a walk score of 59. Moderately walkable. Some errands can be accomplished on foot, with a mix of nearby amenities.

What is the occupancy rate at Good Samaritan Society – Hutchinson Village?

Good Samaritan Society – Hutchinson Village's occupancy is 75.4%.

Are there photos of Good Samaritan Society – Hutchinson Village?

Yes — there are 5 photos of Good Samaritan Society – Hutchinson Village in the photo gallery on this page.

What is the phone number of Good Samaritan Society – Hutchinson Village?

(620) 888-7287 will put you in contact with the team at Good Samaritan Society – Hutchinson Village.

Is Good Samaritan Society – Hutchinson Village Medicare or Medicaid certified?

Yes — Good Samaritan Society – Hutchinson Village is a CMS-certified provider of Medicare and Medicaid.

Guides for Better Senior Living

Care Cost Calculator: See Prices in Your Area

Nursing Home Data Explorer

Don’t Wait Too Long: 7 Red Flag Signs Your Parent Needs Assisted Living Now

The True Cost of Assisted Living in 2025 – And How Families Are Paying For It

Understanding Senior Living Costs: Pricing Models, Discounts & Financial Assistance