Explore Open Rooms

1 Contact details
2 What type of senior care service are you looking for?
3 What budget do you have in mind for senior care?
4 How soon do you need to find care?
5 Additional details

Thank you for your interest!

Our team will be in touch shortly to help with next steps.

Senior Living Home

Good Samaritan Society – Loveland Village

Senior Living Home

Good Samaritan Society – Loveland Village

2101 S Garfield Ave, Loveland, CO 80537 View map
Overview of Good Samaritan Society – Loveland Village

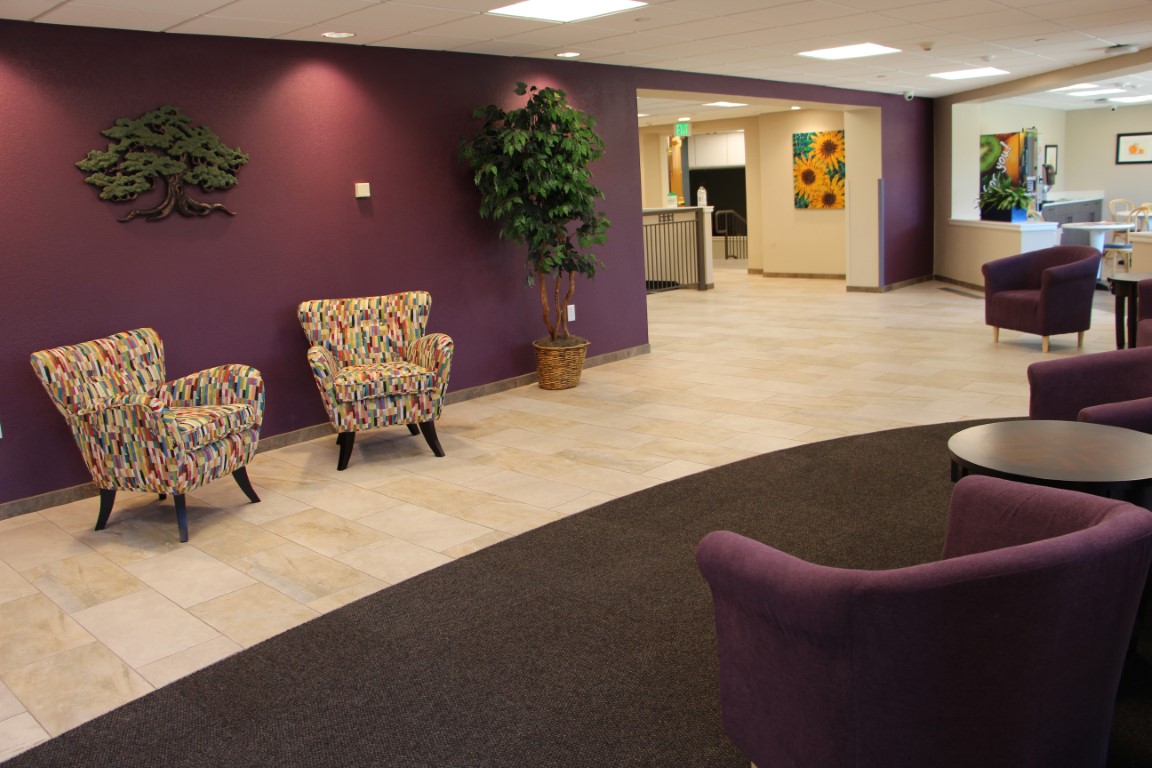
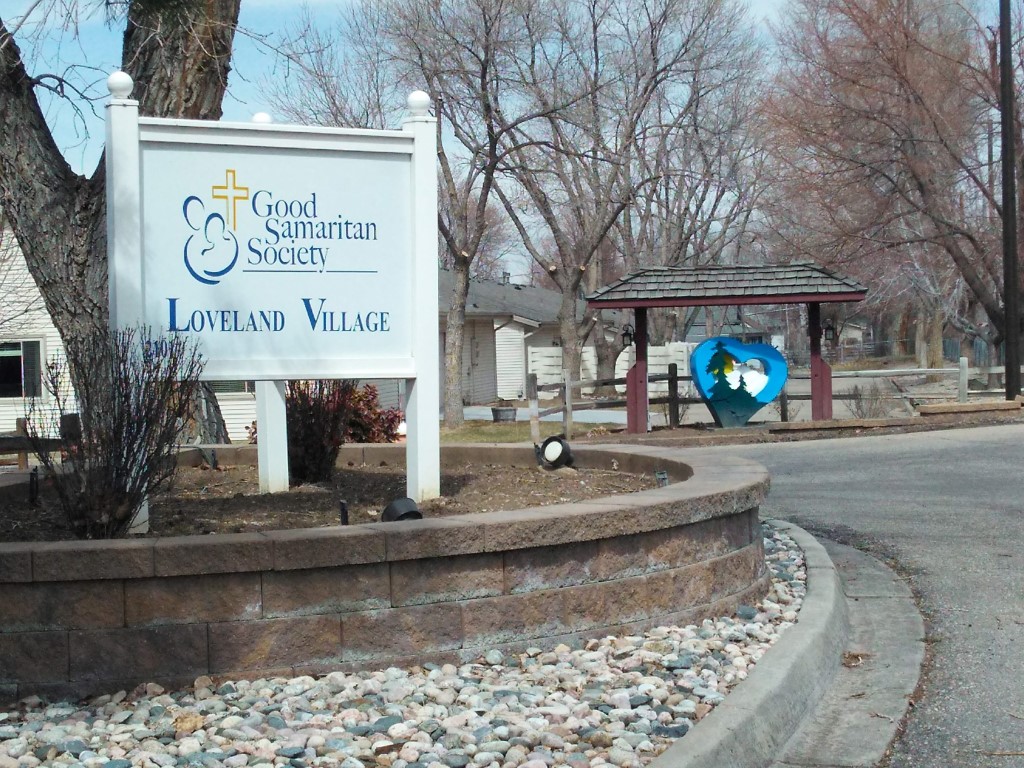
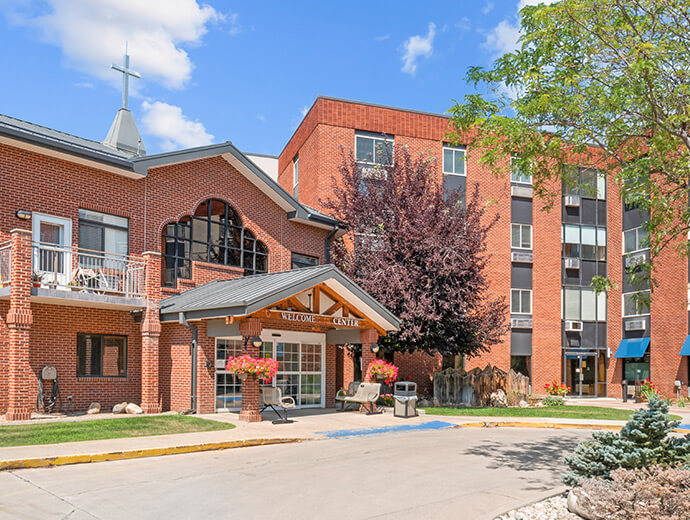
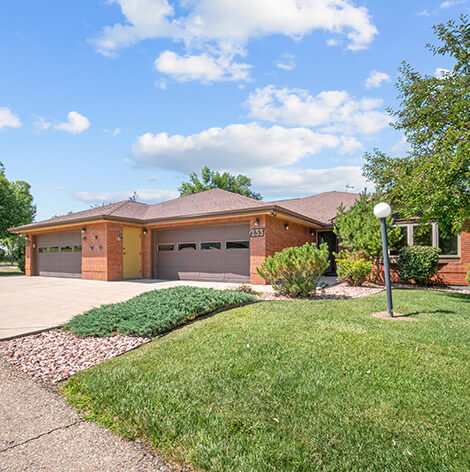
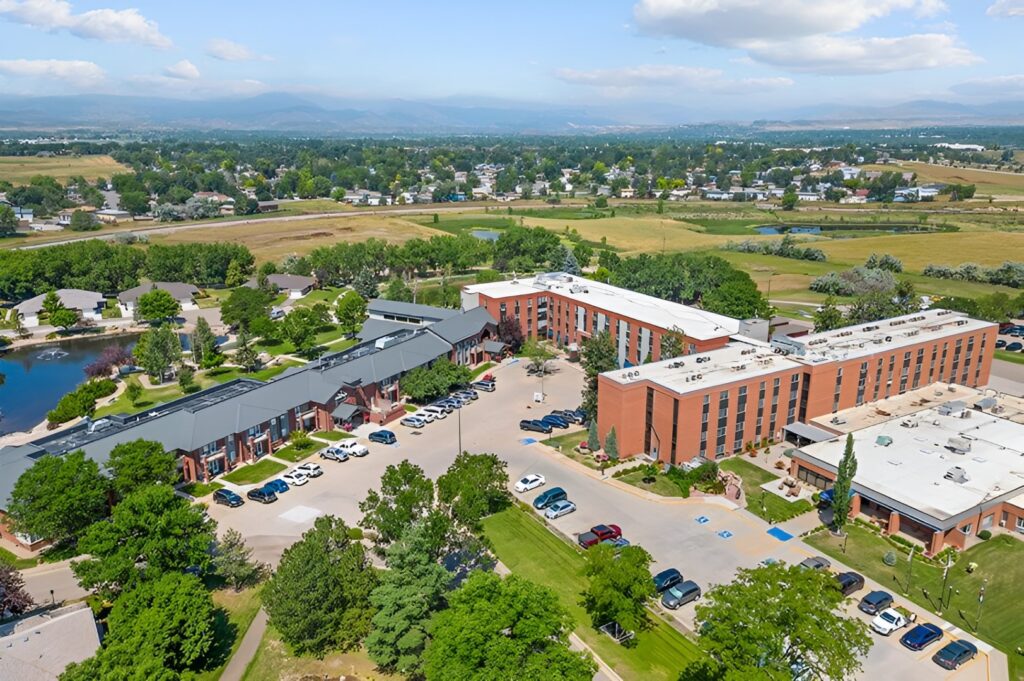
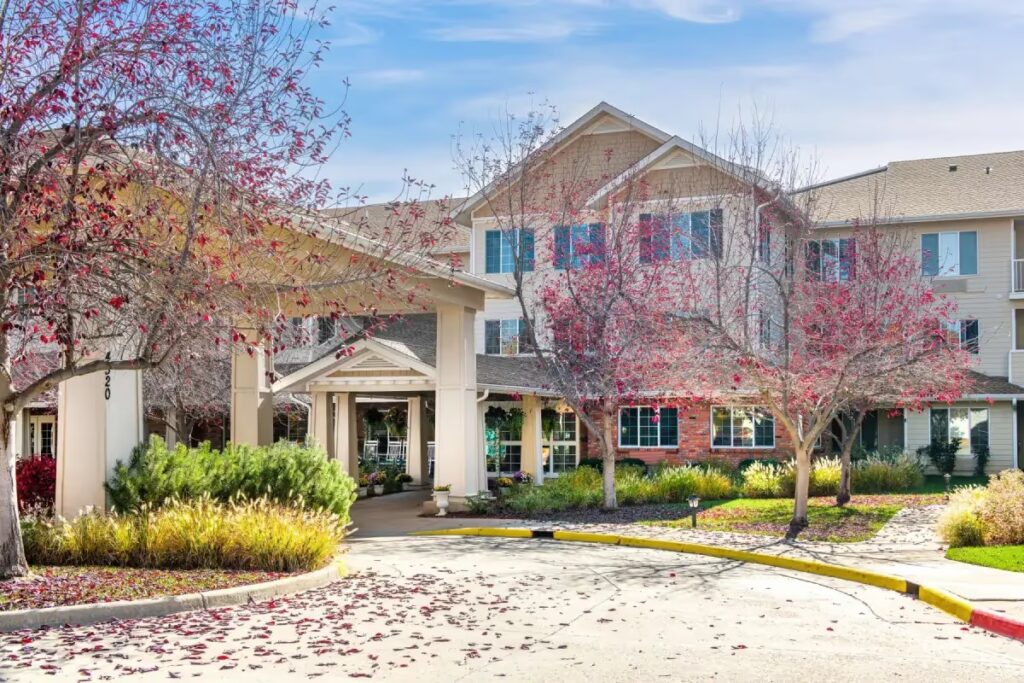
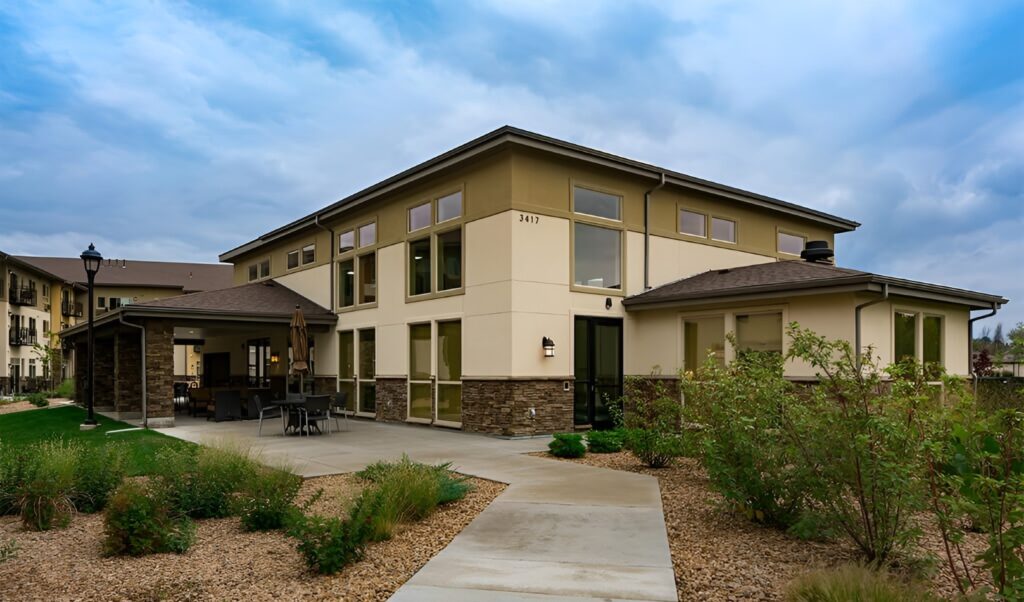
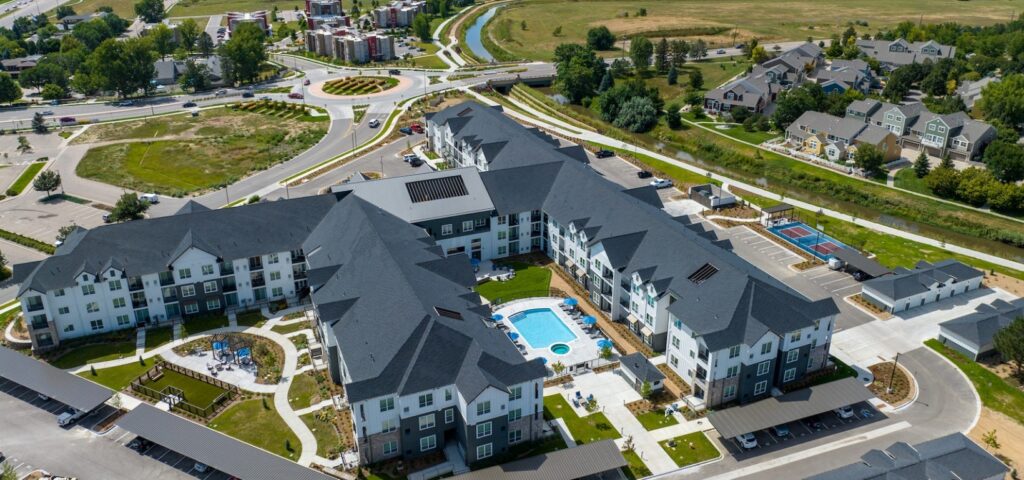
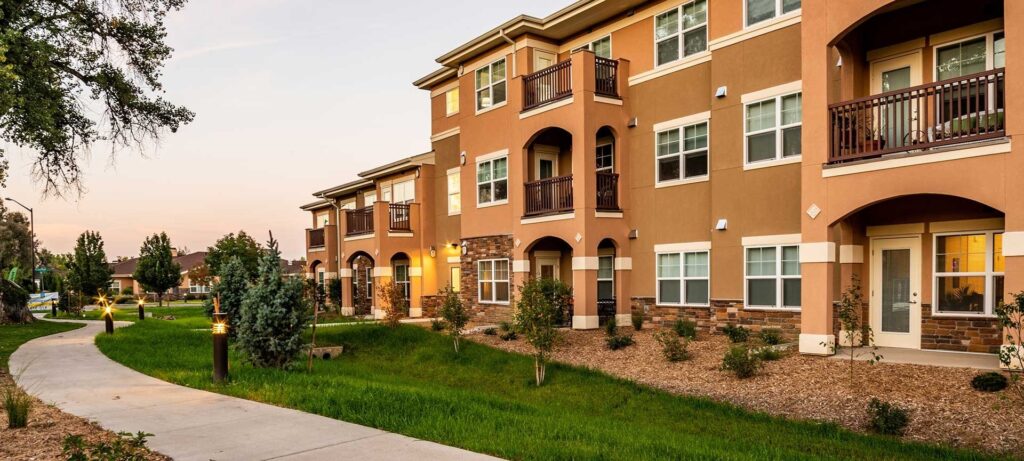
Spend your golden years at Good Samaritan Society – Loveland Village, a trusted 55+ community in Loveland, CO, offering independent living, assisted living, and skilled nursing. Alongside purposely built and spacious one- and two-bedroom floor plans, exceptional care is also provided, to ensure residents’ comfort and safety. With a compassionate and well-trained team available 24/7, residents can keep their peace of mind and live a worry-free lifestyle.

Residents are encouraged to participate in fun activities and enriching programs with a jam-packed calendar of exciting events and stimulating programs. Delightful and healthy meals are also served to satisfy residents’ dietary needs and preferences. Respite care and transportation services are also provided for residents’ convenience. The community is ideal for those needing support to live comfortably in retirement, especially with its comprehensive services and state-of-the-art amenities.

(970) 837-8646

Quality ratings

Measured by Centers for Medicare & Medicaid Services (CMS)

Overall rating Info The Overall CMS Rating combines results from health inspections, staffing levels and quality measures. Health inspections carry the most weight. Staffing and quality scores can increase or decrease the final rating based on performance compared to state and national standards.
4/5
Colorado average: 3.2/5
Health Inspection Info Based on the results of the facility's three most recent standard inspections and any complaint investigations. CMS reviews the number, scope, and severity of deficiencies, with more recent findings weighted more heavily.
4/5
Colorado average: 2.8/5
Staffing Info Measures average nursing staff hours per resident per day, including Registered Nurses (RNs) and total nursing staff. Ratings are adjusted based on the level of care residents require and are compared to state and national benchmarks.
4/5
Colorado average: 3.1/5
Quality Measures Info Based on clinical and physical health indicators reported to CMS, such as hospital readmissions, falls, pressure ulcers, and improvements in mobility. These measures reflect how well residents' health needs are being managed.
3/5
Colorado average: 4.1/5

Nursing care per resident

Info This shows how many total hours of nursing staff time are available per resident each day. Higher numbers usually mean more staff support.
3h 40m per day

This home provides 5% less nursing time per resident than the Colorado average.

Colorado average: 3h 51m per day

Capacity and availability

Medium-capacity home

Offers a balance of services and community atmosphere.

Total beds 104

This home usually has limited availability

Occupancy is moderate, suggesting balanced demand.

Similar demand to the Colorado average
Occupancy rate 87.3%
Residents per day (avg) 97
Occupancy rate
87.3%
Residents per day (avg)
97

Who this home usually serves

TYPE OF STAY

Mix of rehab and long-term care

This home supports both short-term rehab and long-term care, with residents staying for a wide range of durations.

Breakdown by payment type

Medicare

20% of new residents, usually for short-term rehab.

Typical stay 24 days

Private pay

56% of new residents, often for short stays.

Typical stay 5 - 6 months

Medicaid

24% of new residents, often for long-term daily care.

Typical stay 5 - 6 months

Finances and operations

Voluntary non-profit community
Operated by a church.
Home revenue
$26.1M
Surplus of revenue
$1.5M
Voluntary non-profit community Operated by a church.
Home revenue
$26,115,650.00
Surplus of revenue
$1,547,434.00
Payroll costs Info The portion of the home's budget spent on staff, including nurses, caregivers, and other employees who support care and operations.
$9.7M
37.3% of revenue
Other operating costs Info All remaining costs needed to run the home, such as food, utilities, building maintenance, supplies and administrative expenses.
$14.7M
Total costs $24.4M
Bed community size
104-bed community
A larger shared setting that may offer more common spaces and organized community services.
Walk Score
Walk Score: 7 / 100
Car-dependent. Most errands require a car, with limited nearby walkable options.

About this community

License details

Status Active

Additional licensing details

CMS Certification Number: 65139

Ownership & operating entity

Good Samaritan Society – Loveland Village is administrated by Lehto, Tammi Lynn.

Owner: THE EVANGELICAL LUTHERAN GOOD SAMARITAN SOCIETY

Safety & Compliance

Wheelchair Accessible
Emergency Systems: Yes
Safety Features: Emergency Response System

Care Services

Accepts Medicare
Nursing Services
Rehabilitation Services
Respite Care
Independent Living
Skilled Nursing
24-Hour Staffing

Additional Policies & Features

Minimum Age: 55
Housekeeping: Yes
Linen Service: Yes
Utilities Included: Yes

Amenities & Lifestyle

Dining Room
Guest Housing
Salon
Swimming Pool
Wellness Center
Whirlpool
Chapel
Community Room
Library
Pet Park

Programs & Activities

Activities
February activities calendar available.
Specific Programs
Assisted Living, Independent Living, Rehabilitation Therapy, Home-based Services, Long-Term Care, Caregiver Support
Religious Services
Yes

Pricing & Financial Information

Starting Price$5,023/mo

Dining & Nutrition

Food Description
Dining services include three daily meals with menu selection and refreshments offered 24 hours/day.
Meals Included
Yes
Meals Per Day
3
Special Diets
Yes

What does this home offer?

Minimum age icon
Minimum age icon

Minimum Age: 55 Years Old

Pets allowed icon
Pets allowed icon

Pets Allowed: Yes, Pets Allowed

Room sizes icon
Room sizes icon

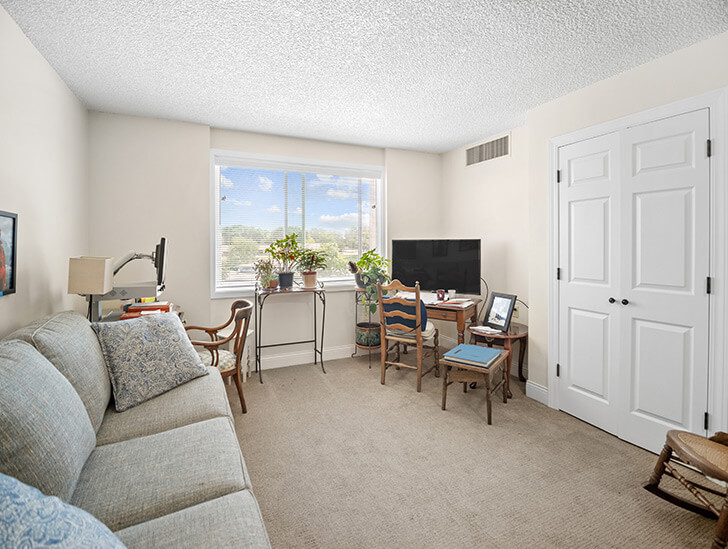
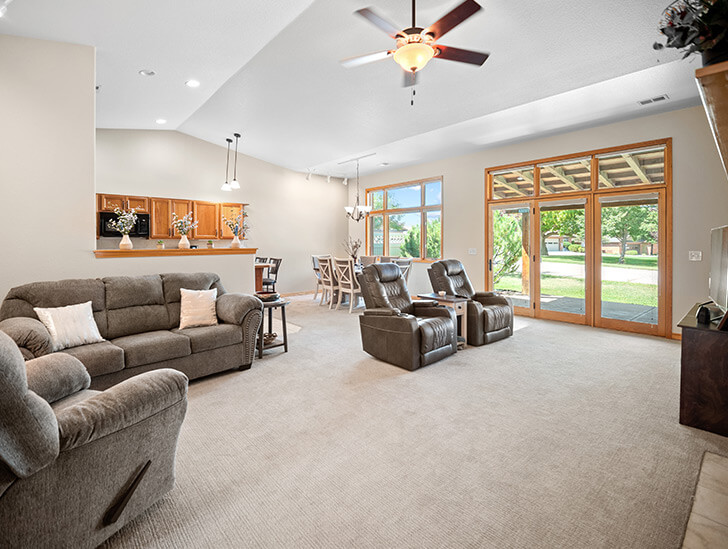
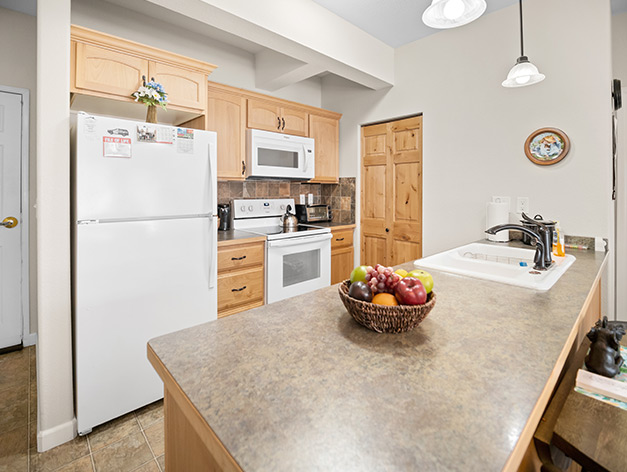
Room Sizes: 440 - 580 sq. ft

Housing options icon

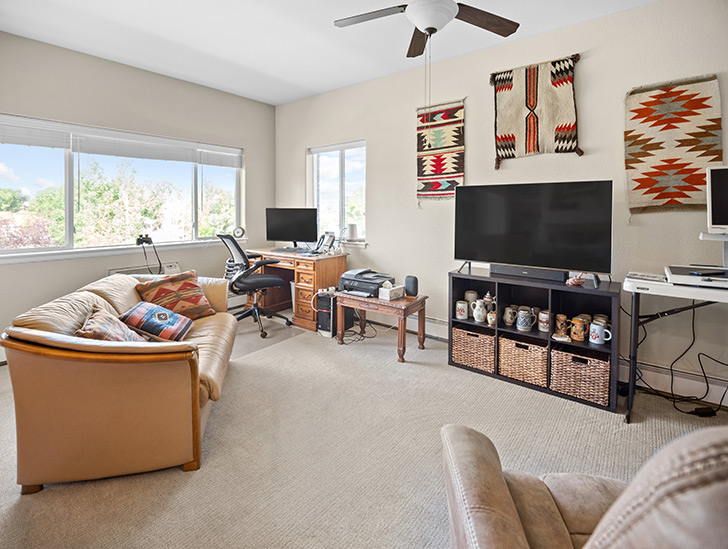
Housing Options: 1 Bed / 2 Bed

Building type icon
Building type icon

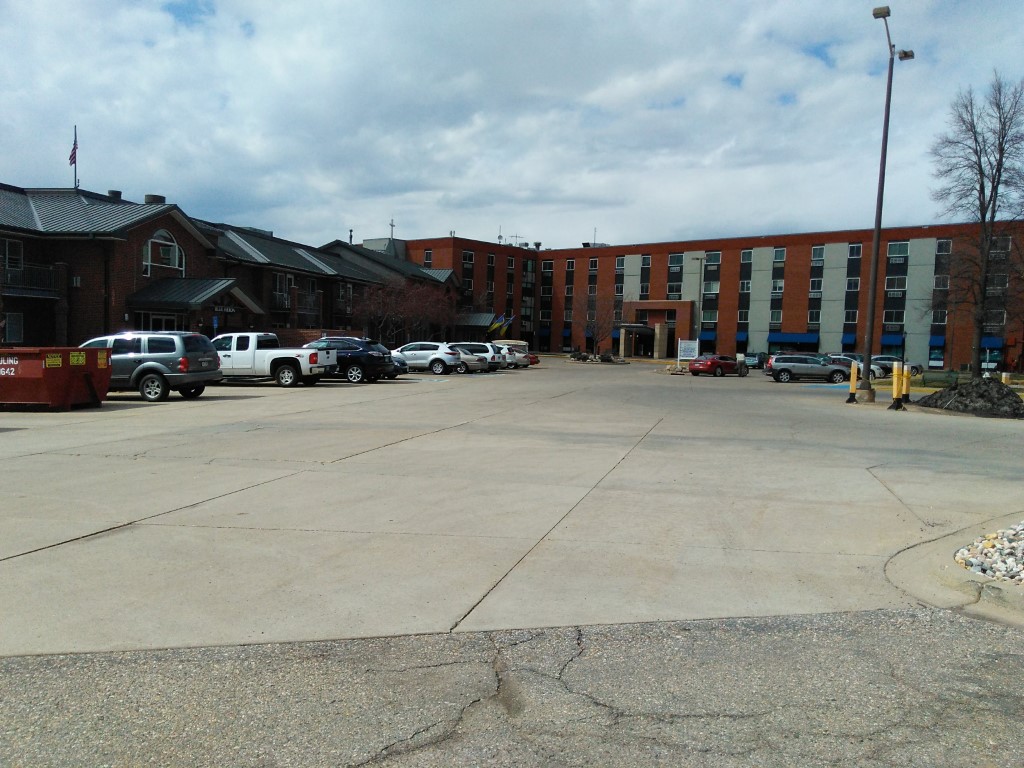
Building Type: Mid-rise

Dining services icon

Dining Services

Beauty services icon

Beauty Services

Transportation services icon

Transportation Services

Housekeeping icon
Housekeeping icon

Housekeeping Services

Social and recreational activities icon

Social and Recreational Activities

Exercise program icon

Exercise Programs

Swimming pool icon
Swimming pool icon

Swimming Pool

Types of Care at Good Samaritan Society – Loveland Village

Independent Living Assisted Living
Contact Good Samaritan Society – Loveland Village

Access & Eligibility

Ways to qualify for care at this community, including accepted programs and payment options.

Medicaid Accepted

This facility is certified for eligible Medicaid services.

Medicare Accepted

This facility is certified for eligible Medicare services.

Payment & Funding Options

Private pay Medicaid Medicare Long-term care insurance

Health Inspection History

Inspections
Total health inspections 5

Colorado average 4.8


Last Health inspection on Feb 2025

Total health citations 14

Colorado average 24.8

Citations per inspection
2.8

Colorado average 5.2


Health citations are formal notices following inspections when they fail to comply with safety and care standards.

11 of 14 citations resulted from standard inspections; 2 of 14 resulted from complaint investigations; and 1 of 14 came from combined inspections (standard and complaint).

Breakdown of citation severity (last 3 years)
Critical Health citations More info 1
150% worse than Colorado average

Colorado average: 0.4


Serious Health citations More info 4
90% worse than Colorado average

Colorado average: 2.1

1 critical citation More info Colorado average: 0.4

4 serious citations More info Colorado average: 2.1

9 moderate citations More info Colorado average: 22.2

0 minor citations More info Colorado average: 0.2
Citations history (last 3 years)
Quality of Care serious citation Info Issues related to how well residents receive appropriate treatment and support for their medical and daily care needs. Feb 26, 2025
Corrected

Abuse/Neglect critical citation Info Issues related to protecting resident's from harm, including abuse, neglect, or mistreatment. Oct 22, 2024
Corrected

Pharmacy moderate citation Info Issues related to medication management, including how drugs are stored, administered, and monitored. May 07, 2024
Corrected

Quality of Care serious citation Info Issues related to how well residents receive appropriate treatment and support for their medical and daily care needs. May 07, 2024
Corrected

Compare Senior Living around Loveland The information below is reported by the Colorado Department of Public Health and Environment, Health Facilities Division.

Good Samaritan Society – Loveland Village
NH

Nursing Home Licensed facility providing 24/7 skilled nursing care for residents with complex, ongoing medical needs. Staffed by RNs, LPNs, and CNAs. Inspected and star-rated annually by CMS. Accepts Medicare (short-term rehab) and Medicaid (long-term care).

AL

Assisted Living A licensed, long-term care setting for seniors or individuals with disabilities who need help with daily activities — like bathing, dressing, and medication management — but not 24-hour skilled nursing. Offers housing, meals, and around-the-clock support while aiming to maximize resident independence.

IL

Independent Living Lifestyle-focused communities for older adults offering dining, activities, and transportation with minimal personal care. Best for active, independent seniors who want community without medical support.

Loveland
155
Yes
-
7
1 Bed / 2 Bed
Sugar Valley Estates | Sky Active Living
IL

Independent Living Lifestyle-focused communities for older adults offering dining, activities, and transportation with minimal personal care. Best for active, independent seniors who want community without medical support.

Loveland
-
No
-
16
Studio / 1 Bed / 2 Bed
Affinity at Loveland
IL

Independent Living Lifestyle-focused communities for older adults offering dining, activities, and transportation with minimal personal care. Best for active, independent seniors who want community without medical support.

Loveland
-
Yes
-
57
Studio / 1 Bed / 2 Bed
Avenida at Centerra
IL

Independent Living Lifestyle-focused communities for older adults offering dining, activities, and transportation with minimal personal care. Best for active, independent seniors who want community without medical support.

Loveland (Centerra)
-
Yes
-
35
1 Bed / 2 Bed
Mirasol Senior Community
IL

Independent Living Lifestyle-focused communities for older adults offering dining, activities, and transportation with minimal personal care. Best for active, independent seniors who want community without medical support.

Loveland
-
No
A+
29
1 Bed / 2 Bed

Living Spaces & Floor Plans

1 Bedroom Floor Plan
Download PDF
2 Bedrooms Floor Plan
Download PDF
1-2 Bedrooms Floor Plan
Download PDF
Twin Home Floor Plan
Download PDF

Places of interest near Good Samaritan Society – Loveland Village

Address 2.2 miles from city center

Address 2101 S Garfield Ave, Loveland, CO 80537

Calculate Travel Distance to Good Samaritan Society – Loveland Village

Add your location

Address

Staffing Data (Q2 2025)

This data corresponds to Q2 2025 and is based on CMS Payroll-Based Journal.

Total staff 133
Employees 123
Contractors 10
Staff to resident ratio 1.37:1
28% worse than Colorado average

Colorado average ratio: 1.91:1

Avg staff/day 51
Average shift 7.7 hours
7% worse than Colorado average

Colorado average: 8.3 hours

Total staff hours (quarter) 35,904
Nursing staff breakdown
Registered Nurse

Manages medical care and health needs.

Total count 22
Average shift length Info Average shift length. Calculated as total hours divided by days worked and average staff per day. 9.4 hours

This role is partially covered by contractors.

Licensed Practical Nurse

Assists with medical care and medications.

Total count 12
Average shift length Info Average shift length. Calculated as total hours divided by days worked and average staff per day. 9.1 hours

No contractors work on this role.

Certified Nursing Assistant

Helps with daily care and mobility.

Total count 52
Average shift length Info Average shift length. Calculated as total hours divided by days worked and average staff per day. 8.6 hours

This role is partially covered by contractors.

Contractor staffing

Total hours from contractors

2.5%

893 contractor hours this quarter

Registered Nurse: 3 Occupational Therapy Assistant: 3 Certified Nursing Assistant: 1 Medication Aide/Technician: 1 Occupational Therapy Aide: 1 Medical Director: 1
Staff by category
Certified Nursing Assistant5115215,46891100%8.6
Registered Nurse193226,74691100%9.4
Licensed Practical Nurse120124,82091100%9.1
Mental Health Service Worker3031,1076369%7.7
Clinical Nurse Specialist4041,0248088%6.2
Respiratory Therapy Technician6068466571%4.1
Speech Language Pathologist5058276875%3.4
Physical Therapy Assistant5057586774%4.8
Nurse Practitioner2027046571%8
Administrator2026536571%7.8
Dietitian2026507684%5.6
Medication Aide/Technician1125294549%11.5
Occupational Therapy Aide0114926470%7.7
Qualified Social Worker3034476268%7.1
Other Dietary Services Staff4043034145%6.9
Physical Therapy Aide2022425763%3.2
Nurse Aide in Training2022032123%9.7
Occupational Therapy Assistant033513437%1.4
Medical Director0113578%5
52 Certified Nursing Assistant
% of Days 100%
22 Registered Nurse
% of Days 100%
12 Licensed Practical Nurse
% of Days 100%
3 Mental Health Service Worker
% of Days 69%
4 Clinical Nurse Specialist
% of Days 88%
6 Respiratory Therapy Technician
% of Days 71%
5 Speech Language Pathologist
% of Days 75%
5 Physical Therapy Assistant
% of Days 74%
2 Nurse Practitioner
% of Days 71%
2 Administrator
% of Days 71%
2 Dietitian
% of Days 84%
2 Medication Aide/Technician
% of Days 49%
1 Occupational Therapy Aide
% of Days 70%
3 Qualified Social Worker
% of Days 68%
4 Other Dietary Services Staff
% of Days 45%
2 Physical Therapy Aide
% of Days 63%
2 Nurse Aide in Training
% of Days 23%
3 Occupational Therapy Assistant
% of Days 37%
1 Medical Director
% of Days 8%

Facility Characteristics

Source: CMS Long-Term Care Facility Characteristics (Data as of Jan 2026)

Total census
97 residents
Residents by payment source
Medicare
7 residents (7.2%)
Medicaid
49 residents (50.5%)
Private pay or other
41 residents (42.3%)
Programs & Services
Residents' Group

Residents meet regularly to discuss policies, care quality, and activities

CCRC

Part of a Continuing Care Retirement Community offering multiple care levels

Active Resident Council

Organized group of residents that meets regularly to discuss facility policies, quality of life, and activities.

Quality of care over time

These measures show how residents usually do over time at this home, based on health outcomes and preventive care.

High-risk clinical events score Info A composite score based on pressure ulcers, falls with injury, weight loss, walking ability decline, and activities of daily living decline. 14.4
59% worse than Colorado average

Colorado average: 9.0

Functional decline score Info A composite score based on activities of daily living decline, walking ability decline, and incontinence. 28.1
50% worse than Colorado average

Colorado average: 18.8

Long-stay resident measures
Need for Help with Daily Activities Increased Info Percent of long-stay residents whose need for help with daily activities has increased 21.3%
33% worse than Colorado average

Colorado average: 16.0%

Walking Ability Worsened Info Percent of long-stay residents whose ability to move independently worsened 34.2%
101% worse than Colorado average

Colorado average: 17.0%

Low Risk Residents with Bowel/Bladder Incontinence Info Percent of low risk long-stay residents who lose control of their bowels or bladder 29.0%
25% worse than Colorado average

Colorado average: 23.2%

Falls with Major Injury Info Percent of long-stay residents experiencing one or more falls with major injury 3.8%
13% worse than Colorado average

Colorado average: 3.3%

High Risk Residents with Pressure Ulcers Info Percent of long-stay high risk residents with pressure ulcers 8.2%
111% worse than Colorado average

Colorado average: 3.9%

Urinary Tract Infection Info Percent of long-stay residents with a urinary tract infection 4.4%
206% worse than Colorado average

Colorado average: 1.4%

Lost Too Much Weight Info Percent of long-stay residents who lose too much weight 4.3%
17% better than Colorado average

Colorado average: 5.2%

Depressive Symptoms Info Percent of long-stay residents who have depressive symptoms 2.3%
68% better than Colorado average

Colorado average: 7.2%

Antipsychotic Use Info Percent of long-stay residents who received an antipsychotic medication 16.6%
12% better than Colorado average

Colorado average: 18.8%

Pneumococcal Vaccine Info Percent of long-stay residents assessed and appropriately given the pneumococcal vaccine 99.1%
6% better than Colorado average

Colorado average: 93.3%

Influenza Vaccine Info Percent of long-stay residents assessed and appropriately given the seasonal influenza vaccine 100.0%
6% better than Colorado average

Colorado average: 94.7%

Short-stay resident measures
Pneumococcal Vaccine Info Percent of short-stay residents assessed and appropriately given the pneumococcal vaccine 87.3%
14% better than Colorado average

Colorado average: 76.6%

Antipsychotic medication increase Info Percent of short-stay residents who newly received an antipsychotic medication 0.0%
100% better than Colorado average

Colorado average: 1.4%

Influenza Vaccine Info Percent of short-stay residents assessed and appropriately given the seasonal influenza vaccine 77.9%
In line with Colorado average

Colorado average: 75.6%

Penalties and fines

Federal penalties imposed by CMS for regulatory violations, including civil money penalties (fines) and denials of payment for new Medicare/Medicaid admissions.

Source: CMS Penalties Database (Data as of Jan 2026)

Total fines amount $52K
32% higher than Colorado average

Colorado average: $40K

Number of fines 4
80% more fines than Colorado average

Colorado average: 2.2

Payment Denials Info Serious action where Medicare and/or Medicaid temporarily stops payments for new residents until issues are fixed. 0
100% fewer payment denials than Colorado average

Colorado average: 0.3

Fines amount comparison
This facility $52K
Colorado average $40K
Penalty History

Penalties are imposed by CMS for violations of federal nursing home regulations.

Civil Money Penalty Info Fines imposed for noncompliance, which can be assessed per day or per instance of violation. Feb 26, 2025
$13K
Civil Money Penalty Info Fines imposed for noncompliance, which can be assessed per day or per instance of violation. Oct 22, 2024
$16K
Civil Money Penalty Info Fines imposed for noncompliance, which can be assessed per day or per instance of violation. May 7, 2024
$7K
Civil Money Penalty Info Fines imposed for noncompliance, which can be assessed per day or per instance of violation. Feb 7, 2023
$17K

Last updated: Jan 2026

Guides for Better Senior Living

Care Cost Calculator: See Prices in Your Area

Nursing Home Data Explorer

Don’t Wait Too Long: 7 Red Flag Signs Your Parent Needs Assisted Living Now

The True Cost of Assisted Living in 2025 – And How Families Are Paying For It

Understanding Senior Living Costs: Pricing Models, Discounts & Financial Assistance

Financial Aid for Colorado Seniors

Get financial aid guidance

Elderly, Blind, and Disabled Waiver

Colorado Medicaid EBD Waiver

Age 65+ or disabled, Colorado resident, Medicaid- eligible, nursing home-level care need.

~$2,829/month (300% FBR, individual).

$2,000 (individual), $3,000 (couple).

Requires level-of-care assessment by case manager.

Old Age Pension (OAP) Health Care Program

Colorado OAP

Age 60+, Colorado resident.

~$1,215/month (individual).

$2,000 (individual).

Supplements SSI; limited medical coverage.

Program of All-Inclusive Care for the Elderly (PACE)

Colorado Medicaid PACE

Age 55+, Colorado resident, nursing home-level care need, safe with PACE support.

~$2,829/month (300% FBR).

$2,000 (individual), $3,000 (couple).

Limited to specific regions (e.g., Denver, Pueblo).

Home Care Allowance (HCA)

Colorado Home Care Allowance (HCA)

Seniors typically 65+, Age 5+ with disability, Colorado resident, financial/functional need.

~$1,004/month (individual, stricter than waivers).

$2,000 (individual), $3,000 (couple).

Must need help with ADLs; not Medicaid-waiver eligible.

Senior Community Service Employment Program (SCSEP)

Colorado SCSEP (federally funded, state-administered)

Age 55+, unemployed, low-income, Colorado resident.

~$1,983/month (125% FPL, individual).

Not specified; income-focused.

Priority for veterans, rural residents.