

Hospitalizations per 1,000 days
 Number of hospitalizations per 1,000 long-stay resident days.
0.77
Number of hospitalizations per 1,000 long-stay resident days.
0.77
Colorado average: 1.30

We arrange tours, appointments, and even moving support so you don’t have to
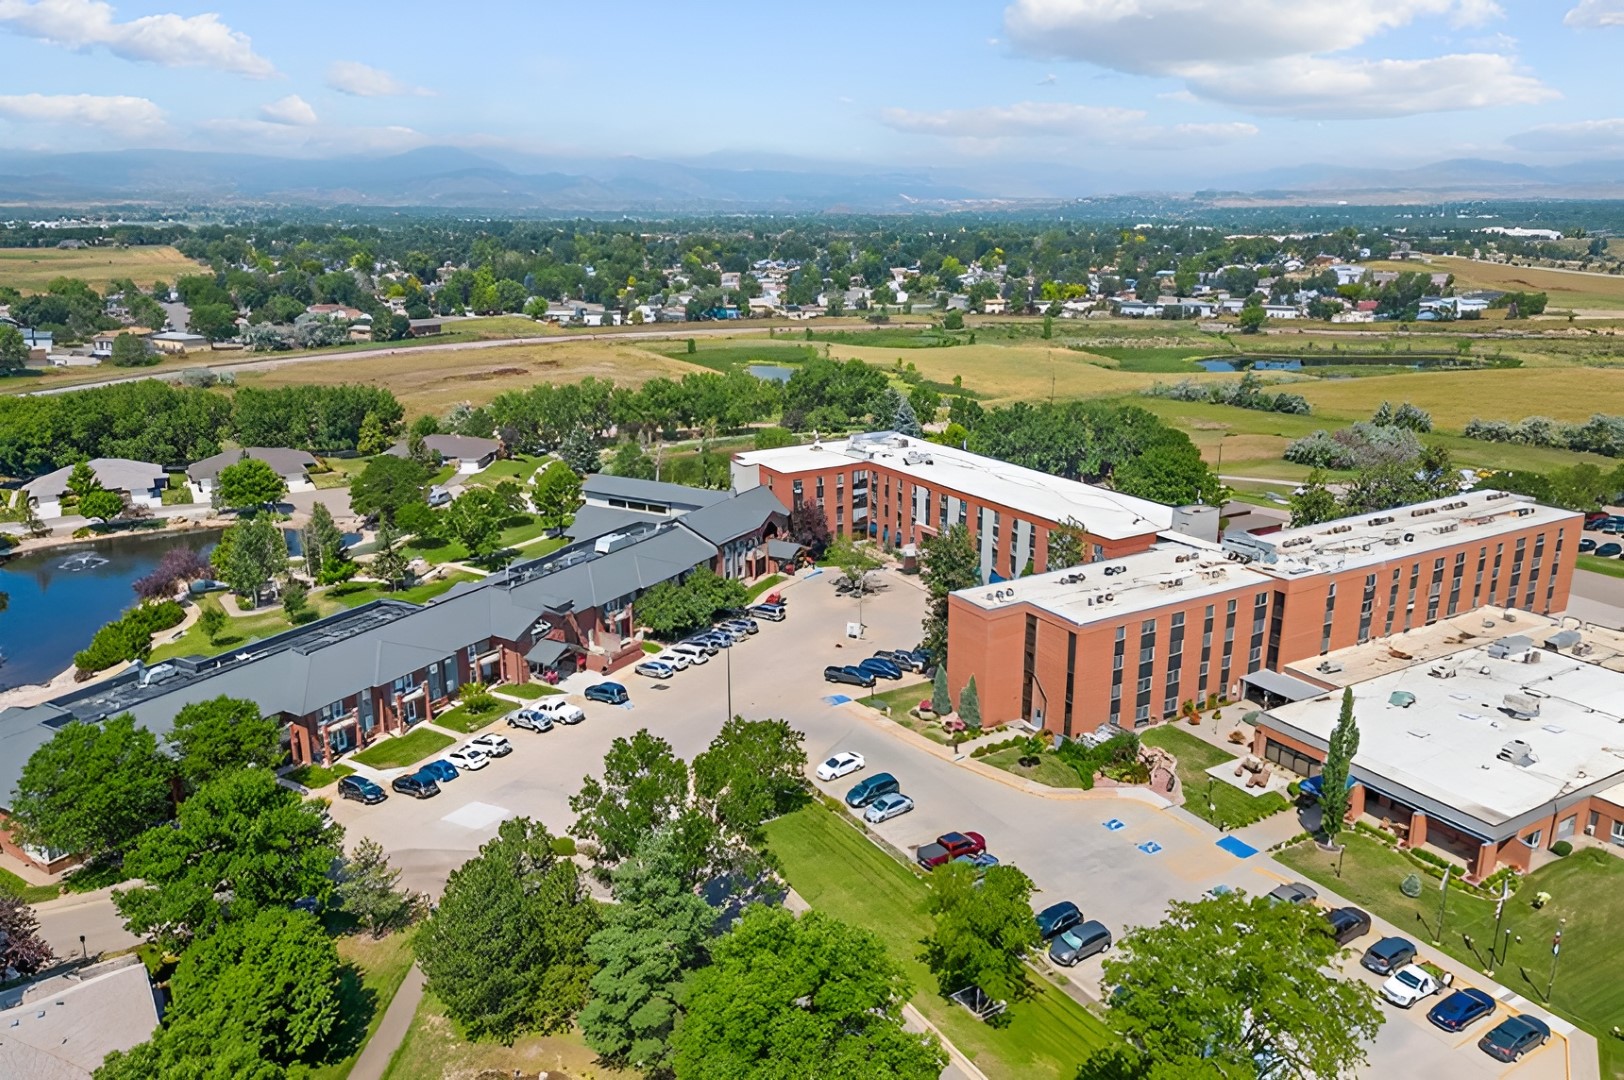
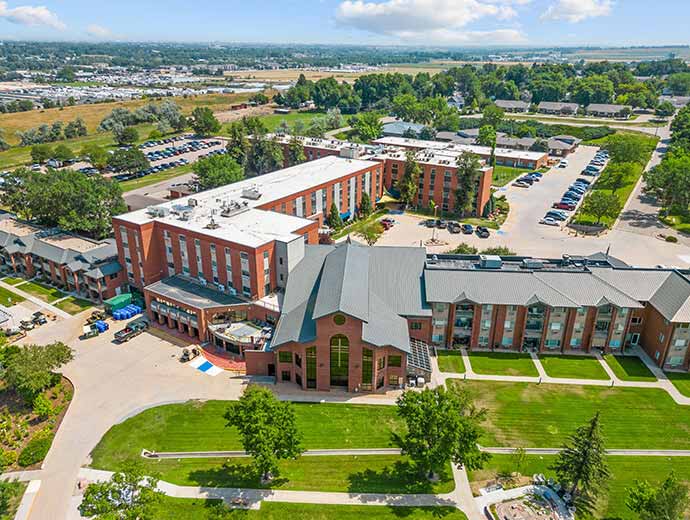

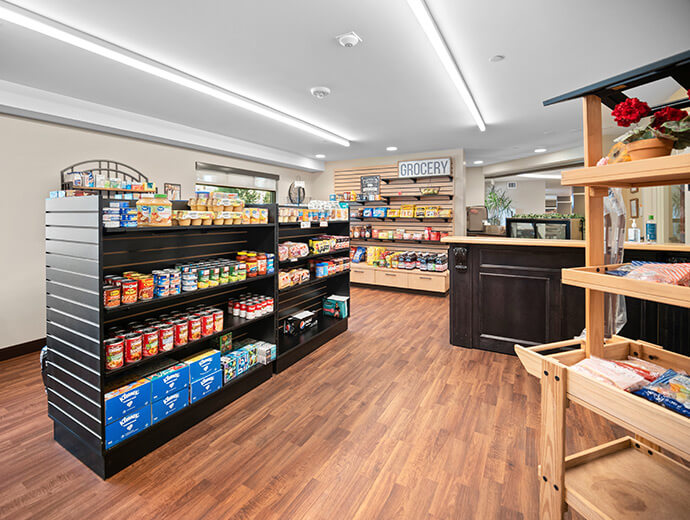
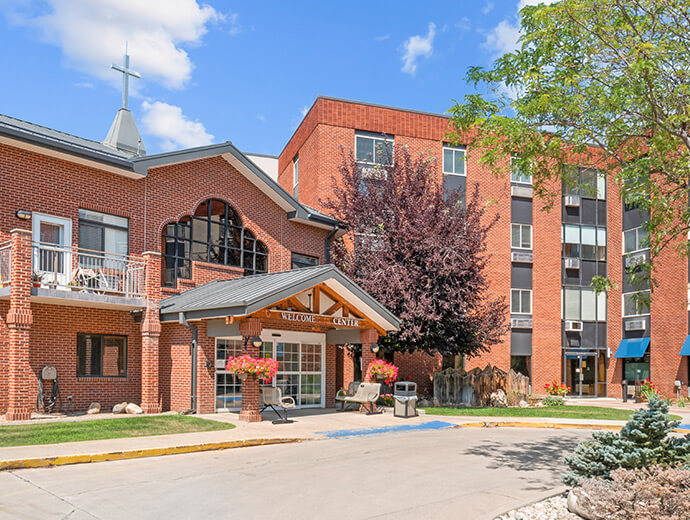
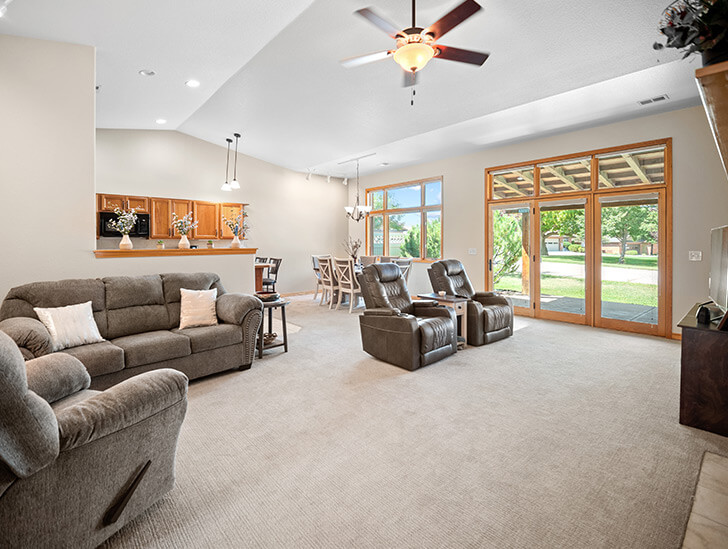
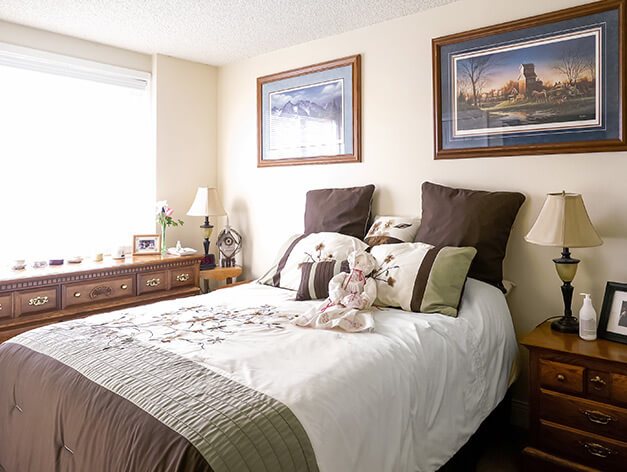
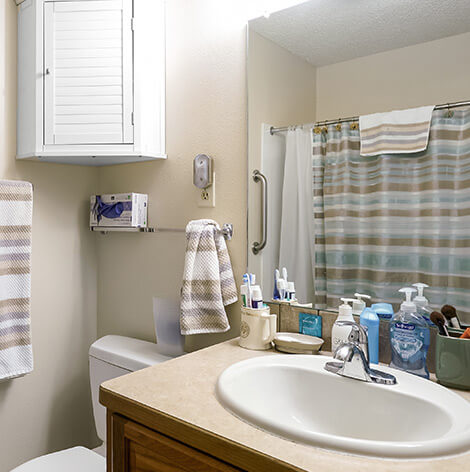


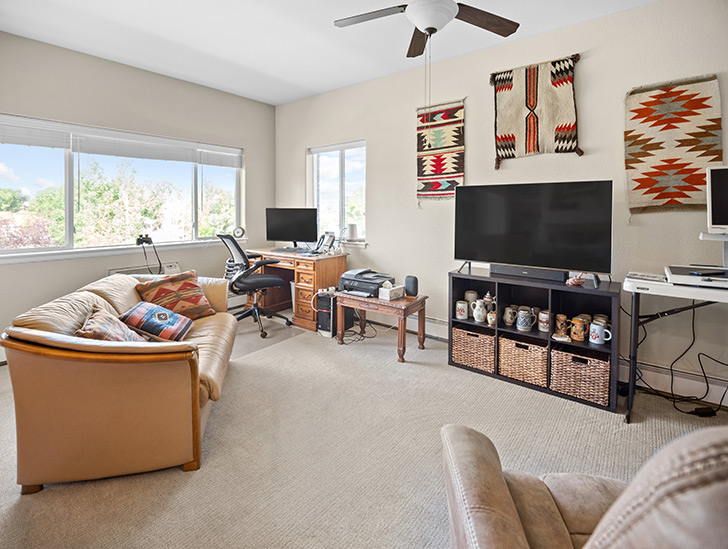
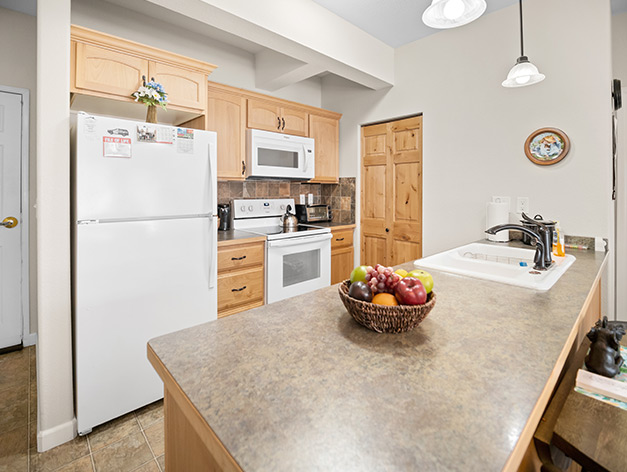
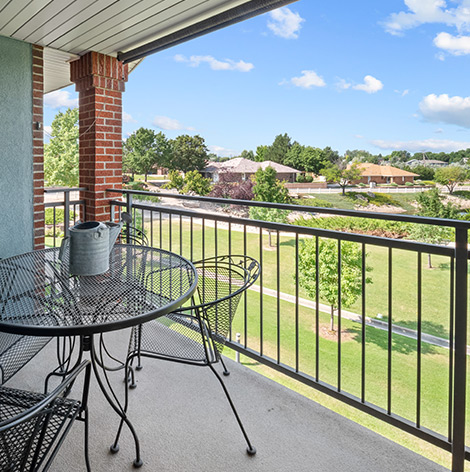
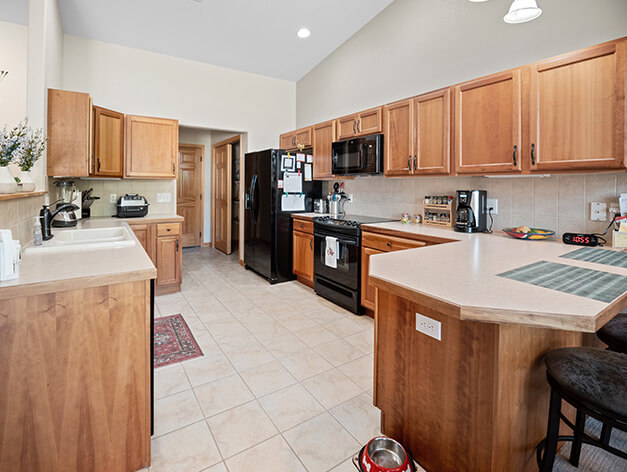


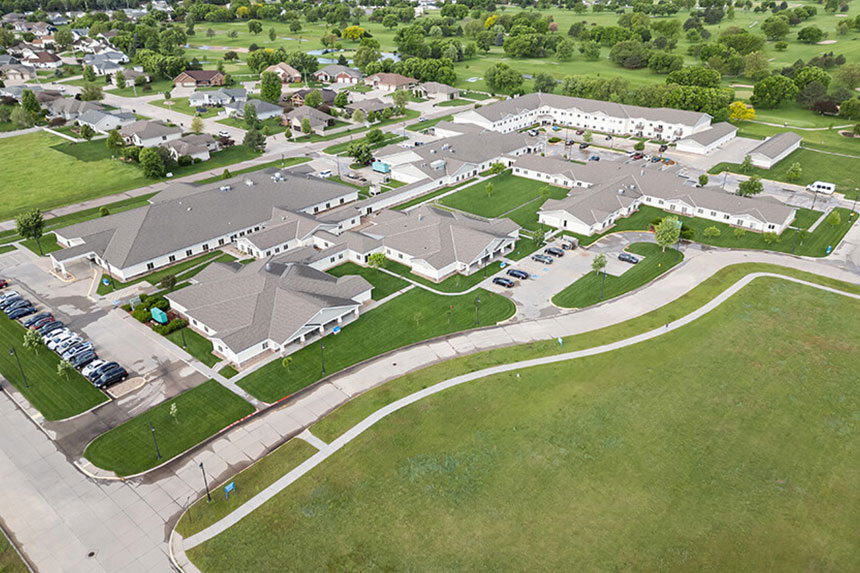


Spend your golden years at Good Samaritan Society – Loveland Village, a trusted 55+ community in Loveland, CO, offering independent living, assisted living, and skilled nursing. Alongside purposely built and spacious one- and two-bedroom floor plans, exceptional care is also provided, to ensure residents’ comfort and safety. With a compassionate and well-trained team available 24/7, residents can keep their peace of mind and live a worry-free lifestyle.
Residents are encouraged to participate in fun activities and enriching programs with a jam-packed calendar of exciting events and stimulating programs. Delightful and healthy meals are also served to satisfy residents’ dietary needs and preferences. Respite care and transportation services are also provided for residents’ convenience. The community is ideal for those needing support to live comfortably in retirement, especially with its comprehensive services and state-of-the-art amenities.
| Staff type | Hours / Day / Resident | vs state avg |
|---|---|---|
|
Registered Nurse (RN)
| 1h 1m per day | ▲ 22% State avg: 50m per day · National avg: 41m per day |
|
LPN / LVN
| 33m per day | ▼ 20% State avg: 41m per day · National avg: 52m per day |
|
Nurse Aide
| 1h 44m per day | ▼ 21% State avg: 2h 12m per day · National avg: 2h 20m per day |
|
Weekend Total Nursing
| 2h 58m per day | ▼ 9% State avg: 3h 16m per day · National avg: 3h 26m per day |
|
Physical Therapist
| 5m per day | ■ Avg State avg: 5m per day · National avg: 4m per day |
|
Weekend RN
| 40m per day | ▲ 11% State avg: 36m per day · National avg: 28m per day |
Good Samaritan Society – Loveland Village is administrated by Tammi Lynn Lehto.
Key information about the people who lead and staff this community.
These measures show how residents usually do over time at this home, based on health outcomes and preventive care.
Colorado average: 1.30
Colorado average: 1.67
Colorado average: 20.3%
Colorado average: 12.8%
Colorado average: 0.8%
Colorado average: 53.7%
Colorado average: 50.6%
Quality measures are calculated from Minimum Data Set (MDS) assessments. For most measures, lower percentages indicate better care quality.
Minimum Age: 55 Years Old
Pets Allowed
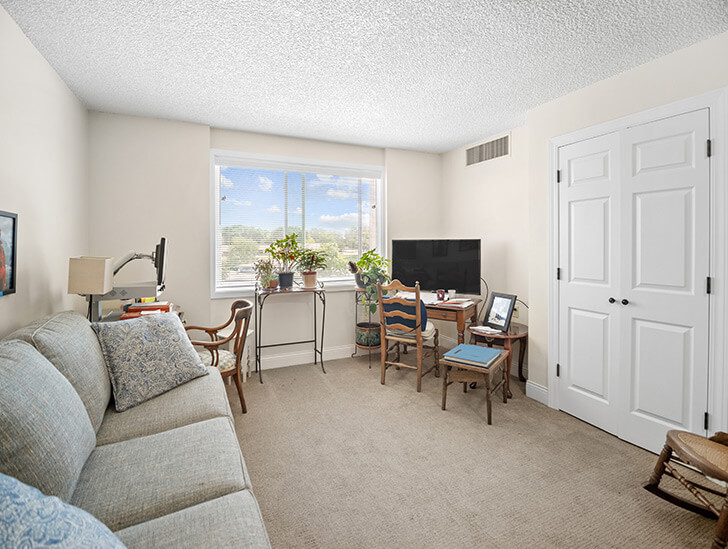
Room Sizes: 440 - 580 sq. ft
Housing Options: 1 Bed / 2 Bed
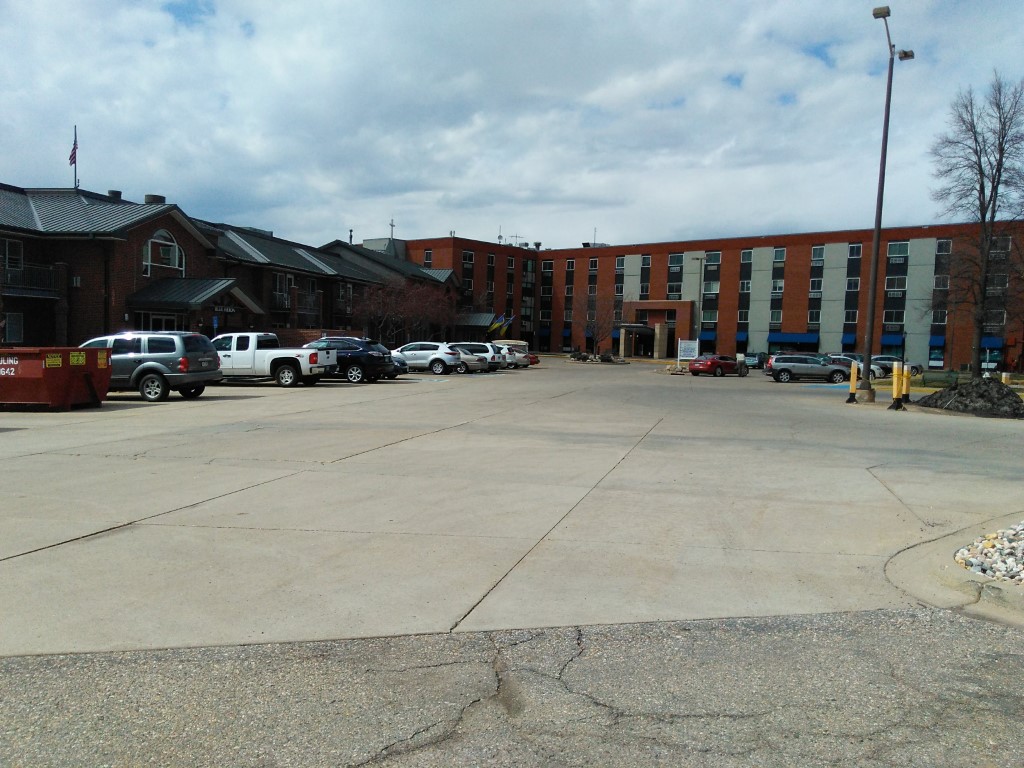
Building Type: Mid-rise
Dining Services
Beauty Services
Transportation Services
Housekeeping Services
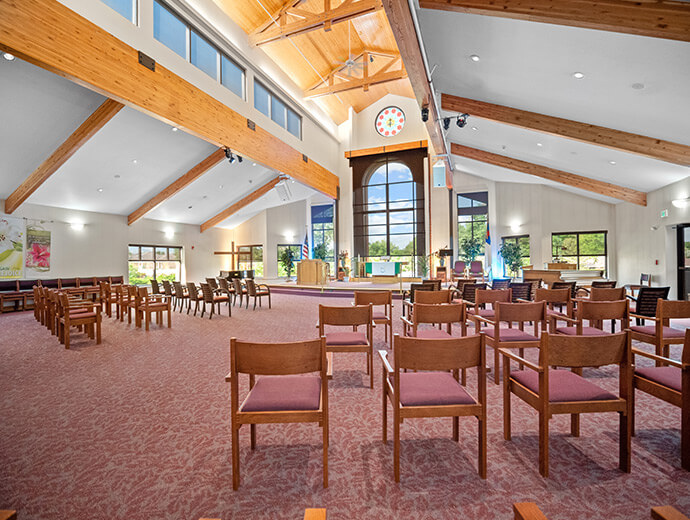
Social and Recreational Activities
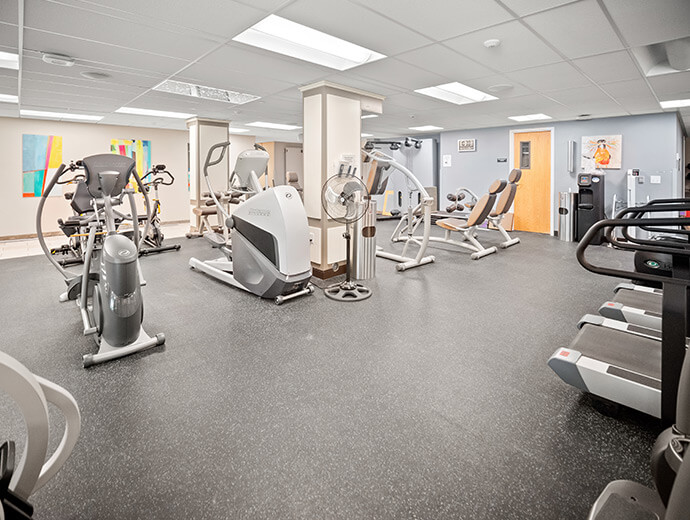
Exercise Programs
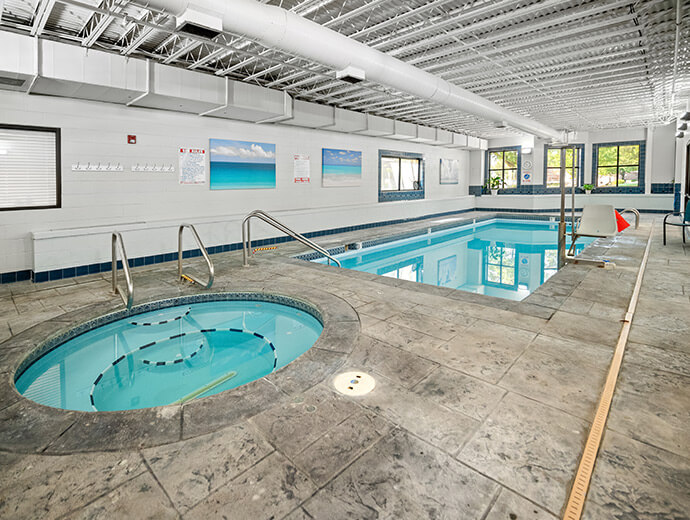
Swimming Pool
![]() 2.2 miles from city center
2.2 miles from city center
![]() Estimated distance in miles from Loveland's city center to Good Samaritan Society – Loveland Village's address, calculated via Google Maps.
Estimated distance in miles from Loveland's city center to Good Samaritan Society – Loveland Village's address, calculated via Google Maps.
Add your location
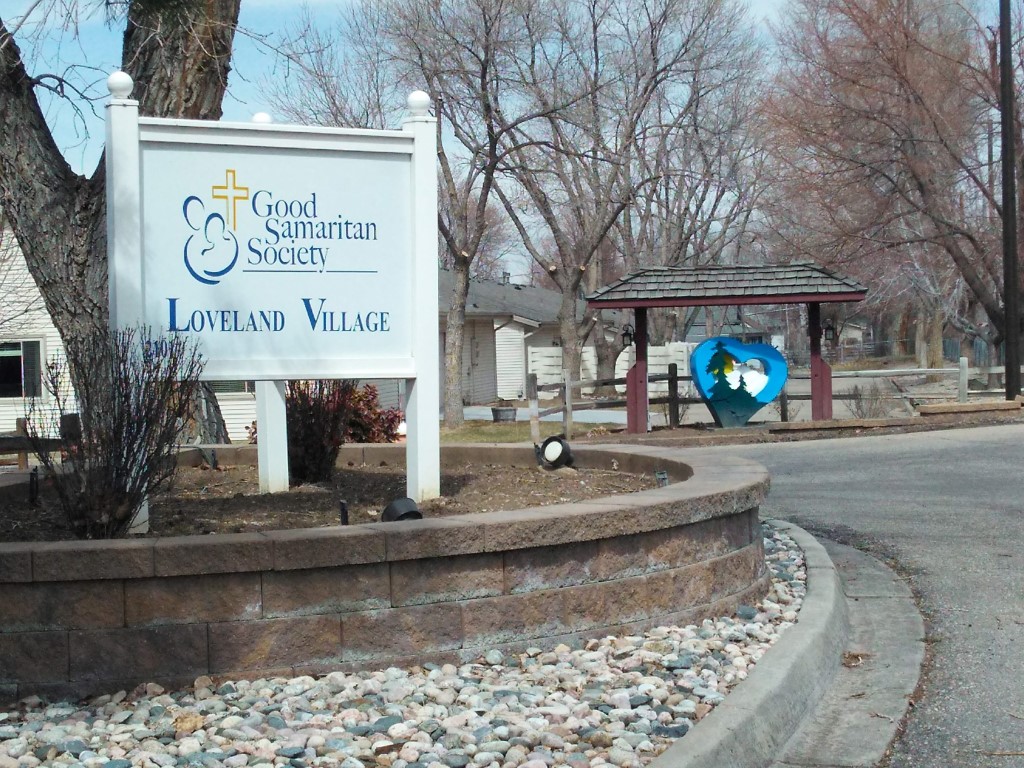
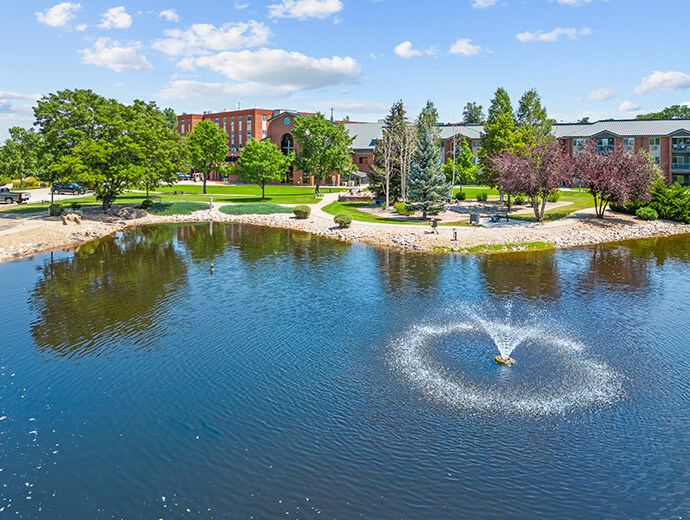
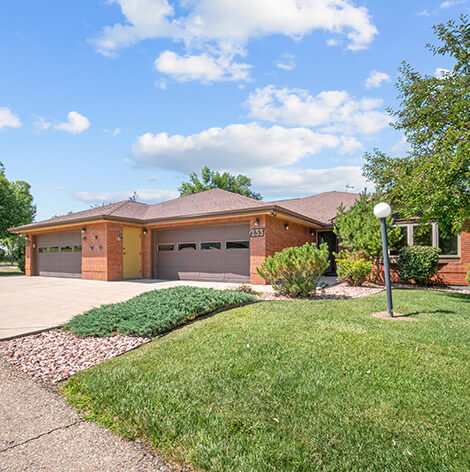
Good Samaritan Society – Loveland Village is located in Loveland, Colorado.
Here are the financial assistance programs available to residents in Colorado.
The information below is reported by the Colorado Department of Public Health and Environment, Health Facilities Division.
| Good Samaritan Society -Loveland Village |
NH Nursing Home Licensed facility providing 24/7 skilled nursing care for residents with complex, ongoing medical needs. Staffed by RNs, LPNs, and CNAs. Inspected and star-rated annually by CMS. Accepts Medicare (short-term rehab) and Medicaid (long-term care).
AL Assisted Living A licensed, long-term care setting for seniors or individuals with disabilities who need help with daily activities — like bathing, dressing, and medication management — but not 24-hour skilled nursing. Offers housing, meals, and around-the-clock support while aiming to maximize resident independence. | Loveland | 60 | - | - | 3.67 | +17% | -5% | $52.1k | 14 | 2.8 | 5 | 97 | 0 | Diego Freitas | $26.1M | $11.6M | 44.6% | 65139 | ||||
| The Green House Homes at Mirasol |
NH Nursing Home Licensed facility providing 24/7 skilled nursing care for residents with complex, ongoing medical needs. Staffed by RNs, LPNs, and CNAs. Inspected and star-rated annually by CMS. Accepts Medicare (short-term rehab) and Medicaid (long-term care).
AL Assisted Living A licensed, long-term care setting for seniors or individuals with disabilities who need help with daily activities — like bathing, dressing, and medication management — but not 24-hour skilled nursing. Offers housing, meals, and around-the-clock support while aiming to maximize resident independence. | Loveland | 90 | - | - | 6.27 | -10% | +62% | $7.5k | 24 | 6.0 | - | 88 | 32 | Loveland Elder Green House Homes For Life Enrichment A Colorado Non | $14.9M | $9.3M | 62.5% | 65412 |
The legal owner and operator of Good Samaritan Society – Loveland Village is The Evangelical Lutheran Good Samaritan Society.
Good Samaritan Society – Loveland Village has a walk score of 7. Car-dependent. Most errands require a car, with limited nearby walkable options.
Yes — see the floorplan options available at Good Samaritan Society – Loveland Village on this page.
Tammi Lynn Lehto is the administrator of Good Samaritan Society – Loveland Village.
Good Samaritan Society – Loveland Village has 104 beds.
Yes — there are 35 photos of Good Samaritan Society – Loveland Village in the photo gallery on this page.
Good Samaritan Society – Loveland Village is located at 2101 S Garfield Ave, Loveland, CO 80537.
Care Cost Calculator: See Prices in Your Area
Nursing Home Data Explorer
Don’t Wait Too Long: 7 Red Flag Signs Your Parent Needs Assisted Living Now
The True Cost of Assisted Living in 2025 – And How Families Are Paying For It
Understanding Senior Living Costs: Pricing Models, Discounts & Financial Assistance


Thank you for your interest!
Our team will be in touch shortly to help with next steps.
