

Total health inspections
7
Arizona average 6.3
Last Health inspection on Aug 2025

We arrange tours, appointments, and even moving support so you don’t have to
Thank you for your interest!
Our team will be in touch shortly to help with next steps.
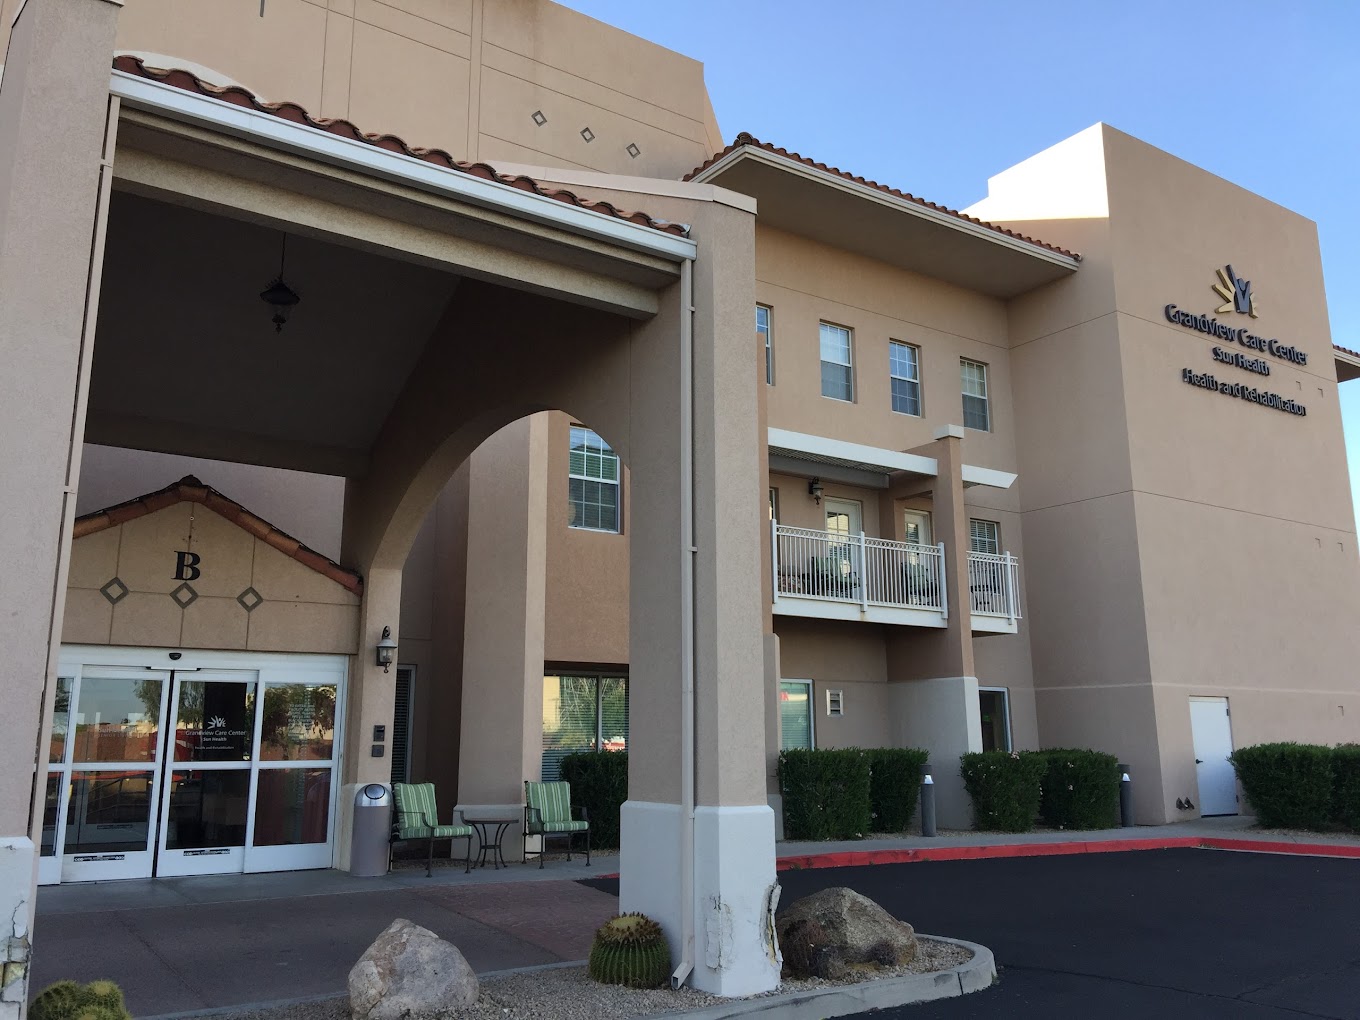
Discover exceptional living at Grandview Terrace Health & Rehabilitation Center, conveniently situated in Sun City West, AZ. The community offers a comprehensive range of care and services, including assisted living, memory support, skilled nursing, and rehabilitation. Residents can select from a range of spacious one-bedroom and two-bedroom condominiums, each designed with comfort and convenience in mind.
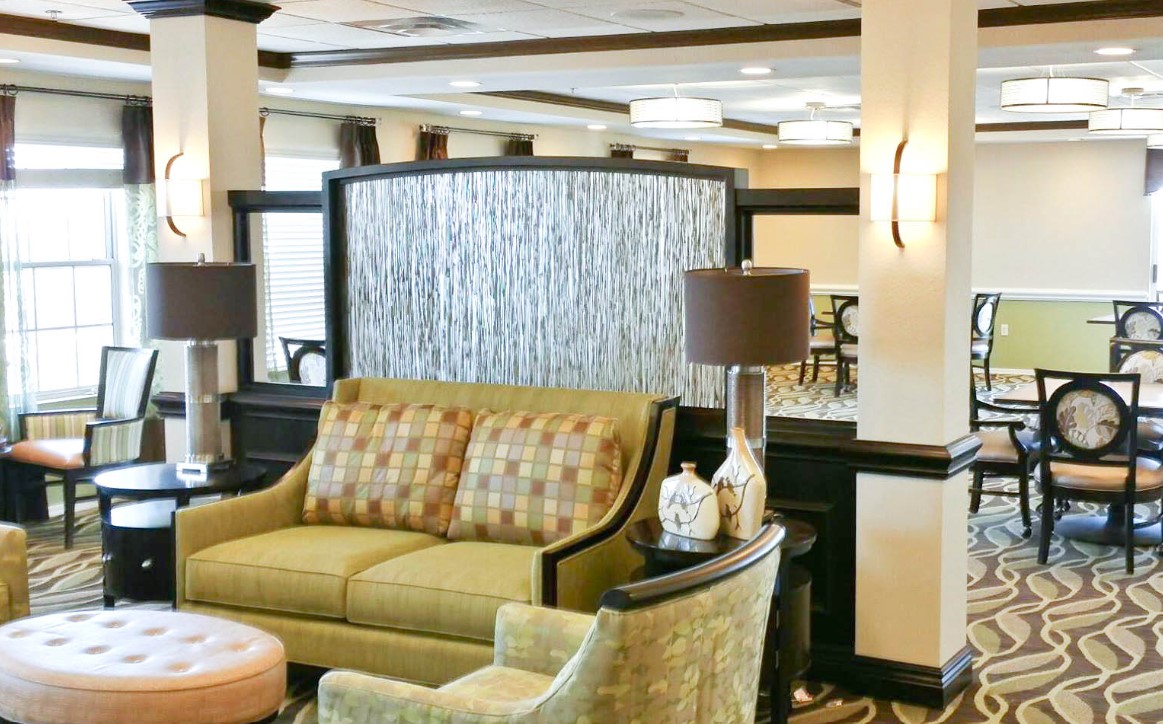
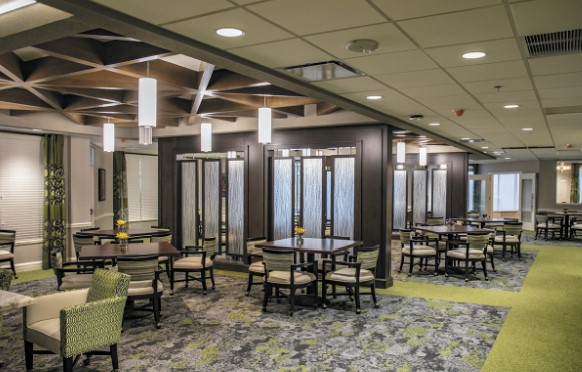
Here, residents can embrace a lifestyle full of exciting amenities and activities. The community prides itself on its resort-style offerings, including fine dining, an art studio, and an indoor swimming pool, as well as a full-service salon and barber shop. Social activities such as wine and paint events and casino nights create a fun and inviting atmosphere. With everything needed for a fulfilling life just steps away, Grandview Terrace Health & Rehabilitation Center is the perfect place to thrive.
Cherie Keating serves as the Health Center Administrator at Grandview Terrace Health & Rehabilitation Center. She leads the health center operations, ensuring quality care and a supportive environment for residents. Cherie is dedicated to fostering a warm and professional community atmosphere.
Lower occupancy suggests more openings may be available.
Residents typically stay for brief periods, with frequent admissions and discharges throughout the year.
38% of new residents, usually for short-term rehab.
62% of new residents, often for short stays.
Accept Medicaid: Yes, Accept
Total Residents: 72 Residents
Housing Options: Private / Semi-Private Rooms
Building Type: 3-story
Arizona average 6.3
Last Health inspection on Aug 2025
Arizona average 23.2
Arizona average 3.82
Health citations are formal notices following inspections when they fail to comply with safety and care standards.
8 of 12 citations resulted from standard inspections; and 4 of 12 resulted from complaint investigations.
Arizona average: 0.1
Arizona average: 0.6
Data sourced from CMS Health Deficiencies reports. Citation severity codes range from A (least serious) to L (most serious). Immediate Jeopardy (J-L) citations indicate situations where the facility's noncompliance has placed residents at risk of death or serious harm.
Assisted Living A licensed, long-term care setting for seniors or individuals with disabilities who need help with daily activities — like bathing, dressing, and medication management — but not 24-hour skilled nursing. Offers housing, meals, and around-the-clock support while aiming to maximize resident independence.
Independent Living Lifestyle-focused communities for older adults offering dining, activities, and transportation with minimal personal care. Best for active, independent seniors who want community without medical support.
Memory Care Secured, specialized care for people living with Alzheimer's or dementia. Staff trained in cognitive impairment, with higher staff-to-resident ratios and an environment designed to reduce confusion and wandering risk.
Nursing Home Licensed facility providing 24/7 skilled nursing care for residents with complex, ongoing medical needs. Staffed by RNs, LPNs, and CNAs. Inspected and star-rated annually by CMS. Accepts Medicare (short-term rehab) and Medicaid (long-term care).
![]() 7.7 miles from city center
7.7 miles from city center
![]() 14505 W Granite Valley Dr, Sun City West, AZ 85375
14505 W Granite Valley Dr, Sun City West, AZ 85375
Add your location
This data corresponds to Q2 2025 and is based on CMS Payroll-Based Journal.
Arizona average ratio: 1.83:1
Arizona average: 8.5 hours
Manages medical care and health needs.
This role is partially covered by contractors.
Assists with medical care and medications.
This role is partially covered by contractors.
Helps with daily care and mobility.
This role is partially covered by contractors.
Total hours from contractors
7,091 contractor hours this quarter
| Certified Nursing Assistant | 54 | 68 | 122 | 17,436 | 91 | 100% | 8.1 |
| Licensed Practical Nurse | 15 | 37 | 52 | 7,265 | 91 | 100% | 10.3 |
| Registered Nurse | 16 | 4 | 20 | 2,495 | 91 | 100% | 9.8 |
| RN Director of Nursing | 4 | 0 | 4 | 2,080 | 90 | 99% | 9.4 |
| Clinical Nurse Specialist | 2 | 0 | 2 | 918 | 75 | 82% | 7.8 |
| Respiratory Therapy Technician | 0 | 7 | 7 | 916 | 86 | 95% | 4.1 |
| Other Dietary Services Staff | 2 | 0 | 2 | 916 | 82 | 90% | 7.9 |
| Qualified Social Worker | 0 | 2 | 2 | 890 | 66 | 73% | 7 |
| Speech Language Pathologist | 0 | 3 | 3 | 566 | 72 | 79% | 7 |
| Physical Therapy Aide | 0 | 3 | 3 | 525 | 68 | 75% | 7.4 |
| Administrator | 1 | 0 | 1 | 520 | 65 | 71% | 8 |
| Dental Services Staff | 1 | 0 | 1 | 507 | 59 | 65% | 8.6 |
| Mental Health Service Worker | 1 | 0 | 1 | 496 | 62 | 68% | 8 |
| Nurse Practitioner | 1 | 0 | 1 | 482 | 62 | 68% | 7.8 |
| Dietitian | 1 | 0 | 1 | 433 | 56 | 62% | 7.7 |
| Physical Therapy Assistant | 0 | 3 | 3 | 331 | 77 | 85% | 4 |
| Medical Director | 0 | 1 | 1 | 63 | 12 | 13% | 5.3 |
| Occupational Therapy Assistant | 0 | 1 | 1 | 38 | 3 | 3% | 12.7 |
Source: CMS Long-Term Care Facility Characteristics (Data as of Jan 2026)
Residents meet regularly to discuss policies, care quality, and activities
Part of a Continuing Care Retirement Community offering multiple care levels
Organized group of residents that meets regularly to discuss facility policies, quality of life, and activities.
Data sourced from CMS Long-Term Care Facility Characteristics quarterly report. Payer mix reflects the current resident census by primary payment source.
These measures show how residents usually do over time at this home, based on health outcomes and preventive care.
Arizona average: 7.6
Arizona average: 16.1
Arizona average: 11.2%
Arizona average: 15.8%
Arizona average: 20.8%
Arizona average: 2.1%
Arizona average: 5.1%
Arizona average: 1.3%
Arizona average: 5.4%
Arizona average: 4.5%
Arizona average: 10.3%
Arizona average: 97.2%
Arizona average: 94.6%
Arizona average: 1.68
Arizona average: 1.48
Arizona average: 91.5%
Arizona average: 1.0%
Arizona average: 87.3%
Arizona average: 24.6%
Arizona average: 10.7%
Arizona average: 0.8%
Arizona average: 53.7%
Arizona average: 50.6%
Quality measures are calculated from Minimum Data Set (MDS) assessments. For most measures, lower percentages indicate better care quality.
Historical financial and operational data for Grandview Terrace Health & Rehabilitation Center based on CMS SNF Cost Reports.
Loading trend charts...
Care Cost Calculator: See Prices in Your Area
Nursing Home Data Explorer
Don’t Wait Too Long: 7 Red Flag Signs Your Parent Needs Assisted Living Now
The True Cost of Assisted Living in 2025 – And How Families Are Paying For It
Understanding Senior Living Costs: Pricing Models, Discounts & Financial Assistance

Touring a community? Use this expert-backed checklist to stay organized, ask the right questions, and find the perfect fit.
We'll send you a PDF version of the touring checklist.


