Grandview Terrace Health & Rehabilitation Center

Nursing Home in Sun City West

CMS overall rating Info The Overall CMS Rating is scored from 1 to 5 stars and combines results from health inspections, staffing levels, and quality measures. Health inspections carry the most weight. Staffing and quality scores can increase or decrease the final rating based on performance compared to state and national standards.
Calculator: See prices in your area
Grandview Terrace Health & Rehabilitation Center accepts Medicare and private pay.

Overview of Grandview Terrace Health & Rehabilitation Center

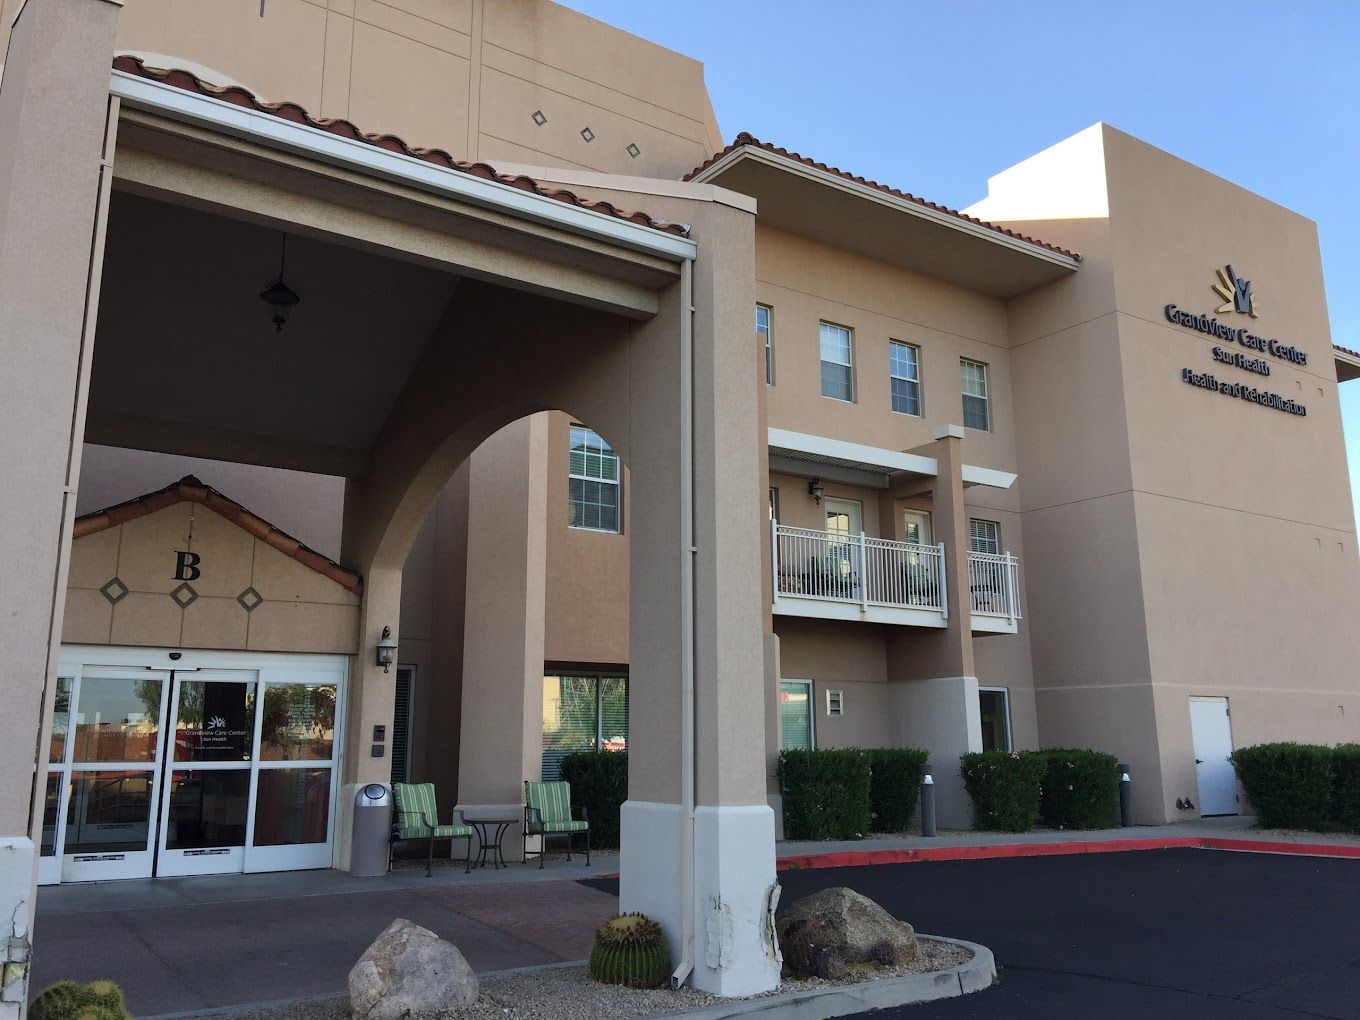
Discover exceptional living at Grandview Terrace Health & Rehabilitation Center, conveniently situated in Sun City West, AZ. The community offers a comprehensive range of care and services, including assisted living, memory support, skilled nursing, and rehabilitation. Residents can select from a range of spacious one-bedroom and two-bedroom condominiums, each designed with comfort and convenience in mind.

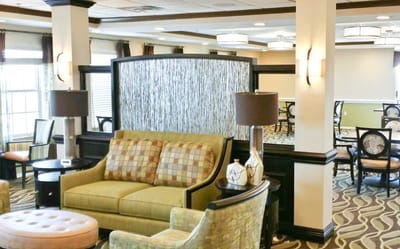
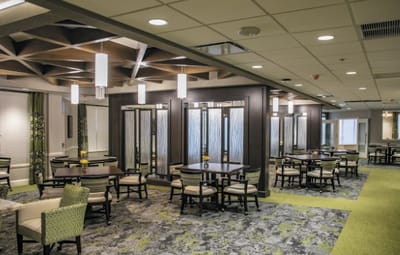
Here, residents can embrace a lifestyle full of exciting amenities and activities. The community prides itself on its resort-style offerings, including fine dining, an art studio, and an indoor swimming pool, as well as a full-service salon and barber shop. Social activities such as wine and paint events and casino nights create a fun and inviting atmosphere. With everything needed for a fulfilling life just steps away, Grandview Terrace Health & Rehabilitation Center is the perfect place to thrive.

(623) 975-8100

Managed by Cherie Keating

Health Center Administrator

Cherie Keating serves as the Health Center Administrator at Grandview Terrace Health & Rehabilitation Center. She leads the health center operations, ensuring quality care and a supportive environment for residents. Cherie is dedicated to fostering a warm and professional community atmosphere.

Quality ratings

Measured by Centers for Medicare & Medicaid Services (CMS)

Overall rating Info The Overall CMS Rating combines results from health inspections, staffing levels and quality measures. Health inspections carry the most weight. Staffing and quality scores can increase or decrease the final rating based on performance compared to state and national standards.
5/5 ▲ 1.7 Arizona average: 3.3/5
Health Inspection Info Based on the results of the facility's three most recent standard inspections and any complaint investigations. CMS reviews the number, scope, and severity of deficiencies, with more recent findings weighted more heavily.
4/5 ▲ 1.2 Arizona average: 2.8/5
Staffing Info Measures average nursing staff hours per resident per day, including Registered Nurses (RNs) and total nursing staff. Ratings are adjusted based on the level of care residents require and are compared to state and national benchmarks.
4/5 ▲ 1.0 Arizona average: 3.0/5
Quality Measures Info Based on clinical and physical health indicators reported to CMS, such as hospital readmissions, falls, pressure ulcers, and improvements in mobility. These measures reflect how well residents' health needs are being managed.
5/5 ▲ 0.5 Arizona average: 4.5/5

Staffing hours breakdown

Info Daily nursing hours per resident by staff type, reported to CMS. Higher is generally better — compare this facility to state and national averages to see where staffing stands.

Hours per resident per day — compared to Arizona state averages

Total nursing care / resident Info This home is ranked 13th out of 60 homes in Arizona.

Total adjusted nursing hours per resident per day, combining RN, LPN, and aide time. CMS adjusts this for case-mix so facilities can be fairly compared.
5h 0m per day
Rank #13 / 60Nurse hours — state benchmarkedThis home is ranked 13th out of 60 homes in Arizona.Shows adjusted nurse hours per resident per day benchmarked to the Arizona average, with a ranking across 60 Arizona SNFs. More hours mean more direct care. The national average is about 3.5 hrs; below 3.0 is a red flag.
This facility Arizona avg (4h 4m per day)
vs Arizona avg
+23%

0 of 6 metrics below state avg

Standout metric Physical Therapist is +83% above state avg
Staff typeHours / dayvs state avg
Registered Nurse (RN) Info RNs hold the highest nursing license and can assess residents, interpret test results, and direct care plans. More RN hours per day often signals stronger clinical oversight and faster response to health changes. 59m per day ▲ 37% State avg: 43m per day · National avg: 41m per day
LPN / LVN Info Licensed Practical Nurses (LPNs) or Licensed Vocational Nurses (LVNs) deliver routine hands-on care — medication administration, wound dressing, and monitoring vital signs. They work under RN supervision and make up a large share of daily bedside care. 1h 24m per day ▲ 33% State avg: 1h 3m per day · National avg: 52m per day
Nurse Aide Info Certified Nurse Aides (CNAs) provide the most direct day-to-day assistance: bathing, dressing, feeding, and mobility. Nurse aide hours are typically the largest staffing category and directly affect residents' quality of life. 3h 13m per day ▲ 36% State avg: 2h 22m per day · National avg: 2h 21m per day
Total Nursing (Weekend) Info Combined nursing hours (RN + LPN + Nurse Aide) per resident per day on weekends. Staffing often drops on weekends — this figure reveals whether the facility maintains adequate coverage outside of weekday hours. 5h 0m per day ▲ 38% State avg: 3h 38m per day · National avg: 3h 26m per day
Physical Therapist Info Hours per resident per day provided by licensed Physical Therapists (PTs) or PT Assistants. PT services help residents recover mobility after injury or illness and are especially important for post-acute (short-stay) rehabilitation. 11m per day ▲ 83% State avg: 6m per day · National avg: 4m per day
RN (Weekend) Info Registered nurse hours specifically on weekends. Facilities sometimes reduce RN presence on Saturdays and Sundays — a low weekend RN figure compared to weekday hours can indicate reduced clinical oversight when most administrative staff are absent. 49m per day ▲ 58% State avg: 31m per day · National avg: 29m per day

Capacity and availability

This home usually has availability

Occupancy lower than 85% suggests more openings may be available.

Lower occupancy than the Arizona average: 72.7%
Occupancy rate 69.7% Rank #37 / 64Occupancy rate — state benchmarkedThis home is ranked 37th out of 64 homes in Arizona.Shows this facility's occupancy rate versus the Arizona average, with its statewide rank out of 64. Higher occupancy signals strong local demand and financial stability.
Avg. Length of Stay 35 days
Occupancy rate
69.7% Rank #37 / 64Occupancy rate — state benchmarkedThis home is ranked 37th out of 64 homes in Arizona.Shows this facility's occupancy rate versus the Arizona average, with its statewide rank out of 64. Higher occupancy signals strong local demand and financial stability.
Avg. Length of Stay
35 days

Who this home usually serves

TYPE OF STAY

Primarily short stays

Residents typically stay for brief periods, with frequent admissions and discharges throughout the year.

Breakdown by payment type

Medicare

38% of new residents, usually for short-term rehab.

Typical stay 21 days

Private pay

62% of new residents, often for short stays.

Typical stay 2 - 3 months

Finances and operations

Privately-owned community
Operated by a partnership between two or more business owners.
Home revenue
$11.1M
Operating loss
-$3.2M
Privately-owned community Operated by a partnership between two or more business owners.
Home revenue
$11.1M Rank #42 / 63Revenue — state benchmarkedThis home is ranked 42nd out of 63 homes in Arizona.Shows this facility's annual revenue compared to the Arizona SNF average. Higher revenue generally means more resources for staffing and capital — read alongside Payroll %.
Operating loss
-$3.2M
Payroll costs Info The portion of the home's budget spent on staff, including nurses, caregivers, and other employees who support care and operations. Rank #35 / 63Payroll — state benchmarkedThis home is ranked 35th out of 63 homes in Arizona.Shows total annual staff payroll benchmarked to the Arizona average. Higher payroll investment relative to peers often signals better staffing and less reliance on cheaper contract labor.
$6.2M
55.5% of revenue Rank #17 / 63Payroll % — state benchmarkedThis home is ranked 17th out of 63 homes in Arizona.Shows payroll as a percentage of revenue versus the Arizona average. Well-run SNFs often land around 55–65%. Below 25% may signal understaffing or heavy agency use — read with Staffing ratings.
Other operating costs Info All remaining costs needed to run the home, such as food, utilities, building maintenance, supplies and administrative expenses.
$8.1M
Total costs $14.3M
Walk Score
Walk Score: 42 / 100 Rank #34 / 60Walk Score — state benchmarkedThis home is ranked 34th out of 60 homes in Arizona.Shows how walkable this facility's neighborhood is compared to the average Walk Score across Arizona SNFs. Higher scores benefit residents, families, and staff.
Somewhat walkable. A few nearby services may be reachable on foot, but most trips require transportation.

What does this home offer?

Accepts Medicaid icon

Accept Medicaid: Yes, Accept

Total residents icon

Total Residents: 72 Residents

Housing options icon

Housing Options: Private / Semi-Private Rooms

Building type icon
Building type icon

Building Type: 3-story

Types of Care at Grandview Terrace Health & Rehabilitation Center

Nursing Home

Contact Grandview Terrace Health & Rehabilitation Center

Health Inspection History

Inspections
Total health inspections 7

Arizona average 6.3


Last Health inspection on Aug 2025

Total health citations
12 Rank #18 / 63Health citations — state benchmarkedThis home is ranked 18th out of 63 homes in Arizona.Shows this facility's total health deficiency citations benchmarked to the Arizona state average, with a ranking across all 63 AZ SNFs. Lower citation counts earn a better rank.

Arizona average 23.2

Citations per inspection
1.71 Rank #2 / 63Citations per inspection — state benchmarkedThis home is ranked 2nd out of 63 homes in Arizona.Shows average deficiency citations per CMS inspection for this facility versus the Arizona mean across 63 SNFs with citation data. Lower is better.

Arizona average 3.82


Health citations are formal notices following inspections when they fail to comply with safety and care standards.

8 of 12 citations resulted from standard inspections; and 4 of 12 resulted from complaint investigations.

Breakdown of citation severity (last 3 years)
Critical Health citations More info
0
100% better than Arizona average

Arizona average: 0.1


Serious Health citations More info 0
100% better than Arizona average

Arizona average: 0.6

0 critical citations More info Arizona average: 0.1

0 serious citations More info Arizona average: 0.6

12 moderate citations More info Arizona average: 22.3

0 minor citations More info Arizona average: 0.2
Citations history (last 3 years)
Infection Control moderate citation Info Issues related to preventing and controlling infections, including hygiene practices and safety protocols. Aug 01, 2025
Corrected

Pharmacy moderate citation Info Issues related to medication management, including how drugs are stored, administered, and monitored. Aug 01, 2025
Corrected

Resident Rights moderate citation Info Issues related to resident's rights, including dignity, privacy, and the ability to make decisions about their care. Aug 01, 2025
Corrected

Nutrition moderate citation Info Issues related to food quality, meal service, and resident's nutritional needs. Aug 01, 2024
Corrected

Financial Assistance for
Nursing Home in Arizona

Grandview Terrace Health & Rehabilitation Center is located in Sun City West, Arizona.
Here are the financial assistance programs available to residents in Arizona.

Get Financial aid guidance

Arizona Long Term Care System

ALTCS

Age 65+ or disabled
General Arizona resident, Medicaid-eligible, nursing home-level care need.
Income Limits (2025) ~$2,829/month 300% FBR, individual
Asset Limits $2,000 (individual), $3,000 (couple).
AZ

Covers tribal members; rural outreach.

Benefits
In-home care (6-8 hours/day) Assisted living Nursing home care Medical services Transportation (10 trips/month)

Non-Medical Home and Community Based Services

AZ DES Non-Medical HCBS

Age 60+
General Arizona resident, at risk of institutionalization.
Income Limits ~$2,000/month individual, varies
Asset Limits $10,000 individual
AZ

Limited funding; waitlists common.

Benefits
Homemaker services (3-5 hours/week) Respite care (up to 10 days/year) Adult day care (~$60/day)

Senior Community Service Employment Program (SCSEP)

AZ SCSEP

Age 55+
General Arizona resident, unemployed, low-income.
Income Limits (2025) ~$1,519/month 125% of poverty level, individual
Asset Limits Not specified; income-driven.
AZ

Wages at highest of federal/state/local minimum ($14.35/hour in 2025).

Benefits
Paid training (20 hours/week) Job placement (avg. $300-$500/month earnings) Career counseling

Weatherization Assistance Program (WAP)

AZ WAP

Age 60+ priority
General Arizona resident, own/rent home, low-income.
Income Limits (2025) ~$2,510/month 200% of poverty level, individual
Asset Limits Not applicable; income-focused.
AZ

High demand in rural desert areas; limited annual funds.

Benefits
Insulation Weather stripping HVAC repairs (avg. $500-$1,000/year savings)

Section 202 Supportive Housing for the Elderly

AZ Section 202

Age 62+
General Arizona resident, very low income, able to live independently with support.
Income Limits (2025) ~$1,645/month 50% of area median income, individual, varies by county
Asset Limits $10,000 individual, excludes home if owned
AZ

Limited units; high demand in metro areas like Phoenix.

Benefits
Subsidized rent (30% of income, e.g., $300-$500/month) On-site services (housekeeping, transportation, ~$200/month value)

Arizona CARES Program

AZ CARES

Age
General Caregivers of Arizona residents 60+ needing help with 3+ daily activities; no caregiver age limit.
Income Limits No strict limit; cost-sharing above ~$2,500/month threshold.
Asset Limits Not applicable; need-based.
AZ

Focus on rural access; complements ALTCS respite.

Benefits
Respite care (up to 10 days/year) Counseling (4-6 sessions/year) Training (2-3 workshops/year) Supplies (~$200/year)

AZ DES Non-Medical Home and Community Based Services (HCBS)

AZ DES Non-Medical HCBS

Age 60+ or disabled
General Arizona resident, need assistance with daily activities, not eligible for Medicaid/ALTCS.
Income Limits Above Medicaid threshold but low-income ~$1,500-$2,500/month, varies by region
Asset Limits Not specified; income-driven eligibility.
AZ

Targets those ineligible for ALTCS; prioritizes rural and tribal areas.

Benefits
Homemaker services (3-5 hours/week) Personal care (limited hours) Respite care (up to 10 days/year) Transportation (~5 trips/month)

Places of interest near Grandview Terrace Health & Rehabilitation Center

Address 7.7 miles from city center Info Estimated distance in miles from Sun City West's city center to Grandview Terrace Health & Rehabilitation Center's address, calculated via Google Maps.

Calculate Travel Distance to Grandview Terrace Health & Rehabilitation Center

Add your location

Address

Staffing Data (Q2 2025)

This data corresponds to Q2 2025 and is based on CMS Payroll-Based Journal.

Total staff 227
Employees 98
Contractors 129
Staff to resident ratio 3.98:1
118% better than Arizona average

Arizona average ratio: 1.83:1

Avg staff/day 49
Average shift 8.3 hours
0% compared with Arizona average

Arizona average: 8.5 hours

Total staff hours (quarter) 36,879
Nursing staff breakdown
Registered Nurse

Manages medical care and health needs.

Total count 20
Average shift length Info Average shift length. Calculated as total hours divided by days worked and average staff per day. 9.8 hours

This role is partially covered by contractors.

Licensed Practical Nurse

Assists with medical care and medications.

Total count 52
Average shift length Info Average shift length. Calculated as total hours divided by days worked and average staff per day. 10.3 hours

This role is partially covered by contractors.

Certified Nursing Assistant

Helps with daily care and mobility.

Total count 122
Average shift length Info Average shift length. Calculated as total hours divided by days worked and average staff per day. 8.1 hours

This role is partially covered by contractors.

Contractor staffing

Total hours from contractors

19.2%

7,091 contractor hours this quarter

Certified Nursing Assistant: 68 Licensed Practical Nurse: 37 Respiratory Therapy Technician: 7 Registered Nurse: 4 Physical Therapy Assistant: 3 Physical Therapy Aide: 3 Speech Language Pathologist: 3 Qualified Social Worker: 2 Medical Director: 1 Occupational Therapy Assistant: 1
Staff by category
Certified Nursing Assistant546812217,43691100%8.1
Licensed Practical Nurse1537527,26591100%10.3
Registered Nurse164202,49591100%9.8
RN Director of Nursing4042,0809099%9.4
Clinical Nurse Specialist2029187582%7.8
Respiratory Therapy Technician0779168695%4.1
Other Dietary Services Staff2029168290%7.9
Qualified Social Worker0228906673%7
Speech Language Pathologist0335667279%7
Physical Therapy Aide0335256875%7.4
Administrator1015206571%8
Dental Services Staff1015075965%8.6
Mental Health Service Worker1014966268%8
Nurse Practitioner1014826268%7.8
Dietitian1014335662%7.7
Physical Therapy Assistant0333317785%4
Medical Director011631213%5.3
Occupational Therapy Assistant0113833%12.7
122 Certified Nursing Assistant
% of Days 100%
52 Licensed Practical Nurse
% of Days 100%
20 Registered Nurse
% of Days 100%
4 RN Director of Nursing
% of Days 99%
2 Clinical Nurse Specialist
% of Days 82%
7 Respiratory Therapy Technician
% of Days 95%
2 Other Dietary Services Staff
% of Days 90%
2 Qualified Social Worker
% of Days 73%
3 Speech Language Pathologist
% of Days 79%
3 Physical Therapy Aide
% of Days 75%
1 Administrator
% of Days 71%
1 Dental Services Staff
% of Days 65%
1 Mental Health Service Worker
% of Days 68%
1 Nurse Practitioner
% of Days 68%
1 Dietitian
% of Days 62%
3 Physical Therapy Assistant
% of Days 85%
1 Medical Director
% of Days 13%
1 Occupational Therapy Assistant
% of Days 3%

Facility Characteristics

Source: CMS Long-Term Care Facility Characteristics (Data as of Jan 2026)

Total residents 57
Medicare
15
26.3% of residents
Private pay or other
42
73.7% of residents
Programs & Services
Residents Group

Residents meet regularly to discuss policies, care quality, and activities

CCRC

Part of a Continuing Care Retirement Community offering multiple care levels

Active Resident Council

Organized group of residents that meets regularly to discuss facility policies, quality of life, and activities.

Quality of care over time

These measures show how residents usually do over time at this home, based on health outcomes and preventive care.

High-risk clinical events score Info A composite score based on pressure ulcers, falls with injury, weight loss, walking ability decline, and activities of daily living decline. 6.5
15% better than Arizona average

Arizona average: 7.6

Functional decline score Info A composite score based on activities of daily living decline, walking ability decline, and incontinence. 17.0
6% worse than Arizona average

Arizona average: 16.1

Long-stay resident measures
Significantly above average Arizona avg: 3.8 Info CMS star rating based on long-stay quality measure performance. 5 stars = significantly above average, 1 star = significantly below average.
Need for Help with Daily Activities Increased Info Percent of long-stay residents whose need for help with daily activities has increased 13.9%
23% worse than Arizona average

Arizona average: 11.2%

Walking Ability Worsened Info Percent of long-stay residents whose ability to move independently worsened 13.8%
13% better than Arizona average

Arizona average: 15.8%

Low Risk Residents with Bowel/Bladder Incontinence Info Percent of low risk long-stay residents who lose control of their bowels or bladder 23.3%
12% worse than Arizona average

Arizona average: 20.8%

Falls with Major Injury Info Percent of long-stay residents experiencing one or more falls with major injury 0.8%
60% better than Arizona average

Arizona average: 2.1%

High Risk Residents with Pressure Ulcers Info Percent of long-stay high risk residents with pressure ulcers 2.3%
55% better than Arizona average

Arizona average: 5.1%

Urinary Tract Infection Info Percent of long-stay residents with a urinary tract infection 1.7%
26% worse than Arizona average

Arizona average: 1.3%

Lost Too Much Weight Info Percent of long-stay residents who lose too much weight 1.5%
72% better than Arizona average

Arizona average: 5.4%

Depressive Symptoms Info Percent of long-stay residents who have depressive symptoms 0.0%
100% better than Arizona average

Arizona average: 4.5%

Antipsychotic Use Info Percent of long-stay residents who received an antipsychotic medication 5.9%
43% better than Arizona average

Arizona average: 10.3%

Pneumococcal Vaccine Info Percent of long-stay residents assessed and appropriately given the pneumococcal vaccine 99.2%
In line with Arizona average

Arizona average: 97.2%

Influenza Vaccine Info Percent of long-stay residents assessed and appropriately given the seasonal influenza vaccine 100.0%
6% better than Arizona average

Arizona average: 94.6%

Hospitalizations per 1,000 days Info Number of hospitalizations per 1,000 long-stay resident days. 1.78
6% worse than Arizona average

Arizona average: 1.68

ED visits per 1,000 days Info Number of outpatient emergency department visits per 1,000 long-stay resident days. 0.00
100% better than Arizona average

Arizona average: 1.48

Short-stay resident measures
Above average Arizona avg: 4.2 Info CMS star rating based on short-stay quality measure performance. 5 stars = much above average, 1 star = much below average.
Pneumococcal Vaccine Info Percent of short-stay residents assessed and appropriately given the pneumococcal vaccine 99.3%
9% better than Arizona average

Arizona average: 91.5%

Antipsychotic medication increase Info Percent of short-stay residents who newly received an antipsychotic medication 0.0%
100% better than Arizona average

Arizona average: 1.0%

Influenza Vaccine Info Percent of short-stay residents assessed and appropriately given the seasonal influenza vaccine 98.2%
12% better than Arizona average

Arizona average: 87.3%

Re-hospitalized after SNF stay Info Percentage of short-stay residents who were re-hospitalized after their nursing home admission. 25.4%
In line with Arizona average

Arizona average: 24.6%

Emergency department visits Info Percentage of short-stay residents who had an outpatient emergency department visit. 11.8%
10% worse than Arizona average

Arizona average: 10.7%

Falls with major injury Info Percentage of SNF residents who experience falls with major injury during their stay. 0.5%
36% better than Arizona average

Arizona average: 0.8%

Ability to care for self at discharge Info Percentage of residents at or above expected ability to care for themselves at discharge. 62.6%
17% better than Arizona average

Arizona average: 53.7%

Successful return to home or community Info Rate of successful return to home or community from a skilled nursing facility. 59.9%
18% better than Arizona average

Arizona average: 50.6%

Penalties and fines

Federal penalties imposed by CMS for regulatory violations, including civil money penalties (fines) and denials of payment for new Medicare/Medicaid admissions.

Source: CMS Penalties Database

Penalty History

Penalties are imposed by CMS for violations of federal nursing home regulations.

No penalties in the past 3 years

No civil money penalties or payment denials were reported in the last 3 years.

Compare Nursing Homes around Sun City West The information below is reported by the Arizona Department of Health Services, Bureau of Long Term Care Licensing.

1 facility compared · CMS & AZ Dept. of Health data · Updated Apr 2026

Filter by care type
Grandview Terrace Health & Rehabilitation Center
AL

Assisted Living A licensed, long-term care setting for seniors or individuals with disabilities who need help with daily activities — like bathing, dressing, and medication management — but not 24-hour skilled nursing. Offers housing, meals, and around-the-clock support while aiming to maximize resident independence.

IL

Independent Living Lifestyle-focused communities for older adults offering dining, activities, and transportation with minimal personal care. Best for active, independent seniors who want community without medical support.

MC

Memory Care Secured, specialized care for people living with Alzheimer's or dementia. Staff trained in cognitive impairment, with higher staff-to-resident ratios and an environment designed to reduce confusion and wandering risk.

NH

Nursing Home Licensed facility providing 24/7 skilled nursing care for residents with complex, ongoing medical needs. Staffed by RNs, LPNs, and CNAs. Inspected and star-rated annually by CMS. Accepts Medicare (short-term rehab) and Medicaid (long-term care).

Sun City West (West Granite Valley Drive)126 69.7% -4%5.00 -12%+23%0121.7062 42 Sun Health Grandview Terrace$11.1M$6.2M55.5%35265

Guides for Better Senior Living

Care Cost Calculator: See Prices in Your Area

Nursing Home Data Explorer

Don’t Wait Too Long: 7 Red Flag Signs Your Parent Needs Assisted Living Now

The True Cost of Assisted Living in 2025 – And How Families Are Paying For It

Understanding Senior Living Costs: Pricing Models, Discounts & Financial Assistance

Explore Open Rooms
1 Contact details
2 What type of senior care service are you looking for?
3 What budget do you have in mind for senior care?
4 How soon do you need to find care?
5 Additional details

Thank you for your interest!

Our team will be in touch shortly to help with next steps.