Gregston’s Nursing and Rehab
Nursing Home & Assisted Living · Marlow, OK
CMS overall rating Info CMS (the Centers for Medicare & Medicaid Services) is the federal agency that rates nursing home quality. Its Overall Rating runs from 1 to 5 stars, combining health inspections, staffing, and quality measures, with inspections weighted most heavily.

Gregston’s Nursing and Rehab

Nursing Home & Assisted Living · Marlow, OK
CMS overall rating Info CMS (the Centers for Medicare & Medicaid Services) is the federal agency that rates nursing home quality. Its Overall Rating runs from 1 to 5 stars, combining health inspections, staffing, and quality measures, with inspections weighted most heavily.
Calculator: See prices in your area
Gregston’s Nursing and Rehab accepts Medicare, Medicaid, and private pay.

Overview of Gregston’s Nursing and Rehab

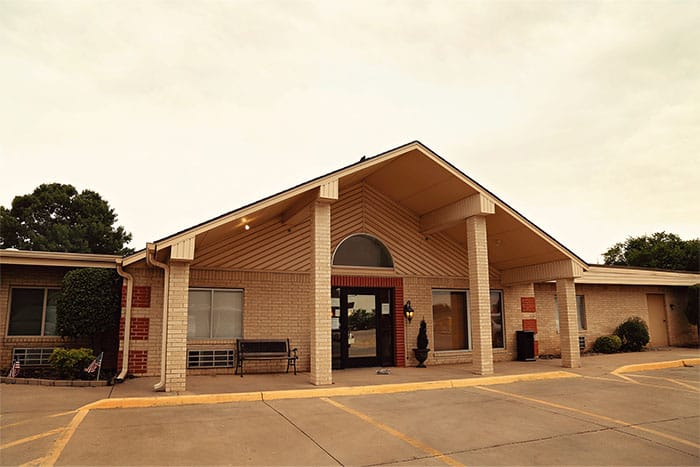
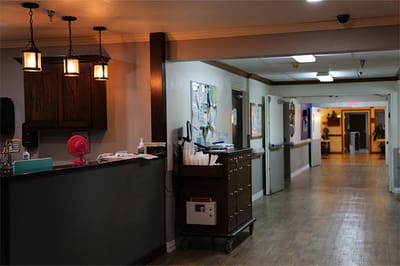
Gregston’s Nursing and Rehabilitation is a highly rated nursing home in Marlow, OK, offering assisted living, long-term care, rehabilitation, and skilled nursing. The community promotes a nurturing and welcoming environment, ensuring older adults can keep their peace of mind in retirement. 24-hour care, therapies, and nutritious meals are also offered to improve residents’ quality of life. Residents also receive the utmost attention and care through personalized care plans.

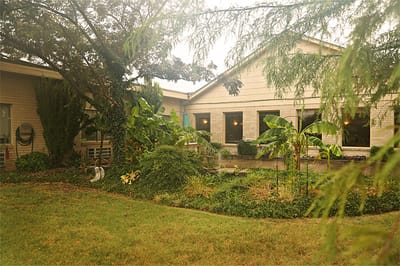
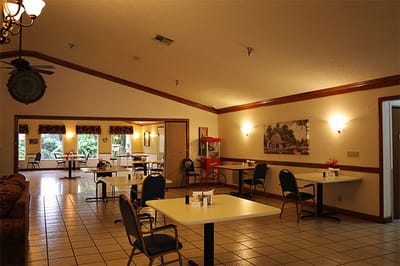
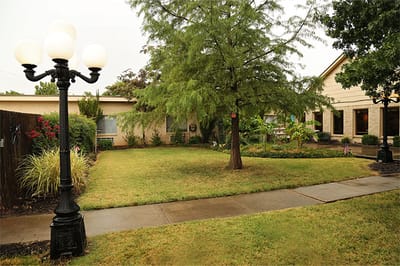
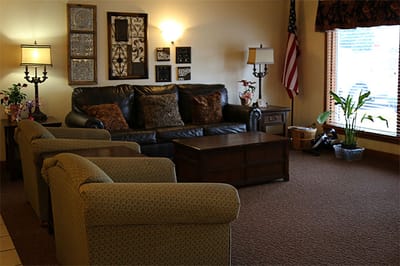
Holiday parties, gardening, and cooking classes ensure residents can continue learning and gain meaningful experiences. Cozy seating areas and spacious communal spaces are also available, so residents can freely connect with friends and relax. With its ideal location in the quiet residential area of Marlow, the community guarantees a laid-back retirement. This nursing home is a trusted choice for senior living in Oklahoma, especially with its commitment to helping older adults live to their potential in retirement.

Quality ratings

Measured by Centers for Medicare & Medicaid Services (CMS)

Overall rating Info The Overall CMS Rating combines results from health inspections, staffing levels and quality measures. Health inspections carry the most weight. Staffing and quality scores can increase or decrease the final rating based on performance compared to state and national standards.
▲ 52.2% Above OK avg. ▲ 52.2% Above OK avg.OK average: 2.6Click the badge to see the full State ranking.Click here to see the full State ranking.
Health Inspection Info Based on the results of the facility's three most recent standard inspections and any complaint investigations. CMS reviews the number, scope, and severity of deficiencies, with more recent findings weighted more heavily.
▲ 44.6% Above OK avg. ▲ 44.6% Above OK avg.OK average: 2.8Click the badge to see the full State ranking.Click here to see the full State ranking.
Staffing Info Measures average nursing staff hours per resident per day, including Registered Nurses (RNs) and total nursing staff. Ratings are adjusted based on the level of care residents require and are compared to state and national benchmarks.
▲ 54.1% Above OK avg. ▲ 54.1% Above OK avg.OK average: 2.6Click the badge to see the full State ranking.Click here to see the full State ranking.
Quality Measures Info Based on clinical and physical health indicators reported to CMS, such as hospital readmissions, falls, pressure ulcers, and improvements in mobility. These measures reflect how well residents' health needs are being managed.
▼ 29.3% Below OK avg. ▼ 29.3% Below OK avg.OK average: 2.8Click the badge to see the full State ranking.Click here to see the full State ranking.

Staffing hours breakdown

Info Daily nursing hours per resident by staff type, reported to CMS. Higher is generally better — compare this facility to state and national averages to see where staffing stands.

Hours per resident per day — compared to Oklahoma state averages

Total nursing care / resident Info This home is ranked 12th out of 51 homes in Oklahoma for nurse hours. Total adjusted nursing hours per resident per day, combining RN, LPN, and aide time. CMS adjusts this for case-mix so facilities can be fairly compared.
5h 26m per day
Rank #12 / 51Nurse hours — State benchmarkedThis home is ranked 12th out of 51 homes in Oklahoma. Shows adjusted nurse hours per resident per day benchmarked to the Oklahoma average, with a ranking across 51 Oklahoma facilities. More hours mean more direct care. The national average is about 3.5 hrs; below 3.0 is a red flag.Rankings are based only on facilities in Oklahoma that report data for that category. Facilities without available data are excluded from the ranking.Click the rank badge to see the full State ranking.Click here to see the full State ranking.
This facility Oklahoma avg (4h 34m per day)
vs Oklahoma avg
+19%

1 of 6 metrics below state avg

Standout metric LPN / LVN is +33% above state avg
Staff typeHours / Day / Residentvs state avg
Registered Nurse (RN) Info RNs hold the highest nursing license and can assess residents, interpret test results, and direct care plans. More RN hours per day often signals stronger clinical oversight and faster response to health changes. 24m per day ▲ 19% State avg: 20m per day · National avg: 41m per day
LPN / LVN Info Licensed Practical Nurses (LPNs) or Licensed Vocational Nurses (LVNs) deliver routine hands-on care — medication administration, wound dressing, and monitoring vital signs. They work under RN supervision and make up a large share of daily bedside care. 1h 14m per day ▲ 33% State avg: 56m per day · National avg: 52m per day
Nurse Aide Info Certified Nurse Aides (CNAs) provide the most direct day-to-day assistance: bathing, dressing, feeding, and mobility. Nurse aide hours are typically the largest staffing category and directly affect residents' quality of life. 3h 7m per day ▲ 21% State avg: 2h 34m per day · National avg: 2h 21m per day
Weekend Total Nursing Info Combined nursing hours (RN + LPN + Nurse Aide) per resident per day on weekends. Staffing often drops on weekends — this figure reveals whether the facility maintains adequate coverage outside of weekday hours. 4h 24m per day ▲ 26% State avg: 3h 29m per day · National avg: 3h 26m per day
Physical Therapist Info Hours per resident per day provided by licensed Physical Therapists (PTs) or PT Assistants. PT services help residents recover mobility after injury or illness and are especially important for post-acute (short-stay) rehabilitation. 0m per day ▼ 68% State avg: 1m per day · National avg: 4m per day
Weekend RN Info Registered nurse hours specifically on weekends. Facilities sometimes reduce RN presence on Saturdays and Sundays — a low weekend RN figure compared to weekday hours can indicate reduced clinical oversight when most administrative staff are absent. 21m per day ▲ 24% State avg: 17m per day · National avg: 29m per day

Capacity and availability

This home usually has availability

Similar occupancy to the Oklahoma average: 60.6%
Occupancy rate
61.4% Rank #108 / 132Occupancy rate — State benchmarkedThis home is ranked 108th out of 132 homes in Oklahoma. Shows this facility's occupancy rate versus the Oklahoma average, with its Statewide rank out of 132. Higher occupancy signals strong local demand and financial stability.Rankings are based only on facilities in Oklahoma that report data for that category. Facilities without available data are excluded from the ranking.Click the rank badge to see the full State ranking.Click here to see the full State ranking.
Avg. Length of Stay
154 days
Bed community size
96-bed community Rank #34 / 141Bed count — State benchmarkedThis home is ranked 34th out of 141 homes in Oklahoma. Shows this facility's certified or reported bed count compared to other Oklahoma facilities. Larger communities may offer more amenities, programs, and on-site services for residents and families.Rankings are based only on facilities in Oklahoma that report data for that category. Facilities without available data are excluded from the ranking.Click the rank badge to see the full State ranking.Click here to see the full State ranking.
A larger shared setting that may offer more common spaces and organized community services.
Walk Score
Walk Score: 51 / 100 Rank #65 / 208Walk Score — State benchmarkedThis home is ranked 65th out of 208 homes in Oklahoma. Shows how walkable this facility's neighborhood is compared to the average Walk Score across Oklahoma facilities. Higher scores benefit residents, families, and staff.Rankings are based only on facilities in Oklahoma that report data for that category. Facilities without available data are excluded from the ranking.Click the rank badge to see the full State ranking.Click here to see the full State ranking.
Moderately walkable. Some errands can be accomplished on foot, with a mix of nearby amenities.

Contact Gregston’s Nursing and Rehab

Staffing Data

Reporting period: October 1 – December 31, 2025 (Q4 2025). Source: CMS Payroll-Based Journal report.

Total staff 92
Employees 77
Contractors 15
Staff to resident ratio 1.70 : 1
6% more staff per resident than Oklahoma average
Oklahoma average ratio: 1.61 : 1 Oklahoma average ratio: 1.61 : 1See full Oklahoma ranking
Avg staff/day 33
Average shift 8.8 hours
7% better than Oklahoma average
Oklahoma average: 8.2 hours Oklahoma average shift: 8.2 hoursSee full Oklahoma ranking
Total staff hours (quarter) 26,617

Nursing staff breakdown

Q4 2025 · Oct 1 – Dec 31 More info This data comes from the CMS Payroll-Based Journal report covering October 1 – December 31, 2025.
Registered Nurse

Manages medical care and health needs.

RN Staff Info All 4 RN Staff are full-time employees. No contractors work on this role. 4
Average shift length Info Average shift length. Calculated as total hours divided by days worked and average staff per day. 7.2 hours
Licensed Practical Nurse

Assists with medical care and medications.

LPN Staff Info All 18 LPN Staff are full-time employees. No contractors work on this role. 18
Average shift length Info Average shift length. Calculated as total hours divided by days worked and average staff per day. 8.9 hours
Certified Nursing Assistant

Helps with daily care and mobility.

CNA Staff Info All 32 CNA Staff are full-time employees. No contractors work on this role. 32
Average shift length Info Average shift length. Calculated as total hours divided by days worked and average staff per day. 11 hours

Contractor staffing

Q4 2025 · Oct 1 – Dec 31 More info This data comes from the CMS Payroll-Based Journal report covering October 1 – December 31, 2025.

Total hours from contractors

5.1%

1,363 contractor hours this quarter

Physical Therapy Aide: 4 Speech Language Pathologist: 4 Qualified Social Worker: 1 Respiratory Therapy Technician: 1 Physical Therapy Assistant: 1 Medical Director: 1 Other Physician: 1 Occupational Therapy Aide: 1 Occupational Therapy Assistant: 1

Staff by category

Q4 2025 · Oct 1 – Dec 31 More info This data comes from the CMS Payroll-Based Journal report covering October 1 – December 31, 2025.
Certified Nursing Assistant3203210,13692100%11
Licensed Practical Nurse180186,16492100%8.9
Medication Aide/Technician100103,92992100%8.7
Nurse Aide in Training7071,3846773%11.5
Other Dietary Services Staff3031,2176672%7.4
Registered Nurse40495892100%7.2
Speech Language Pathologist0446096874%4.4
Physical Therapy Aide0445767885%5.2
Clinical Nurse Specialist1015094347%11.8
Nurse Practitioner1015026773%7.5
Administrator1014546065%7.6
Physical Therapy Assistant011342628%1.3
Medical Director011332123%1.5
Qualified Social Worker011303134%1
Respiratory Therapy Technician011262830%0.9
Occupational Therapy Assistant0112433%8
Occupational Therapy Aide0112144%5.1
Other Physician01113910%1.4
32 Certified Nursing Assistant
% of Days 100%
18 Licensed Practical Nurse
% of Days 100%
10 Medication Aide/Technician
% of Days 100%
7 Nurse Aide in Training
% of Days 73%
3 Other Dietary Services Staff
% of Days 72%
4 Registered Nurse
% of Days 100%
4 Speech Language Pathologist
% of Days 74%
4 Physical Therapy Aide
% of Days 85%
1 Clinical Nurse Specialist
% of Days 47%
1 Nurse Practitioner
% of Days 73%
1 Administrator
% of Days 65%
1 Physical Therapy Assistant
% of Days 28%
1 Medical Director
% of Days 23%
1 Qualified Social Worker
% of Days 34%
1 Respiratory Therapy Technician
% of Days 30%
1 Occupational Therapy Assistant
% of Days 3%
1 Occupational Therapy Aide
% of Days 4%
1 Other Physician
% of Days 10%

Penalties and fines

Federal penalties imposed by CMS for regulatory violations, including civil money penalties (fines) and denials of payment for new Medicare/Medicaid admissions.

Source: CMS Penalties Database

No penalties in the past 3 years

No civil money penalties or payment denials were reported in the last 3 years.

Quality of care over time

These measures show how residents usually do over time at this home, based on health outcomes and preventive care.

High-risk clinical events score Info A composite score based on pressure ulcers, falls with injury, weight loss, walking ability decline, and activities of daily living decline. 9.6
8% worse than Oklahoma average

Oklahoma average: 8.9

Functional decline score Info A composite score based on activities of daily living decline, walking ability decline, and incontinence. 18.6
14% worse than Oklahoma average

Oklahoma average: 16.3

Long-stay resident measures
Significantly below average Info CMS star rating based on long-stay quality measure performance. 5 stars = significantly above average, 1 star = significantly below average.
Need for Help with Daily Activities Increased Info Percent of long-stay residents whose need for help with daily activities has increased 18.8%
30% worse than Oklahoma average

Oklahoma average: 14.4%

Walking Ability Worsened Info Percent of long-stay residents whose ability to move independently worsened 16.1%
In line with Oklahoma average

Oklahoma average: 16.8%

Low Risk Residents with Bowel/Bladder Incontinence Info Percent of low risk long-stay residents who lose control of their bowels or bladder 21.1%
19% worse than Oklahoma average

Oklahoma average: 17.8%

Falls with Major Injury Info Percent of long-stay residents experiencing one or more falls with major injury 9.0%
106% worse than Oklahoma average

Oklahoma average: 4.4%

High Risk Residents with Pressure Ulcers Info Percent of long-stay high risk residents with pressure ulcers 1.1%
78% better than Oklahoma average

Oklahoma average: 5.2%

Urinary Tract Infection Info Percent of long-stay residents with a urinary tract infection 3.3%
10% worse than Oklahoma average

Oklahoma average: 3.0%

Lost Too Much Weight Info Percent of long-stay residents who lose too much weight 3.1%
18% better than Oklahoma average

Oklahoma average: 3.7%

Depressive Symptoms Info Percent of long-stay residents who have depressive symptoms 4.6%
37% worse than Oklahoma average

Oklahoma average: 3.3%

Antipsychotic Use Info Percent of long-stay residents who received an antipsychotic medication 22.8%
47% worse than Oklahoma average

Oklahoma average: 15.5%

Pneumococcal Vaccine Info Percent of long-stay residents assessed and appropriately given the pneumococcal vaccine 79.8%
12% worse than Oklahoma average

Oklahoma average: 90.6%

Influenza Vaccine Info Percent of long-stay residents assessed and appropriately given the seasonal influenza vaccine 91.5%
In line with Oklahoma average

Oklahoma average: 94.6%

Hospitalizations per 1,000 days Info Number of hospitalizations per 1,000 long-stay resident days. 3.93
72% worse than Oklahoma average

Oklahoma average: 2.28

ED visits per 1,000 days Info Number of outpatient emergency department visits per 1,000 long-stay resident days. 3.93
35% worse than Oklahoma average

Oklahoma average: 2.91

Short-stay resident measures
Below average Info CMS star rating based on short-stay quality measure performance. 5 stars = much above average, 1 star = much below average.
Pneumococcal Vaccine Info Percent of short-stay residents assessed and appropriately given the pneumococcal vaccine 25.0%
67% worse than Oklahoma average

Oklahoma average: 75.0%

Antipsychotic medication increase Info Percent of short-stay residents who newly received an antipsychotic medication 0.7%
66% better than Oklahoma average

Oklahoma average: 2.0%

Influenza Vaccine Info Percent of short-stay residents assessed and appropriately given the seasonal influenza vaccine 25.8%
65% worse than Oklahoma average

Oklahoma average: 74.0%

Re-hospitalized after SNF stay Info Percentage of short-stay residents who were re-hospitalized after their nursing home admission. 30.5%
13% worse than Oklahoma average

Oklahoma average: 27.0%

Emergency department visits Info Percentage of short-stay residents who had an outpatient emergency department visit. 22.4%
31% worse than Oklahoma average

Oklahoma average: 17.1%

Falls with major injury Info Percentage of SNF residents who experience falls with major injury during their stay. 2.3%
195% worse than Oklahoma average

Oklahoma average: 0.8%

Ability to care for self at discharge Info Percentage of residents at or above expected ability to care for themselves at discharge. 56.7%
6% better than Oklahoma average

Oklahoma average: 53.7%

Successful return to home or community Info Rate of successful return to home or community from a skilled nursing facility. 56.0%
11% better than Oklahoma average

Oklahoma average: 50.6%

Breakdown by payment type

Medicare

55% of new residents, usually for short-term rehab.

Typical stay 1 - 2 months

Private pay

26% of new residents, often for short stays.

Typical stay 4 - 5 months

Medicaid

19% of new residents, often for long-term daily care.

Typical stay 1 years

Facility Characteristics

Source: CMS Long-Term Care Facility Characteristics (Data as of Jan 2026)

Total residents 54
Medicare
13
24.1% of residents
Medicaid
28
51.9% of residents
Private pay or other
13
24.1% of residents
Programs & Services
Residents Group

Residents meet regularly to discuss policies, care quality, and activities

Nurse Aide Training

State-approved Nurse Aide Training and Competency Evaluation Program on-site

Active Resident Council

Organized group of residents that meets regularly to discuss facility policies, quality of life, and activities.

Finances and operations

Based on CMS SNF Cost Report for fiscal year ending in 12/2023.

For-profit
Corporation
Net patient revenue Info Net patient revenue — what the home actually collects for resident care, after contractual allowances, bad debt and discounts are subtracted from its gross charges (CMS cost report, Worksheet G-3). It covers resident care only; money the home earns from other sources is shown separately as "Other income."
$5.5M
Net patient income Info Net patient income: net patient revenue minus the home's total operating expenses. A positive figure means it earns more from resident care than it spends to deliver it; a negative figure means the opposite. It excludes non-operating "other income."
$173.6K
For-profit Corporation
Net patient revenue Info Net patient revenue — what the home actually collects for resident care, after contractual allowances, bad debt and discounts are subtracted from its gross charges (CMS cost report, Worksheet G-3). It covers resident care only; money the home earns from other sources is shown separately as "Other income."
$5.5M Rank #41 / 55Revenue — State benchmarkedThis home is ranked 41st out of 55 homes in Oklahoma. Shows this facility's annual revenue compared to the Oklahoma average. Higher revenue generally means more resources for staffing and capital — read alongside Payroll %.Rankings are based only on facilities in Oklahoma that report data for that category. Facilities without available data are excluded from the ranking.Click the rank badge to see the full State ranking.Click here to see the full State ranking.
Net patient income Info Net patient income: net patient revenue minus the home's total operating expenses. A positive figure means it earns more from resident care than it spends to deliver it; a negative figure means the opposite. It excludes non-operating "other income."
$173.6K
Payroll costs Info Staff salaries plus wage-related costs — benefits such as payroll taxes, health insurance and retirement — from the home's own accounting records (CMS cost report, Worksheet A). Contract or agency labor is counted separately, under other operating costs. Rank #41 / 55Payroll — State benchmarkedThis home is ranked 41st out of 55 homes in Oklahoma. Shows total annual staff payroll benchmarked to the Oklahoma average. Higher payroll investment relative to peers often signals better staffing and less reliance on cheaper contract labor.Rankings are based only on facilities in Oklahoma that report data for that category. Facilities without available data are excluded from the ranking.Click the rank badge to see the full State ranking.Click here to see the full State ranking.
$2.6M 46.8% of net patient revenue Info Payroll as a share of revenue: staff salaries and wage-related benefits divided by net patient revenue. A higher figure means more of each revenue dollar goes to staff pay. Rank #19 / 55Payroll % — State benchmarkedThis home is ranked 19th out of 55 homes in Oklahoma. Shows payroll as a percentage of revenue versus the Oklahoma average. Well-run Oklahoma facilities typically land around 55–61% — the top third Statewide. Below 25% may signal understaffing or heavy agency use — read with Staffing ratings.Rankings are based only on facilities in Oklahoma that report data for that category. Facilities without available data are excluded from the ranking.Click the rank badge to see the full State ranking.Click here to see the full State ranking.
Other operating costs Info Everything it costs to run the home apart from payroll — food, utilities, supplies, maintenance, contract labor and administration. Calculated as total operating expense minus payroll (staff salaries and wage-related benefits).
$2.8M
Total costs Info The home's total operating expense for the year — all the costs of running it, salaries included (CMS cost report, Worksheet G-3).
$5.4M

Who this home usually serves

TYPE OF STAY

Mostly short-term rehab stays

Most residents typically stay for a few weeks or months before returning home or moving on.

Most new residents arrive under Medicare (55% of admissions), and a typical Medicare stay runs around 1 - 2 months.

Admissions
149 total

Coverage residents most often arrive under.

Medicare 55%
Private pay 26%
Medicaid 19%
Discharges
130 total

Coverage residents most often leave under.

Medicare 55%
Private pay 27%
Medicaid 19%

Places of interest near Gregston’s Nursing and Rehab

Address 0.6 miles from city center Info Estimated distance in miles from Marlow's city center to Gregston’s Nursing and Rehab's address, calculated via Google Maps.

Calculate Travel Distance to Gregston’s Nursing and Rehab

Add your location

Address

Compare Nursing Homes around Duncan

The information below is reported by the Oklahoma State Department of Health, Protective Health Services.

3 facilities compared · CMS & OK Dept. of Health data

Meridian Nursing Home
NH
HC
MC
RC
Comanche
63
Facility 63
OK AVG 74
Rank #78 / 141
76.2%
Facility 76.2%
OK AVG 60.6%
Rank #65 / 132
+26%
3.96
Facility 3.96
OK AVG 4.57
Rank #39 / 51
-22%-13%
$0
Facility $0
OK AVG $48.8k
Rank #1 / 53
1
Facility 1
OK AVG 23.5
Rank #1 / 53
1.0
Facility 1.0
OK AVG 5.0
Rank #1 / 53
-45-
0
Facility 0
OK AVG 38
Rank #200 / 208
Washita Valley Investments LLC
$3.9M
Facility $3.9M
OK AVG $6.4M
Rank #47 / 55
$2.6M
Facility $2.6M
OK AVG $2.8M
Rank #44 / 55
66.5%
Facility 66.5%
OK AVG 47.7%
Rank #12 / 55
375426
Gregston’s Nursing and Rehab
NH
AL
Marlow
96
Facility 96
OK AVG 74
Rank #34 / 141
61.4%
Facility 61.4%
OK AVG 60.6%
Rank #108 / 132
+1%
5.43
Facility 5.43
OK AVG 4.57
Rank #12 / 51
-29%+19%
$0
Facility $0
OK AVG $48.8k
Rank #1 / 53
6
Facility 6
OK AVG 23.5
Rank #6 / 53
3.0
Facility 3.0
OK AVG 5.0
Rank #17 / 53
-54-
51
Facility 51
OK AVG 38
Rank #65 / 208
Jeff Gregston
$5.5M
Facility $5.5M
OK AVG $6.4M
Rank #41 / 55
$2.6M
Facility $2.6M
OK AVG $2.8M
Rank #41 / 55
46.8%
Facility 46.8%
OK AVG 47.7%
Rank #19 / 55
375425
Wilkins Health & Rehabilitation Community
NH
MC
Duncan (Dixie Park)
118
Facility 118
OK AVG 74
Rank #18 / 141
93.0%
Facility 93.0%
OK AVG 60.6%
Rank #10 / 132
+53%
5.35
Facility 5.35
OK AVG 4.57
Rank #12 / 51
-4%+17%
$0
Facility $0
OK AVG $48.8k
Rank #1 / 53
9
Facility 9
OK AVG 23.5
Rank #10 / 53
1.5
Facility 1.5
OK AVG 5.0
Rank #2 / 53
-114-
1
Facility 1
OK AVG 38
Rank #197 / 208
Tyler Wilkins
$9.9M
Facility $9.9M
OK AVG $6.4M
Rank #28 / 55
$5.4M
Facility $5.4M
OK AVG $2.8M
Rank #19 / 55
54.7%
Facility 54.7%
OK AVG 47.7%
Rank #10 / 55
375424

Financial Assistance for
Nursing Home in Oklahoma

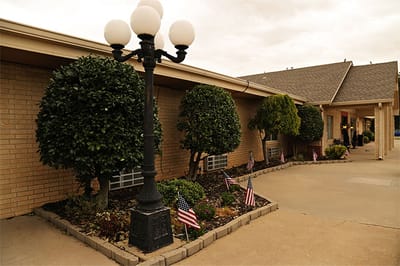
Gregston’s Nursing and Rehab is located in Marlow, Oklahoma.
Here are the financial assistance programs available to residents in Oklahoma.

Get Financial aid guidance

ADvantage Waiver

Oklahoma Medicaid ADvantage

Age 65+ or disabled
General Oklahoma resident, Medicaid- eligible, nursing home-level care need.
Income Limits (2025) ~$2,829/month 300% FBR, individual
Asset Limits $2,000 (individual), $3,000 (couple).
OK

High rural demand; waitlists possible.

Benefits
Personal care (5-7 hours/day) Respite (240 hours/year) Adult day care ($60/day) Home modifications ($1,500 avg.)

Oklahoma Respite Voucher Program

OK Respite Vouchers

Age Caregiver of someone 60+
General Oklahoma resident.
Income Limits ~$2,500/month individual, varies
Asset Limits $40,000 individual
OK

Limited vouchers; rural focus.

Benefits
In-home respite (up to 30 days/year) Adult day care (~$60/day) Facility respite (up to 5 days)

Personal Care Program

Oklahoma Personal Care Program

Age 65+ (or disabled)
General OK resident, Medicaid-eligible, need help with 1+ ADL.
Income Limits (2025) ~$1,255/month (100% FPL, individual); QIT optional.
Asset Limits $2,000 (individual), $3,000 (couple).
OK

No NFLOC required (less stringent than ADvantage); statewide via SoonerCare.

Benefits
Personal care (5-20 hours/week) Bathing Grooming Light housekeeping Meal prep

Older Americans Act (OAA) Services

Oklahoma OAA Services

Age 60+
General OK resident (or spouse of any age); no income/asset limits.
Income Limits (2025) None; donations encouraged for some services.
Asset Limits Not assessed.
OK

11 AAAs; services vary by region (e.g., urban vs. rural).

Benefits
Meals (home-delivered or congregate, ~$5-$7/meal value) Transportation Homemaker services (~4 hours/week) Respite (~5 days/year) Legal aid

Medicare Savings Program (MSP)

Oklahoma Medicare Savings Program

Age 65+ or disabled
General OK resident, Medicare Part A/B.
Income Limits (2025) ~$2,510/month (QMB), ~$3,380/month (SLMB), ~$3,598/month (QI)—individual.
Asset Limits $9,430 (individual), $14,130 (couple).
OK

Three tiers; includes Extra Help for Part D; no waitlist.

Benefits
Covers Part B premiums ($174.70/month) Deductibles ($240/year) Copays (~20%)

VA Aid and Attendance (A&A) and Housebound Benefits

Oklahoma VA Aid and Attendance/Housebound

Age 65+ or disabled veteran/spouse
General OK resident, wartime service, need for ADL help (A&A) or homebound.
Income Limits (2025) Net income < ~$1,984/month (veteran with dependent, A&A); pension offsets income.
Asset Limits ~$155,356 net worth limit
OK

High veteran population; supports rural/urban care needs.

Benefits
Cash (~$1,433-$2,642/month veteran, ~$951-$1,318 spouse) for care costs (e.g., in-home, assisted living)

Senior Farmers’ Market Nutrition Program (SFMNP)

Oklahoma SFMNP

Age 60+
General OK resident, low-income.
Income Limits (2025) ~$2,322/month individual, 185% FPL
Asset Limits Not assessed.
OK

Vouchers (~$50/season) via 11 AAAs; farmers’ market focus.

Benefits
Vouchers (~$50/season) for fresh produce at approved markets

Property Tax Exemption for Seniors

Oklahoma Senior Property Tax Exemption

Age 65+
General OK resident, homeowner, low-income.
Income Limits (2025) ~$25,000/year individual, adjusted annually
Asset Limits Not assessed; home value < $1M.
OK

Exemption up to $1,000 of assessed value; homestead required.

Benefits
Tax reduction (~$100-$200/year avg., varies by county)

Frequently Asked Questions about Gregston’s Nursing and Rehab

Is Gregston’s Nursing and Rehab in a walkable area?

Gregston’s Nursing and Rehab has a walk score of 51. Moderately walkable. Some errands can be accomplished on foot, with a mix of nearby amenities.

What is the occupancy rate at Gregston’s Nursing and Rehab?

Gregston’s Nursing and Rehab's occupancy is 61.4%.

Does Gregston’s Nursing and Rehab operate as a for-profit or non-profit?

Gregston’s Nursing and Rehab is registered as a for-profit.

Are there photos of Gregston’s Nursing and Rehab?

Yes — there are 7 photos of Gregston’s Nursing and Rehab in the photo gallery on this page.

What is the address of Gregston’s Nursing and Rehab?

Gregston’s Nursing and Rehab is located at 711 S Broadway St, Marlow, OK 73055.

What is the phone number of Gregston’s Nursing and Rehab?

(580) 658-2319 will put you in contact with the team at Gregston’s Nursing and Rehab.

Is Gregston’s Nursing and Rehab Medicare or Medicaid certified?

Yes — Gregston’s Nursing and Rehab is a CMS-certified provider of Medicare and Medicaid.

Guides for Better Senior Living

Care Cost Calculator: See Prices in Your Area

Nursing Home Data Explorer

Don’t Wait Too Long: 7 Red Flag Signs Your Parent Needs Assisted Living Now

The True Cost of Assisted Living in 2025 – And How Families Are Paying For It

Understanding Senior Living Costs: Pricing Models, Discounts & Financial Assistance