Hallmark Manor
CMS overall rating Info CMS (the Centers for Medicare & Medicaid Services) is the federal agency that rates nursing home quality. Its Overall Rating runs from 1 to 5 stars, combining health inspections, staffing, and quality measures, with inspections weighted most heavily.

Hallmark Manor

CMS overall rating Info CMS (the Centers for Medicare & Medicaid Services) is the federal agency that rates nursing home quality. Its Overall Rating runs from 1 to 5 stars, combining health inspections, staffing, and quality measures, with inspections weighted most heavily.
Calculator: See prices in your area
Hallmark Manor accepts Medicare, Medicaid, and private pay.

Overview of Hallmark Manor

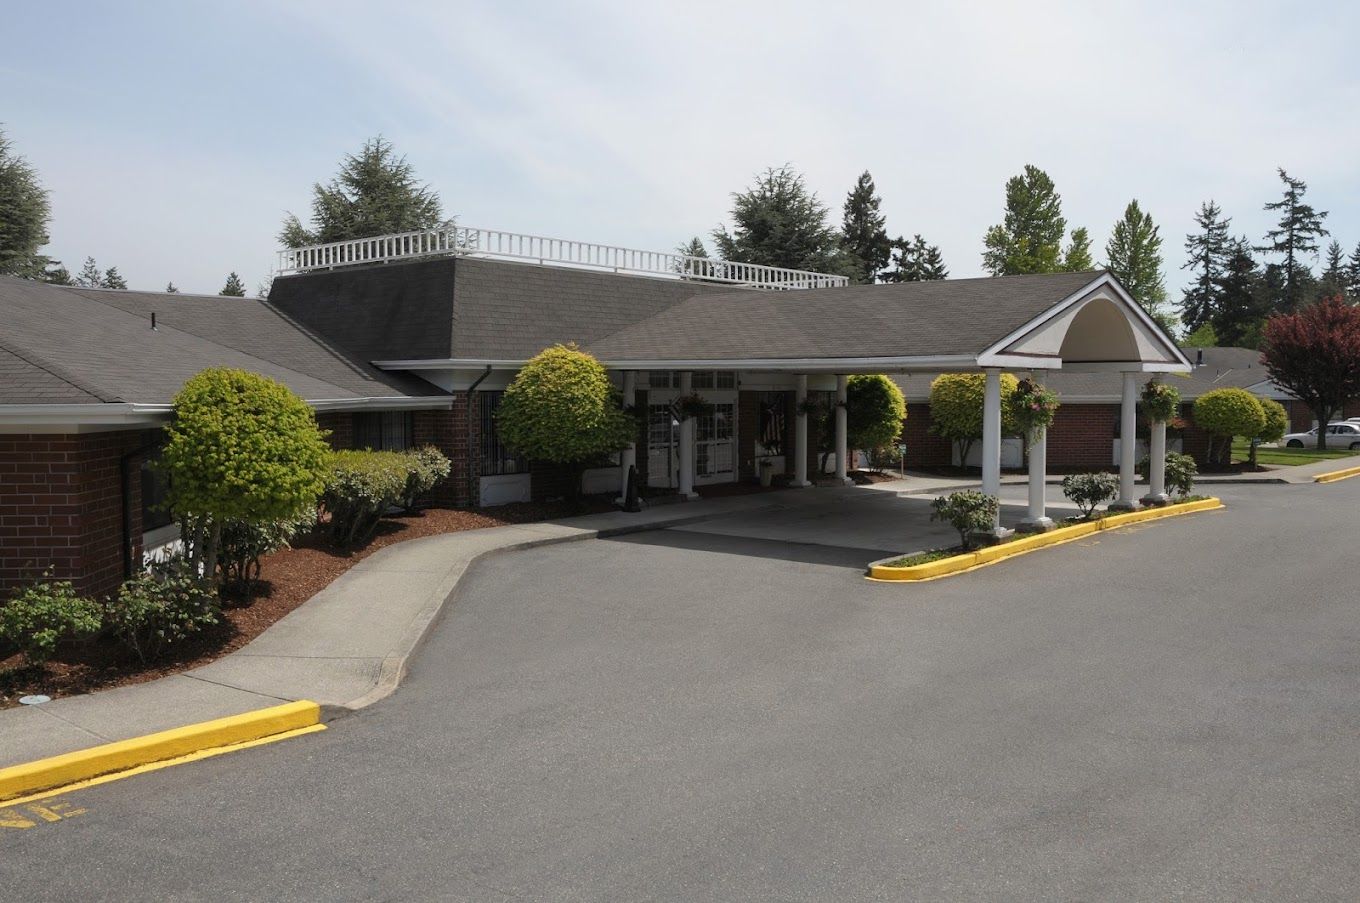
Hallmark Manor, a distinguished healthcare center in Federal Way, Washington, renowned for its exceptional skilled nursing and rehabilitation services. What sets Hallmark Manor apart is its unwavering commitment to quality care, whether it’s short-term rehabilitation, long-term care, or postoperative recovery. The facility boasts a highly competent nursing team equipped with state-of-the-art technology and innovative techniques, ensuring the utmost comfort for every patient.

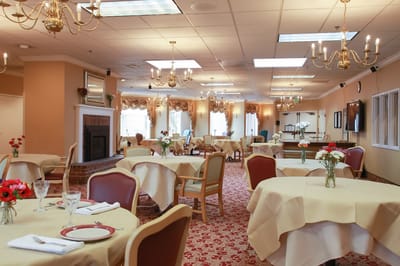
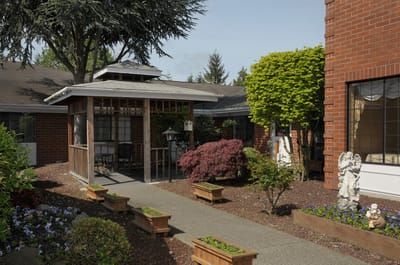
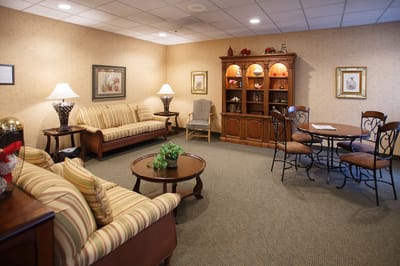
Hallmark Manor also prides itself on individualized care plans, tailoring their services to meet the unique needs of each resident. Beyond the expert care, the community exudes a warm and inviting atmosphere. Residents can enjoy the serene outdoor spaces, basking in the sun’s glow. Discover the ideal home for recovery at Hallmark Manor, where compassionate nursing home care meets a welcoming ambiance, just around the corner from you.

Quality ratings

Measured by Centers for Medicare & Medicaid Services (CMS)

Overall rating Info The Overall CMS Rating combines results from health inspections, staffing levels and quality measures. Health inspections carry the most weight. Staffing and quality scores can increase or decrease the final rating based on performance compared to state and national standards.
▼ 7.0% Below WA avg. ▼ 7.0% Below WA avg.WA average: 3.2Click the badge to see the full State ranking.Click here to see the full State ranking.
Health Inspection Info Based on the results of the facility's three most recent standard inspections and any complaint investigations. CMS reviews the number, scope, and severity of deficiencies, with more recent findings weighted more heavily.
▲ 6.5% Above WA avg. ▲ 6.5% Above WA avg.WA average: 2.8Click the badge to see the full State ranking.Click here to see the full State ranking.
Staffing Info Measures average nursing staff hours per resident per day, including Registered Nurses (RNs) and total nursing staff. Ratings are adjusted based on the level of care residents require and are compared to state and national benchmarks.
▼ 12.4% Below WA avg. ▼ 12.4% Below WA avg.WA average: 3.4Click the badge to see the full State ranking.Click here to see the full State ranking.
Quality Measures Info Based on clinical and physical health indicators reported to CMS, such as hospital readmissions, falls, pressure ulcers, and improvements in mobility. These measures reflect how well residents' health needs are being managed.
▲ 1.7% Above WA avg. ▲ 1.7% Above WA avg.WA average: 3.9Click the badge to see the full State ranking.Click here to see the full State ranking.

Staffing hours breakdown

Info Daily nursing hours per resident by staff type, reported to CMS. Higher is generally better — compare this facility to state and national averages to see where staffing stands.

Hours per resident per day — compared to Washington state averages

Total nursing care / resident Info This home is ranked 67th out of 90 homes in Washington for nurse hours. Total adjusted nursing hours per resident per day, combining RN, LPN, and aide time. CMS adjusts this for case-mix so facilities can be fairly compared.
3h 41m per day
Rank #67 / 90Nurse hours — State benchmarkedThis home is ranked 67th out of 90 homes in Washington. Shows adjusted nurse hours per resident per day benchmarked to the Washington average, with a ranking across 90 Washington facilities. More hours mean more direct care. The national average is about 3.5 hrs; below 3.0 is a red flag.Rankings are based only on facilities in Washington that report data for that category. Facilities without available data are excluded from the ranking.Click the rank badge to see the full State ranking.Click here to see the full State ranking.
This facility Washington avg (4h 13m per day)
vs Washington avg
-13%

6 of 6 metrics below state avg

Staff type Hours / Day / Resident vs state avg
Registered Nurse (RN) Info RNs hold the highest nursing license and can assess residents, interpret test results, and direct care plans. More RN hours per day often signals stronger clinical oversight and faster response to health changes. 45m per day ▼ 16% State avg: 53m per day · National avg: 41m per day
LPN / LVN Info Licensed Practical Nurses (LPNs) or Licensed Vocational Nurses (LVNs) deliver routine hands-on care — medication administration, wound dressing, and monitoring vital signs. They work under RN supervision and make up a large share of daily bedside care. 44m per day ▼ 10% State avg: 49m per day · National avg: 52m per day
Nurse Aide Info Certified Nurse Aides (CNAs) provide the most direct day-to-day assistance: bathing, dressing, feeding, and mobility. Nurse aide hours are typically the largest staffing category and directly affect residents' quality of life. 2h 17m per day ▼ 15% State avg: 2h 41m per day · National avg: 2h 21m per day
Weekend Total Nursing Info Combined nursing hours (RN + LPN + Nurse Aide) per resident per day on weekends. Staffing often drops on weekends — this figure reveals whether the facility maintains adequate coverage outside of weekday hours. 3h 18m per day ▼ 13% State avg: 3h 47m per day · National avg: 3h 26m per day
Physical Therapist Info Hours per resident per day provided by licensed Physical Therapists (PTs) or PT Assistants. PT services help residents recover mobility after injury or illness and are especially important for post-acute (short-stay) rehabilitation. 0m per day ▼ 92% State avg: 5m per day · National avg: 4m per day
Weekend RN Info Registered nurse hours specifically on weekends. Facilities sometimes reduce RN presence on Saturdays and Sundays — a low weekend RN figure compared to weekday hours can indicate reduced clinical oversight when most administrative staff are absent. 32m per day ▼ 15% State avg: 38m per day · National avg: 29m per day

Capacity and availability

This home usually has availability

Lower occupancy than the Washington average: 72.5%
Occupancy rate
62.6% Rank #238 / 310Occupancy rate — State benchmarkedThis home is ranked 238th out of 310 homes in Washington. Shows this facility's occupancy rate versus the Washington average, with its Statewide rank out of 310. Higher occupancy signals strong local demand and financial stability.Rankings are based only on facilities in Washington that report data for that category. Facilities without available data are excluded from the ranking.Click the rank badge to see the full State ranking.Click here to see the full State ranking.
Avg. Length of Stay
115 days
Bed community size
147-bed community Rank #19 / 366Bed count — State benchmarkedThis home is ranked 19th out of 366 homes in Washington. Shows this facility's certified or reported bed count compared to other Washington facilities. Larger communities may offer more amenities, programs, and on-site services for residents and families.Rankings are based only on facilities in Washington that report data for that category. Facilities without available data are excluded from the ranking.Click the rank badge to see the full State ranking.Click here to see the full State ranking.
A larger shared setting that may offer more common spaces and organized community services.
Years in operation
39 years in operation
A longer operating history, which may indicate experience navigating regulations and delivering ongoing care.
Walk Score
Walk Score: 43 / 100 Rank #387 / 628Walk Score — State benchmarkedThis home is ranked 387th out of 628 homes in Washington. Shows how walkable this facility's neighborhood is compared to the average Walk Score across Washington facilities. Higher scores benefit residents, families, and staff.Rankings are based only on facilities in Washington that report data for that category. Facilities without available data are excluded from the ranking.Click the rank badge to see the full State ranking.Click here to see the full State ranking.
Somewhat walkable. A few nearby services may be reachable on foot, but most trips require transportation.
BBB Rating
BBB Rating: A+ (Not Accredited)
An independent rating from the Better Business Bureau based on factors such as complaint history, transparency, and business practices.
How BBB ratings work

About this community

License Details

CMS Certification Number505313

Staffing

Key information about the people who lead and staff this community.

Leadership

ContactDavid Masterjohn, Executive Director

Contact Hallmark Manor

Inspection History

In Washington, the Department of Social and Health Services, Residential Care Services conducts unannounced inspections and issues reports on the quality of care in all licensed settings.

Since 2022 · 4 years of data 55 deficiencies

Inspection Scorecard Info This scorecard compares key inspection, deficiency, and complaint metrics at this facility against the Washington state average. Metrics rated ≥15% worse than average are highlighted in red; those ≥15% better are highlighted in green.

Since 2022 vs. Washington state average
Overall vs. WA average 2 Worse Metrics worse than Washington average:
• Total deficiencies (77% above)
• Deficiencies per year (77% above)
0 Better No metrics in this bucket.
Latest Inspection May 13, 2025 Routine

Deficiencies Info Deficiencies are formal regulatory issues recorded during state inspections.

This Facility WA Average vs. WA Avg
Total deficiencies Info Formal regulatory issues recorded by inspectors across all inspection types. 55 31 This facility has 77% more total deficiencies than a typical Washington nursing home (55 vs. WA avg 31).↑ 77% worse
Deficiencies per year Info Average deficiencies per year since 2022. 13.8 7.8 This facility has 77% more deficiencies per year than a typical Washington nursing home (13.8 vs. WA avg 7.8).↑ 77% worse

Inspection Reports Summary Info An editor-reviewed summary of the themes and findings across this facility's recent inspection reports.

  • May 13, 2025 routine inspection found 15 deficiencies including failure in Medicare notices, care planning, medication management, infection control, and providing palatable meals.
  • June 12, 2024 complaint investigation confirmed inadequate pressure ulcer care causing a resident’s wound to worsen and require above-the-knee amputation.
  • May 10, 2024 complaint investigation found delayed abuse allegation response and improper COVID-19 testing documentation, but no immediate jeopardy was cited.

Health Inspection History

Inspections since 2022
Total health inspections 6

Washington average 7.8


Last Health inspection on May 2025

Total health citations
59 Rank #58 / 92Health citations — State benchmarkedThis home is ranked 58th out of 92 homes in Washington. Shows this facility's total health deficiency citations benchmarked to the Washington State average, with a ranking across all 92 WA facilities. Lower citation counts earn a better rank.Rankings are based only on facilities in Washington that report data for that category. Facilities without available data are excluded from the ranking.Click the rank badge to see the full State ranking.Click here to see the full State ranking.

Washington average 48.9

Citations per inspection
9.83 Rank #72 / 92Citations per inspection — State benchmarkedThis home is ranked 72nd out of 92 homes in Washington. Shows average deficiency citations per CMS inspection for this facility versus the Washington mean across 92 facilities with citation data. Lower is better.Rankings are based only on facilities in Washington that report data for that category. Facilities without available data are excluded from the ranking.Click the rank badge to see the full State ranking.Click here to see the full State ranking.

Washington average 6.92


Health citations are formal notices following inspections when they fail to comply with safety and care standards.

54 of 59 citations resulted from standard inspections; and 5 of 59 resulted from complaint investigations.

Breakdown of citation severity (last 4 years)
Critical health citations
0
100% better than Washington average

Washington average: 0.3


Serious health citations
1
41% better than Washington average

Washington average: 1.7

0 critical citations Washington average: 0.3

1 serious citation Washington average: 1.7

58 moderate citations Washington average: 46.3

0 minor citations Washington average: 0.5
Citations history (last 4 years)
Infection Control moderate citation May 13, 2025
Corrected

Nutrition moderate citation May 13, 2025
Corrected

Pharmacy moderate citation May 13, 2025
Corrected

Pharmacy moderate citation May 13, 2025
Corrected

Staffing Data

Reporting period: October 1 – December 31, 2025 (Q4 2025). Source: CMS Payroll-Based Journal report.

Total staff 158
Employees 153
Contractors 5
Staff to resident ratio 1.61 : 1
13% fewer staff per resident than Washington average
Washington average ratio: 1.86 : 1 Washington average ratio: 1.86 : 1See full Washington ranking
Avg staff/day 52
Average shift 8.1 hours
0% compared with Washington average
Washington average: 8.1 hours Washington average shift: 8.1 hoursSee full Washington ranking
Total staff hours (quarter) 38,723

Nursing staff breakdown

Q4 2025 · Oct 1 – Dec 31 More info This data comes from the CMS Payroll-Based Journal report covering October 1 – December 31, 2025.
Registered Nurse

Manages medical care and health needs.

RN Staff Info All 21 RN Staff are full-time employees. No contractors work on this role. 21
Average shift length Info Average shift length. Calculated as total hours divided by days worked and average staff per day. 10.1 hours
Licensed Practical Nurse

Assists with medical care and medications.

LPN Staff Info All 23 LPN Staff are full-time employees. No contractors work on this role. 23
Average shift length Info Average shift length. Calculated as total hours divided by days worked and average staff per day. 9.7 hours
Certified Nursing Assistant

Helps with daily care and mobility.

CNA Staff Info All 73 CNA Staff are full-time employees. No contractors work on this role. 73
Average shift length Info Average shift length. Calculated as total hours divided by days worked and average staff per day. 7.8 hours

Contractor staffing

Q4 2025 · Oct 1 – Dec 31 More info This data comes from the CMS Payroll-Based Journal report covering October 1 – December 31, 2025.

Total hours from contractors

1%

371 contractor hours this quarter

Occupational Therapy Aide: 2 Occupational Therapy Assistant: 2 Medical Director: 1

Staff by category

Q4 2025 · Oct 1 – Dec 31 More info This data comes from the CMS Payroll-Based Journal report covering October 1 – December 31, 2025.
Certified Nursing Assistant 73 0 73 20,572 92 100% 7.8
Licensed Practical Nurse 23 0 23 5,844 92 100% 9.7
Registered Nurse 21 0 21 5,543 92 100% 10.1
RN Director of Nursing 3 0 3 889 69 75% 6.2
Speech Language Pathologist 9 0 9 712 70 76% 6
Clinical Nurse Specialist 2 0 2 709 75 82% 7.3
Dental Services Staff 3 0 3 609 58 63% 9
Other Dietary Services Staff 3 0 3 546 68 74% 7.5
Administrator 1 0 1 528 66 72% 8
Nurse Practitioner 1 0 1 512 64 70% 8
Mental Health Service Worker 2 0 2 494 51 55% 9.1
Dietitian 1 0 1 413 52 57% 7.9
Physical Therapy Aide 3 0 3 308 64 70% 4.6
Occupational Therapy Aide 0 2 2 277 55 60% 5
Nurse Aide in Training 2 0 2 263 30 33% 7.7
Physical Therapy Assistant 2 0 2 227 41 45% 5.4
Qualified Social Worker 1 0 1 127 50 54% 2.5
Respiratory Therapy Technician 3 0 3 57 15 16% 3.4
Occupational Therapy Assistant 0 2 2 54 5 5% 9
Medical Director 0 1 1 41 3 3% 13.5
73 Certified Nursing Assistant
% of Days 100%
23 Licensed Practical Nurse
% of Days 100%
21 Registered Nurse
% of Days 100%
3 RN Director of Nursing
% of Days 75%
9 Speech Language Pathologist
% of Days 76%
2 Clinical Nurse Specialist
% of Days 82%
3 Dental Services Staff
% of Days 63%
3 Other Dietary Services Staff
% of Days 74%
1 Administrator
% of Days 72%
1 Nurse Practitioner
% of Days 70%
2 Mental Health Service Worker
% of Days 55%
1 Dietitian
% of Days 57%
3 Physical Therapy Aide
% of Days 70%
2 Occupational Therapy Aide
% of Days 60%
2 Nurse Aide in Training
% of Days 33%
2 Physical Therapy Assistant
% of Days 45%
1 Qualified Social Worker
% of Days 54%
3 Respiratory Therapy Technician
% of Days 16%
2 Occupational Therapy Assistant
% of Days 5%
1 Medical Director
% of Days 3%

Penalties and fines

Includes penalties issued in 2024

Federal penalties imposed by CMS for regulatory violations, including civil money penalties (fines) and denials of payment for new Medicare/Medicaid admissions.

Source: CMS Penalties Database (Data as of Jan 2026)

Total fines amount $32K Rank #50 / 92Federal fines — State benchmarkedThis home is ranked 50th out of 92 homes in Washington. Shows this facility's cumulative CMS federal fine dollars versus the Washington average among facilities with fines, and where it ranks among 92 facilities in the pool. Lower total dollars mean a better rank.Rankings are based only on facilities in Washington that report data for that category. Facilities without available data are excluded from the ranking.Click the rank badge to see the full State ranking.Click here to see the full State ranking.
61% lower than Washington average

Washington average: $82K

Number of fines 1
46% fewer fines than Washington average

Washington average: 1.8

Payment Denials Info Serious action where Medicare and/or Medicaid temporarily stops payments for new residents until issues are fixed. 0
100% fewer payment denials than Washington average

Washington average: 0.3

Fines amount comparison
This facility $32K
Washington average $82K
Penalty History

Penalties are imposed by CMS for violations of federal nursing home regulations.

1 penalty in the past 3 years

Jun 12, 2024 · $32K

Civil Money Penalty Info Fines imposed for noncompliance, which can be assessed per day or per instance of violation. Jun 12, 2024
$32K

Last updated: Jan 2026

Quality of care over time

These measures show how residents usually do over time at this home, based on health outcomes and preventive care.

High-risk clinical events score Info A composite score based on pressure ulcers, falls with injury, weight loss, walking ability decline, and activities of daily living decline. 6.1
39% better than Washington average

Washington average: 10.0

Functional decline score Info A composite score based on activities of daily living decline, walking ability decline, and incontinence. 14.7
29% better than Washington average

Washington average: 20.9

Long-stay resident measures
Significantly above average Washington avg: 3.6 Info CMS star rating based on long-stay quality measure performance. 5 stars = significantly above average, 1 star = significantly below average.
Need for Help with Daily Activities Increased Info Percent of long-stay residents whose need for help with daily activities has increased 8.7%
47% better than Washington average

Washington average: 16.4%

Walking Ability Worsened Info Percent of long-stay residents whose ability to move independently worsened 9.8%
55% better than Washington average

Washington average: 21.8%

Low Risk Residents with Bowel/Bladder Incontinence Info Percent of low risk long-stay residents who lose control of their bowels or bladder 25.7%
6% worse than Washington average

Washington average: 24.3%

Falls with Major Injury Info Percent of long-stay residents experiencing one or more falls with major injury 2.0%
23% better than Washington average

Washington average: 2.6%

High Risk Residents with Pressure Ulcers Info Percent of long-stay high risk residents with pressure ulcers 4.5%
10% better than Washington average

Washington average: 4.9%

Urinary Tract Infection Info Percent of long-stay residents with a urinary tract infection 0.6%
66% better than Washington average

Washington average: 1.7%

Lost Too Much Weight Info Percent of long-stay residents who lose too much weight 5.7%
In line with Washington average

Washington average: 5.8%

Depressive Symptoms Info Percent of long-stay residents who have depressive symptoms 2.5%
84% better than Washington average

Washington average: 16.2%

Antipsychotic Use Info Percent of long-stay residents who received an antipsychotic medication 12.6%
13% better than Washington average

Washington average: 14.5%

Pneumococcal Vaccine Info Percent of long-stay residents assessed and appropriately given the pneumococcal vaccine 93.4%
In line with Washington average

Washington average: 96.2%

Influenza Vaccine Info Percent of long-stay residents assessed and appropriately given the seasonal influenza vaccine 90.3%
In line with Washington average

Washington average: 93.8%

Hospitalizations per 1,000 days Info Number of hospitalizations per 1,000 long-stay resident days. 1.85
34% worse than Washington average

Washington average: 1.38

ED visits per 1,000 days Info Number of outpatient emergency department visits per 1,000 long-stay resident days. 1.89
25% worse than Washington average

Washington average: 1.51

Short-stay resident measures
Average Washington avg: 3.6 Info CMS star rating based on short-stay quality measure performance. 5 stars = much above average, 1 star = much below average.
Pneumococcal Vaccine Info Percent of short-stay residents assessed and appropriately given the pneumococcal vaccine 68.2%
23% worse than Washington average

Washington average: 88.1%

Antipsychotic medication increase Info Percent of short-stay residents who newly received an antipsychotic medication 2.6%
85% worse than Washington average

Washington average: 1.4%

Influenza Vaccine Info Percent of short-stay residents assessed and appropriately given the seasonal influenza vaccine 66.2%
19% worse than Washington average

Washington average: 82.0%

Re-hospitalized after SNF stay Info Percentage of short-stay residents who were re-hospitalized after their nursing home admission. 18.3%
8% better than Washington average

Washington average: 19.9%

Emergency department visits Info Percentage of short-stay residents who had an outpatient emergency department visit. 5.9%
55% better than Washington average

Washington average: 13.2%

Falls with major injury Info Percentage of SNF residents who experience falls with major injury during their stay. 0.0%
100% better than Washington average

Washington average: 0.8%

Ability to care for self at discharge Info Percentage of residents at or above expected ability to care for themselves at discharge. 42.9%
20% worse than Washington average

Washington average: 53.7%

Successful return to home or community Info Rate of successful return to home or community from a skilled nursing facility. 29.0%
43% worse than Washington average

Washington average: 50.6%

Breakdown by payment type

Medicare

13% of new residents, usually for short-term rehab.

Typical stay 1 months

Private pay

34% of new residents, often for short stays.

Typical stay 1 - 2 months

Medicaid

53% of new residents, often for long-term daily care.

Typical stay 6 months

Facility Characteristics

Source: CMS Long-Term Care Facility Characteristics (Data as of Jan 2026)

Total residents 98
Medicare
8
8.2% of residents
Medicaid
88
89.8% of residents
Private pay or other
2
2% of residents
Programs & Services
Residents Group

Residents meet regularly to discuss policies, care quality, and activities

Nurse Aide Training

State-approved Nurse Aide Training and Competency Evaluation Program on-site

Active Resident Council

Organized group of residents that meets regularly to discuss facility policies, quality of life, and activities.

Finances and operations

Based on CMS SNF Cost Report for fiscal year ending in 12/2023.

For-profit
Corporation
Net patient revenue Info Net patient revenue — what the home actually collects for resident care, after contractual allowances, bad debt and discounts are subtracted from its gross charges (CMS cost report, Worksheet G-3). It covers resident care only; money the home earns from other sources is shown separately as "Other income."
$10.7M
Net patient income Info Net patient income: net patient revenue minus the home's total operating expenses. A positive figure means it earns more from resident care than it spends to deliver it; a negative figure means the opposite. It excludes non-operating "other income."
-$315.4K
For-profit Corporation
Net patient revenue Info Net patient revenue — what the home actually collects for resident care, after contractual allowances, bad debt and discounts are subtracted from its gross charges (CMS cost report, Worksheet G-3). It covers resident care only; money the home earns from other sources is shown separately as "Other income."
$10.7M Rank #41 / 94Revenue — State benchmarkedThis home is ranked 41st out of 94 homes in Washington. Shows this facility's annual revenue compared to the Washington average. Higher revenue generally means more resources for staffing and capital — read alongside Payroll %.Rankings are based only on facilities in Washington that report data for that category. Facilities without available data are excluded from the ranking.Click the rank badge to see the full State ranking.Click here to see the full State ranking.
Net patient income Info Net patient income: net patient revenue minus the home's total operating expenses. A positive figure means it earns more from resident care than it spends to deliver it; a negative figure means the opposite. It excludes non-operating "other income."
-$315.4K
Other income Info Money the home earns outside of resident care — such as investments, grants, rentals and other non-operating sources (CMS cost report, Worksheet G-3). It is tracked separately from net patient revenue: it is not part of that figure, and it is not included in net patient income.
$446.8K
Payroll costs Info Staff salaries plus wage-related costs — benefits such as payroll taxes, health insurance and retirement — from the home's own accounting records (CMS cost report, Worksheet A). Contract or agency labor is counted separately, under other operating costs. Rank #29 / 94Payroll — State benchmarkedThis home is ranked 29th out of 94 homes in Washington. Shows total annual staff payroll benchmarked to the Washington average. Higher payroll investment relative to peers often signals better staffing and less reliance on cheaper contract labor.Rankings are based only on facilities in Washington that report data for that category. Facilities without available data are excluded from the ranking.Click the rank badge to see the full State ranking.Click here to see the full State ranking.
$6.8M 63.5% of net patient revenue Info Payroll as a share of revenue: staff salaries and wage-related benefits divided by net patient revenue. A higher figure means more of each revenue dollar goes to staff pay. Rank #27 / 94Payroll % — State benchmarkedThis home is ranked 27th out of 94 homes in Washington. Shows payroll as a percentage of revenue versus the Washington average. Well-run Washington facilities typically land around 53–61% — the top third Statewide. Below 25% may signal understaffing or heavy agency use — read with Staffing ratings.Rankings are based only on facilities in Washington that report data for that category. Facilities without available data are excluded from the ranking.Click the rank badge to see the full State ranking.Click here to see the full State ranking.
Other operating costs Info Everything it costs to run the home apart from payroll — food, utilities, supplies, maintenance, contract labor and administration. Calculated as total operating expense minus payroll (staff salaries and wage-related benefits).
$4.2M
Total costs Info The home's total operating expense for the year — all the costs of running it, salaries included (CMS cost report, Worksheet G-3).
$11.0M

Who this home usually serves

TYPE OF STAY

Mostly long-term care residents

Most residents stay for extended periods and receive ongoing daily care.

Most new residents arrive under Medicaid (53% of admissions), and a typical Medicaid stay runs around 6 months.

Admissions
282 total

Coverage residents most often arrive under.

Medicare 13%
Private pay 34%
Medicaid 53%
Discharges
274 total

Coverage residents most often leave under.

Medicare 5%
Private pay 42%
Medicaid 53%

Places of interest near Hallmark Manor

Address 2.1 miles from city center Info Estimated distance in miles from Federal Way's city center to Hallmark Manor's address, calculated via Google Maps. — 1.44 miles to nearest hospital (St. Francis Hospital)

Calculate Travel Distance to Hallmark Manor

Add your location

Address

Compare Nursing Homes around Federal Way

The information below is reported by the Washington Department of Social and Health Services, Residential Care Services.

4 facilities compared · CMS & WA Dept. of Health data

Garden Terrace Healthcare Center at Federal Way
NH
AL
HC
PC
RC
Federal Way (South 338Th Street)
34
Facility 34
WA AVG 82
Rank #343 / 366
35.3%
Facility 35.3%
WA AVG 72.5%
Rank #299 / 310
-51%
4.88
Facility 4.88
WA AVG 4.22
Rank #7 / 90
+30% +16%
$0
Facility $0
WA AVG $87.7k
Rank #1 / 92
46
Facility 46
WA AVG 48.9
Rank #42 / 92
6.6
Facility 6.6
WA AVG 6.9
Rank #51 / 92
- 12 -
46
Facility 46
WA AVG 51
Rank #362 / 628
Megan Larson
$12.1M
Facility $12.1M
WA AVG $13.2M
Rank #38 / 94
$7.3M
Facility $7.3M
WA AVG $5.7M
Rank #32 / 94
59.8%
Facility 59.8%
WA AVG 45.5%
Rank #37 / 94
505512
Judson Park
NH
AL
IL
MC
NC
Des Moines (Marine View Drive South)
52
Facility 52
WA AVG 82
Rank #288 / 366
73.1%
Facility 73.1%
WA AVG 72.5%
Rank #170 / 310
+1%
4.06
Facility 4.06
WA AVG 4.22
Rank #47 / 90
+25% -4%
$0
Facility $0
WA AVG $87.7k
Rank #1 / 92
57
Facility 57
WA AVG 48.9
Rank #57 / 92
19.0
Facility 19.0
WA AVG 6.9
Rank #91 / 92
- 38 A+
19
Facility 19
WA AVG 51
Rank #532 / 628
Humangood Washington
$30.8M
Facility $30.8M
WA AVG $13.2M
Rank #8 / 94
$15.8M
Facility $15.8M
WA AVG $5.7M
Rank #5 / 94
51.4%
Facility 51.4%
WA AVG 45.5%
Rank #50 / 94
505455
Hallmark Manor
NH
Federal Way (1St Avenue South)
147
Facility 147
WA AVG 82
Rank #19 / 366
62.6%
Facility 62.6%
WA AVG 72.5%
Rank #238 / 310
-14%
3.68
Facility 3.68
WA AVG 4.22
Rank #67 / 90
-7% -13%
$32.2k
Facility $32.2k
WA AVG $87.7k
Rank #50 / 92
59
Facility 59
WA AVG 48.9
Rank #58 / 92
9.8
Facility 9.8
WA AVG 6.9
Rank #72 / 92
1 99 A+
43
Facility 43
WA AVG 51
Rank #387 / 628
Melissa Nelson
$10.7M
Facility $10.7M
WA AVG $13.2M
Rank #41 / 94
$6.8M
Facility $6.8M
WA AVG $5.7M
Rank #29 / 94
63.5%
Facility 63.5%
WA AVG 45.5%
Rank #27 / 94
505313
Life Care Center of Federal Way
NH
Federal Way (Lake Easter Estates)
157
Facility 157
WA AVG 82
Rank #11 / 366
- -
4.01
Facility 4.01
WA AVG 4.22
Rank #52 / 90
-9% -5%
$99.0k
Facility $99.0k
WA AVG $87.7k
Rank #71 / 92
81
Facility 81
WA AVG 48.9
Rank #79 / 92
10.1
Facility 10.1
WA AVG 6.9
Rank #75 / 92
5 16 -
48
Facility 48
WA AVG 51
Rank #345 / 628
Tom Zwicker
$12.5M
Facility $12.5M
WA AVG $13.2M
Rank #32 / 94
$8.2M
Facility $8.2M
WA AVG $5.7M
Rank #27 / 94
65.4%
Facility 65.4%
WA AVG 45.5%
Rank #43 / 94
505188

Financial Assistance for
Nursing Home in Washington

Hallmark Manor is located in Federal Way, Washington.
Here are the financial assistance programs available to residents in Washington.

Get Financial aid guidance

Community Options Program Entry System (COPES)

WA Medicaid COPES

Age 65+ or disabled
General Washington resident, Medicaid-eligible, nursing home-level care need.
Income Limits (2025) ~$2,829/month 300% FBR, individual
Asset Limits $2,000 (individual), $3,000 (couple).
WA

High demand in urban areas (e.g., Seattle).

Benefits
Personal care (5-7 hours/day) Respite (240 hours/year) Adult day care ($70/day) Home modifications ($1,500 avg.)

Washington Family Caregiver Support Program

WA NFCSP

Age Caregiver of someone 60+ (or with dementia)
General Washington resident.
Income Limits No strict limit; prioritizes low-income.
Asset Limits Not applicable.
WA

High urban demand; rural outreach.

Benefits
In-home respite (4-6 hours/day) Adult day care (~$70/day) Short-term facility care (up to 5 days)

Community First Choice (CFC)

Washington Community First Choice

Age 65+ (or disabled 18+)
General WA resident, Medicaid-eligible, need help with 2+ ADLs/IADLs.
Income Limits (2025) ~$2,829/month; QIT optional.
Asset Limits $2,000 (individual), $3,000 (couple).
WA

Broader than COPES; serves ~20,000; self-directed option.

Benefits
Personal care (4-6 hours/day) Respite (~240 hours/year) Assistive devices Training Transportation

Older Americans Act (OAA) Services

Washington OAA Services

Age 60+
General WA resident; no income/asset limits.
Income Limits (2025) None; donations encouraged.
Asset Limits Not assessed.
WA

13 AAAs; includes Meals on Wheels; rural focus.

Benefits
Meals (~$5-$7/meal) Transportation Homemaker services (~4 hours/week) Respite (~5 days/year) Legal aid

Medicare Savings Program (MSP)

Washington Medicare Savings Program

Age 65+ or disabled
General WA resident, Medicare Part A/B.
Income Limits (2025) ~$2,510/month (QMB), ~$3,380/month (SLMB), ~$3,598/month (QI)—individual.
Asset Limits $9,430 (individual), $14,130 (couple).
WA

Includes Extra Help for Part D; no waitlist.

Benefits
Covers Part B premiums ($174.70/month) Deductibles ($240/year) Copays (~20%)

VA Aid and Attendance (A&A) and Housebound Benefits

Washington VA Aid and Attendance/Housebound

Age 65+ or disabled veteran/spouse
General WA resident, wartime service, ADL help (A&A) or homebound.
Income Limits (2025) Net income < ~$1,984/month (veteran with dependent, A&A); pension offsets income.
Asset Limits ~$155,356 net worth
WA

High veteran use; supports rural/urban needs.

Benefits
Cash (~$1,433-$2,642/month veteran, ~$951-$1,318 spouse) for care costs

Senior Citizens Property Tax Exemption

Washington Senior Property Tax Exemption

Age 61+ or disabled retiree
General WA resident, homeowner, income-based.
Income Limits (2025) ~$45,000-$70,000/year varies by county, e.g., King: $70,000
Asset Limits Not assessed; home value cap varies ~$250,000-$400,000
WA

Saves ~$500-$1,500/year; offered statewide.

Benefits
Tax exemption (~$500-$1,500/year depending on county)

Senior Farmers’ Market Nutrition Program (SFMNP)

Washington SFMNP

Age 60+
General WA resident, low-income.
Income Limits (2025) ~$2,322/month 185% FPL
Asset Limits Not assessed.
WA

Vouchers (~$80/season); serves ~20,000 via AAAs.

Benefits
Vouchers (~$80/season) for produce at farmers’ markets

Frequently Asked Questions about Hallmark Manor

What neighborhood is Hallmark Manor in?

Hallmark Manor is in the 1st Avenue South neighborhood of Federal Way.

Is Hallmark Manor in a walkable area?

Hallmark Manor has a walk score of 43. Somewhat walkable. A few nearby services may be reachable on foot, but most trips require transportation.

What is the occupancy rate at Hallmark Manor?

Hallmark Manor's occupancy is 59.0%.

Does Hallmark Manor operate as a for-profit or non-profit?

Hallmark Manor is registered as a for-profit in WA.

Are there photos of Hallmark Manor?

Yes — there are 7 photos of Hallmark Manor in the photo gallery on this page.

What is the address of Hallmark Manor?

Hallmark Manor is located at 32300 1St Ave S, Federal Way, WA 98003.

What is the phone number of Hallmark Manor?

(253) 874-3580 will put you in contact with the team at Hallmark Manor.

Guides for Better Senior Living

Care Cost Calculator: See Prices in Your Area

Nursing Home Data Explorer

Don’t Wait Too Long: 7 Red Flag Signs Your Parent Needs Assisted Living Now

The True Cost of Assisted Living in 2025 – And How Families Are Paying For It

Understanding Senior Living Costs: Pricing Models, Discounts & Financial Assistance