Hamden Health Care Center

Memory Care Home
Overview of Hamden Health Care Center

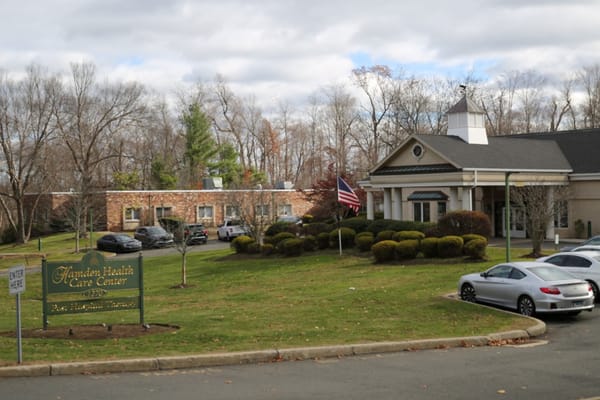
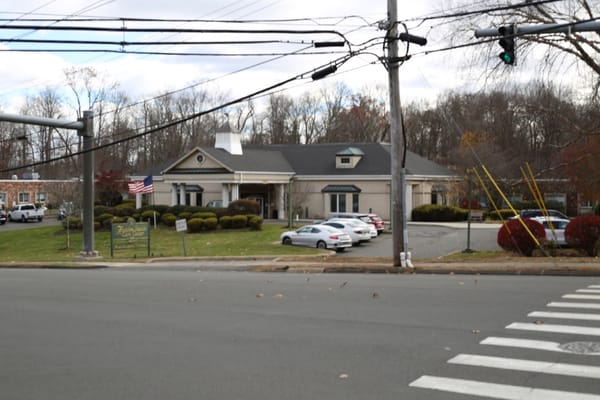
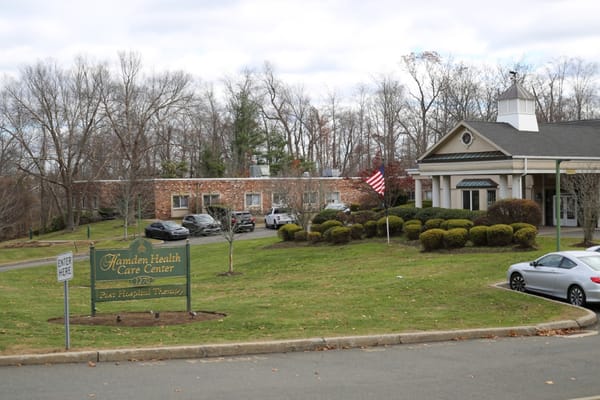
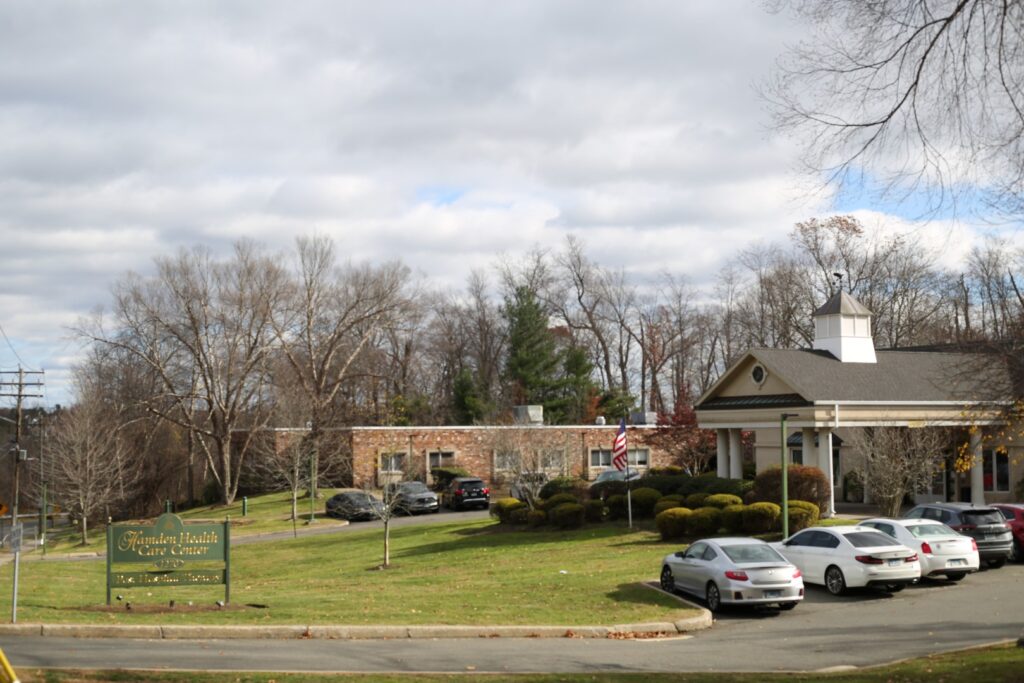
Hamden Health Care Center is a highly recognized nursing home in Hamden, CT, that offers long-term care and short-term rehabilitation. The community can accommodate up to 153 older adults with its home-like environment. Memory care, respite care, and healthy meals are also offered to enrich residents’ living experiences. With its holistic approach to care, the community ensures residents are well-cared for.

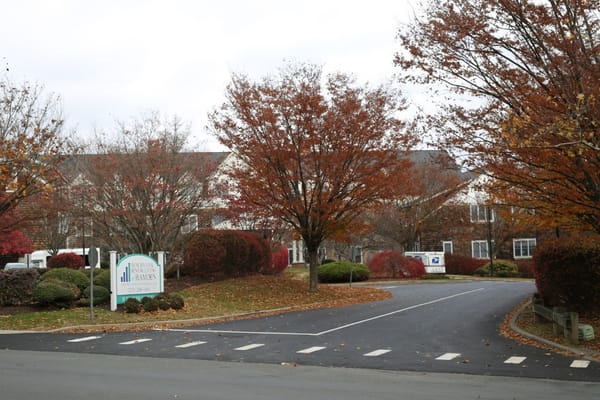
Memory-related activities, pet therapy, and cooking classes, are among the life-enhancement programs provided for residents’ leisure and wellness. Cozy patios and park-like grounds also ensure residents can keep their peace of mind. YNHH Outpatient Pharmacy Services, as well as bus stops, are located nearby, ensuring accessibility and convenience. This nursing home is a great choice for older adults in Connecticut, as it has a wide range of care options and state-of-the-art amenities.

Quality ratings

Measured by Centers for Medicare & Medicaid Services (CMS)

Overall rating Info Official CMS rating based on health inspections, staffing and quality measures.
2/5
Connecticut average: 3.0/5
Health Inspection Info Official CMS rating based on deficiencies found during state health inspections.
3/5
Connecticut average: 2.8/5
Staffing Info Official CMS rating based on nurse staffing hours per resident per day.
4/5
Connecticut average: 3.2/5
Quality Measures Info Official CMS rating based on clinical outcomes for residents.
1/5
Connecticut average: 3.5/5

Nursing care per resident

Info Average daily nursing hours per resident (adjusted for acuity). Higher values indicate more nursing time per resident.
4h 13m per day

This home provides 6% more nursing time per resident than the state average.

Connecticut average: 3h 58m per day

Staffing hours breakdown

Info Hours of care per resident per day, broken down by staff type. Data from CMS Medicare.
Staff type Facility State avg National avg
Registered Nurse (RN) Info Registered nurse hours per resident per day. 25m per day 42m per day 41m per day
LPN / LVN Info Licensed Practical Nurse / Licensed Vocational Nurse hours per resident per day. 1h 10m per day 50m per day 52m per day
Nurse Aide Info Nurse aide hours per resident per day. 2h 28m per day 2h 17m per day 2h 21m per day
Total Nursing (Weekend) Info Total number of nurse staff hours per resident per day on weekends. 3h 31m per day 3h 25m per day 3h 26m per day
Physical Therapist Info Physical therapist staff hours per resident per day. 3m per day 5m per day 4m per day
RN (Weekend) Info Registered nurse hours per resident per day on weekends. 14m per day 28m per day 29m per day

Capacity and availability

Medium-capacity home

Offers a balance of services and community atmosphere.

Total beds 153

This home usually has availability

Lower occupancy suggests more openings may be available.

Lower demand than the Connecticut average
Occupancy rate 78.5%
Residents per day (avg) 135
Occupancy rate
78.5%
Residents per day (avg)
135

Who this home usually serves

TYPE OF STAY

Mostly short-term rehab stays

Most residents typically stay for a few weeks or months before returning home or moving on.

Might be optimal for
Short stays Recovery Medicare-covered care

Breakdown by payment type

Medicare

88% of new residents, usually for short-term rehab.

Typical stay 15 days

Private pay

9% of new residents, often for short stays.

Typical stay 8 - 9 months

Medicaid

3% of new residents, often for long-term daily care.

Typical stay 6 - 7 years

Finances and operations

Proprietary home
Corporation
Home revenue
$24.5M
Profit
$1.1M
Proprietary home Corporation
Home revenue
$24,526,626.00
Profit
$1,098,144.00
Payroll costs Info The portion of the home's budget spent on staff, including nurses, caregivers, and other employees who support care and operations.
$8.0M
32.4% of revenue
Other operating costs Info All remaining costs needed to run the home, such as food, utilities, building maintenance, supplies and administrative expenses.
$15.5M
Total costs $23.4M

What does this home offer?

Building type icon
Building type icon

Building Type: Single-story

Dining services icon

Dining Services

Social and recreational activities icon

Social and Recreational Activities

Rehabilitative support icon

Rehabilitative Support

On-site medical care and health services icon

On-site Medical Care and Health Services

Types of Care at Hamden Health Care Center

Nursing Home Memory Care
Contact Hamden Health Care Center

Compare Memory Care around Hamden

The information below is reported by the Connecticut Department of Public Health, Facility Licensing and Investigations Section.
Arden Care Center
MC

Memory Care Specialized care for those with Memory Loss, Alzheimer's, or dementia, ensuring safety and support.

SNF

Nursing Homes 24/7 care needed

Hamden
271
No
66
EGERT, USHER
79.6%
$41,144,048.00
$10,786,670.00
26.2%
204.10
1/5
3.2385
1/5
1/5
4/5
4
63
3
-56%
-18%
-5%
-
Hamden Health Care Center
MC

Memory Care Specialized care for those with Memory Loss, Alzheimer's, or dementia, ensuring safety and support.

SNF

Nursing Homes 24/7 care needed

Hamden
153
No
28
WCTHC LLC
78.5%
$24,517,630.00
$7,950,127.00
32.4%
134.50
2/5
4.2084
3/5
4/5
1/5
-
45
1
-49%
+6%
-7%
Private Rooms

Places of interest near Hamden Health Care Center

Address 1.3 miles from city center

Address 1270 Sherman Avenue, Hamden, CT 06514

Calculate Travel Distance to Hamden Health Care Center

Add your location

Address

Staffing Data

Source: CMS Payroll-Based Journal (Q2 2025)

195
Total Staff
171
Employees
24
Contractors
58,083
Total Hours (Quarter)
85
Avg Staff/Day
7.5
Avg Shift (hrs)
Nursing Staff Breakdown
Role Count Avg Shift (hrs) Uses Contractors?
Registered Nurse118.1 No
Licensed Practical Nurse427.4 No
Certified Nursing Assistant927.5 No
Staff by Category
Administration
3 staff
6.3hs shift avg
Nursing Staff
148 staff
7.6hs shift avg
Physicians & Practitioners
5 staff
7.8hs shift avg
Therapy Services
21 staff
7.1hs shift avg
Activities & Recreation
0 staff
0hs shift avg
Social Services
4 staff
4.8hs shift avg
Dietary Services
8 staff
7.6hs shift avg
Other Services
6 staff
7.2hs shift avg
Contractor Analysis
5.8%
of total hours from contractors
3,370 contractor hours this quarter
Qualified Social Worker: 4 Physical Therapy Aide: 5 Respiratory Therapy Technician: 3 Physical Therapy Assistant: 5 Speech Language Pathologist: 3 Medical Director: 1 Occupational Therapy Assistant: 3
Role Employees Contractors Total Staff Total Hours Days Worked % of Days Avg Shift (hrs)
Certified Nursing Assistant9209230,31191100%7.5
Licensed Practical Nurse4204212,75791100%7.4
Registered Nurse110113,51091100%8.1
Other Dietary Services Staff7072,08991100%7.6
RN Director of Nursing3031,3856976%8
Clinical Nurse Specialist4041,1656470%8
Physical Therapy Assistant0559778088%7.1
Mental Health Service Worker4049506976%7
Administrator2029456369%7.5
Speech Language Pathologist0339167380%7.3
Respiratory Therapy Technician0335207582%6.9
Dental Services Staff2025105965%7.5
Nurse Practitioner1014736369%7.5
Physical Therapy Aide0554375965%7.3
Occupational Therapy Aide1014355864%7.5
Qualified Social Worker0444167178%4.8
Dietitian1011502022%7.5
Occupational Therapy Assistant033531213%4.5
Medical Director011523235%1.6
Physical Therapist1013555%6.9

Health Inspection History

Inspections
Total health inspections 9

Connecticut average 5.7


Last Health inspection on Feb 2025

Total health citations 45
Citations per inspection
5

Health citations are formal notices following inspections when they fail to comply with safety and care standards.

27 of 45 citations resulted from standard inspections; and 18 of 45 resulted from complaint investigations.

Breakdown of citation severity (last 3 years)
Critical Health citations More info 0
100% better than Connecticut average

Connecticut average: 0.3


Serious Health citations More info 1
43% worse than Connecticut average

Connecticut average: 0.7

0 critical citations More info Connecticut average: 0.3

1 serious citation More info Connecticut average: 0.7

43 moderate citations More info Connecticut average: 28.8

1 minor citation More info Connecticut average: 2.3
Citations history (last 3 years)
Environmental moderate citation Feb 11, 2025
Corrected

Care Planning minor citation Sep 30, 2024
Corrected

Quality of Care moderate citation Aug 28, 2024
Corrected

Quality of Care moderate citation Jul 25, 2024
Corrected

Facility Characteristics

Source: CMS Long-Term Care Facility Characteristics (Data as of Jan 2026)

Ownership: For-Profit LLC
Resident Census by Payment Source
141 Total Residents
Medicare 11 (7.8%)
Medicaid 67 (47.5%)
Private Pay/Other 63 (44.7%)
Programs & Services
Residents' Group
Family Member Group
Family Engagement

Active councils help families stay involved in care decisions and facility operations.

Quality of care over time

These measures show how residents usually do over time at this home, based on health outcomes and preventive care.

High-risk clinical events score Info A composite score based on pressure ulcers, falls with injury, weight loss, walking ability decline, and activities of daily living decline. 13.0
25% worse than Connecticut average

Connecticut average: 10.4

Functional decline score Info A composite score based on activities of daily living decline, walking ability decline, and incontinence. 22.4
6% worse than Connecticut average

Connecticut average: 21.1

Long-stay resident measures
Need for Help with Daily Activities Increased Info Percent of long-stay residents whose need for help with daily activities has increased 25.4%
34% worse than Connecticut average

Connecticut average: 18.9%

Walking Ability Worsened Info Percent of long-stay residents whose ability to move independently worsened 25.9%
35% worse than Connecticut average

Connecticut average: 19.2%

Low Risk Residents with Bowel/Bladder Incontinence Info Percent of low risk long-stay residents who lose control of their bowels or bladder 15.8%
36% better than Connecticut average

Connecticut average: 24.9%

Falls with Major Injury Info Percent of long-stay residents experiencing one or more falls with major injury 5.8%
67% worse than Connecticut average

Connecticut average: 3.5%

High Risk Residents with Pressure Ulcers Info Percent of long-stay high risk residents with pressure ulcers 6.8%
49% worse than Connecticut average

Connecticut average: 4.6%

Urinary Tract Infection Info Percent of long-stay residents with a urinary tract infection 1.1%
33% better than Connecticut average

Connecticut average: 1.7%

Lost Too Much Weight Info Percent of long-stay residents who lose too much weight 1.3%
80% better than Connecticut average

Connecticut average: 6.3%

Depressive Symptoms Info Percent of long-stay residents who have depressive symptoms 0.0%
100% better than Connecticut average

Connecticut average: 15.2%

Antipsychotic Use Info Percent of long-stay residents who received an antipsychotic medication 27.6%
61% worse than Connecticut average

Connecticut average: 17.2%

Pneumococcal Vaccine Info Percent of long-stay residents assessed and appropriately given the pneumococcal vaccine 67.1%
23% worse than Connecticut average

Connecticut average: 87.5%

Influenza Vaccine Info Percent of long-stay residents assessed and appropriately given the seasonal influenza vaccine 80.0%
14% worse than Connecticut average

Connecticut average: 93.5%

Hospitalizations per 1,000 days Info Number of hospitalizations per 1,000 long-stay resident days. 2.65
26% worse than Connecticut average

Connecticut average: 2.10

ED visits per 1,000 days Info Number of outpatient emergency department visits per 1,000 long-stay resident days. 2.20
44% worse than Connecticut average

Connecticut average: 1.53

Short-stay resident measures
Pneumococcal Vaccine Info Percent of short-stay residents assessed and appropriately given the pneumococcal vaccine 60.8%
13% worse than Connecticut average

Connecticut average: 70.1%

Antipsychotic medication increase Info Percent of short-stay residents who newly received an antipsychotic medication 1.5%
In line with Connecticut average

Connecticut average: 1.5%

Influenza Vaccine Info Percent of short-stay residents assessed and appropriately given the seasonal influenza vaccine 55.2%
21% worse than Connecticut average

Connecticut average: 69.8%

Re-hospitalized after SNF stay Info Percentage of short-stay residents who were re-hospitalized after their nursing home admission. 34.5%
38% worse than Connecticut average

Connecticut average: 25.0%

Emergency department visits Info Percentage of short-stay residents who had an outpatient emergency department visit. 13.0%
17% worse than Connecticut average

Connecticut average: 11.1%

Falls with major injury Info Percentage of SNF residents who experience falls with major injury during their stay. 0.7%
In line with Connecticut average

Connecticut average: 0.8%

Ability to care for self at discharge Info Percentage of residents at or above expected ability to care for themselves at discharge. 31.2%
42% worse than Connecticut average

Connecticut average: 53.7%

Successful return to home or community Info Rate of successful return to home or community from a skilled nursing facility. 59.1%
17% better than Connecticut average

Connecticut average: 50.6%

Guides for Better Senior Living

Care Cost Calculator: See Prices in Your Area

Nursing Home Data Explorer

Don’t Wait Too Long: 7 Red Flag Signs Your Parent Needs Assisted Living Now

The True Cost of Assisted Living in 2025 – And How Families Are Paying For It

Understanding Senior Living Costs: Pricing Models, Discounts & Financial Assistance

Financial Aid for Connecticut Seniors

Get financial aid guidance

Connecticut Home Care Program for Elders

CHCPE

Age 65+, Connecticut resident, at risk of nursing home placement.

State-funded: ~$1,600/month; Medicaid: ~$2,829/month (300% FBR).

$1,600 (state), $2,000 (Medicaid, individual).

Two tiers (state and Medicaid); waitlists possible.

Statewide Respite Care Program

CT Respite Care

Caregiver of senior with dementia, Connecticut resident.

~$2,500/month (individual, varies).

$40,000 (individual).

Limited to dementia caregivers; capped funding.

Congregate Housing Services Program (CHSP)

Connecticut Congregate Housing Services Program

Age 62+, Connecticut resident, frail but not needing 24/7 care, resides in CHSP-eligible housing.

~$41,000/year (individual, adjusted annually).

Not specified; focus is income-based.

Limited to 14 state-subsidized sites; participants pay 10% of service costs.

Medicare Savings Program (MSP)

Connecticut Medicare Savings Program

Age 65+ or disabled, Connecticut resident, enrolled in Medicare Part A/B.

~$2,510/month (individual, QMB); ~$3,380/month (SLMB); ~$3,598/month (ALMB)—adjusted annually.

None since 2023 policy change.

Three tiers (Qualified Medicare Beneficiary, Specified Low-Income, Additional Low-Income); no asset test.

Senior Community Service Employment Program (SCSEP)

Connecticut SCSEP (federally funded, state-administered)

Age 55+, unemployed, low-income, Connecticut resident.

~$1,983/month (125% FPL, individual).

Not specified; income-focused.

Priority for veterans, rural residents; limited slots (~500/year).

Who we are

Your Senior Care Partner, Every Step of the Way

We help families find affordable senior communities and unlock same day discounts, Medicaid, and Medicare options tailored to your needs.

Contact us Today
Tour Icon
Planning a tour? Check our touring checklist.
Chat Icon
Thinking of living here? We can help you speak to a current resident