Memory Care Home

Harlingen Nursing and Rehabilitation Center

Memory Care Home

Harlingen Nursing and Rehabilitation Center

3810 Hale Ave, Harlingen, TX 78550 View map
Overview of Harlingen Nursing and Rehabilitation Center

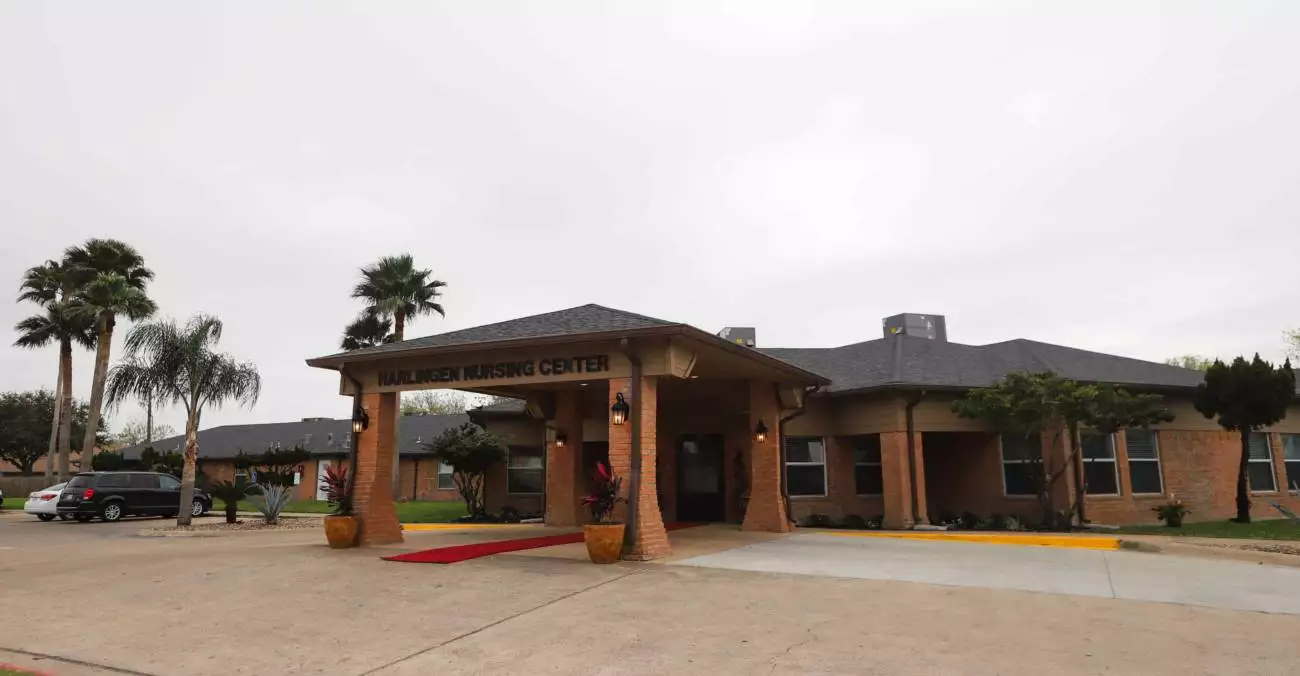
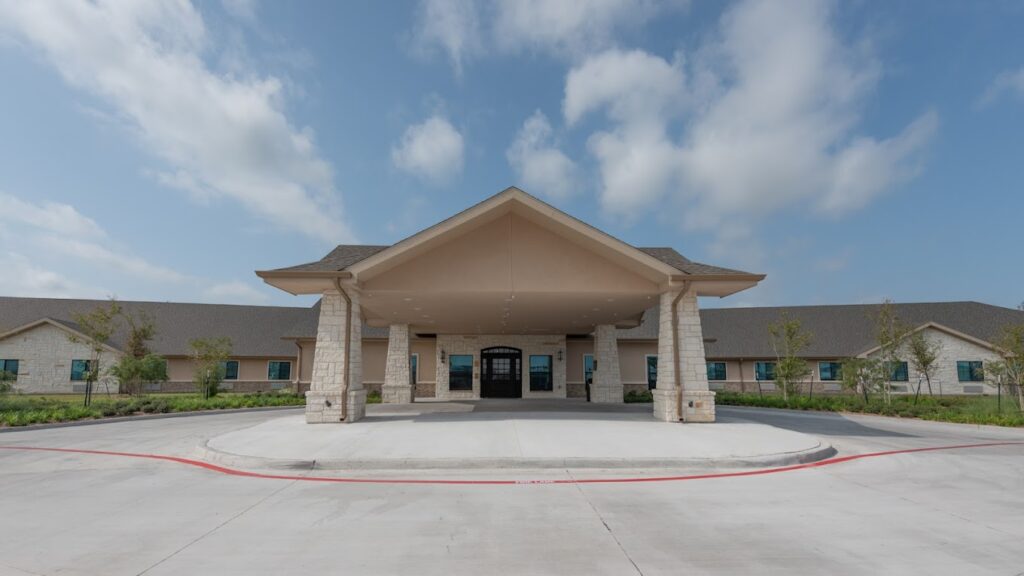
Discover an exceptional living experience with the Harlingen Nursing and Rehabilitation Center located in Harlingen, TX, providing skilled nursing and clinical services, therapy services and rehabilitation, hospice services, and home health services. Here, well-appointed and comfortable accommodations with different floor plans are available for its residents. With an expert and dedicated team, residents can receive care and comfort for quality of life during their stay.

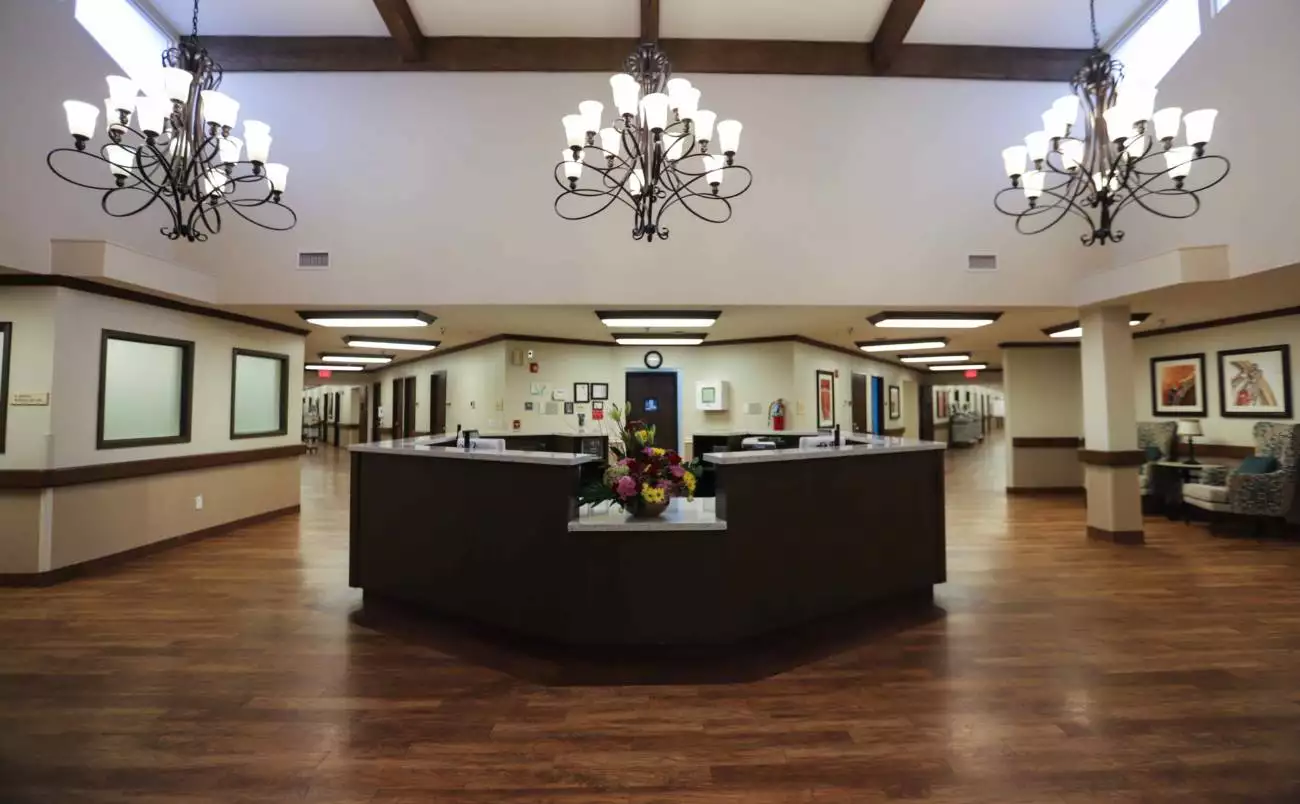
The community is committed to providing its residents with the healthiest life possible. Moreover, with its top-tier amenities and services, residents can enjoy the following: delightful and healthy meals, wifi and cable services, a beauty salon, and transportation services. Visit its beautiful and lovely common spaces such as the courtyard and meet new companions along the way. At the Harlingen Nursing and Rehabilitation Center, seniors are guaranteed a blissful and secure living experience.

(956) 412-8660

Quality ratings

Measured by Centers for Medicare & Medicaid Services (CMS)

Overall rating Info Official CMS rating based on health inspections, staffing and quality measures.
5/5
Texas average: 3.0/5
Health Inspection Info Official CMS rating based on deficiencies found during state health inspections.
5/5
Texas average: 2.9/5
Staffing Info Official CMS rating based on nurse staffing hours per resident per day.
1/5
Texas average: 2.4/5
Quality Measures Info Official CMS rating based on clinical outcomes for residents.
5/5
Texas average: 4.0/5

Nursing care per resident

Info Average daily nursing hours per resident (adjusted for acuity). Higher values indicate more nursing time per resident.
2h 59m per day

This home provides 21% less nursing time per resident than the Texas average.

Texas average: 3h 46m per day

Staffing hours breakdown

Info Hours of care per resident per day, broken down by staff type. Data from CMS Medicare.
Staff type Facility State avg National avg
Registered Nurse (RN) Info Registered nurse hours per resident per day. 19m per day 26m per day 41m per day
Nurse Aide Info Nurse aide hours per resident per day. 2h 10m per day 2h 1m per day 2h 21m per day
Total Nursing (Weekend) Info Total number of nurse staff hours per resident per day on weekends. 2h 49m per day 2h 59m per day 3h 26m per day
Physical Therapist Info Physical therapist staff hours per resident per day. 2m per day 4m per day 4m per day
RN (Weekend) Info Registered nurse hours per resident per day on weekends. 11m per day 21m per day 29m per day

Capacity and availability

Medium-capacity home

Offers a balance of services and community atmosphere.

Total beds 120

This home usually has availability

Lower occupancy suggests more openings may be available.

Lower demand than the Texas average
Occupancy rate 77%
Residents per day (avg) 108
Occupancy rate
77%
Residents per day (avg)
108

Who this home usually serves

TYPE OF STAY

Primarily long-term care, limited rehab

Most residents stay long-term, while a smaller portion are admitted for short-term rehab.

Might be optimal for
Long-term residence Daily assistance Occasional rehab needs

Breakdown by payment type

Medicare

16% of new residents, usually for short-term rehab.

Typical stay 1 - 2 months

Private pay

68% of new residents, often for short stays.

Typical stay 2 months

Medicaid

17% of new residents, often for long-term daily care.

Typical stay 2 years

Finances and operations

Privately-owned community
Home revenue
$9.1M
Profit
$1.8M
Privately-owned community
Home revenue
$9,110,323.00
Profit
$1,805,550.00
Payroll costs Info The portion of the home's budget spent on staff, including nurses, caregivers, and other employees who support care and operations.
$3.2M
35.6% of revenue
Other operating costs Info All remaining costs needed to run the home, such as food, utilities, building maintenance, supplies and administrative expenses.
$4.1M
Total costs $7.3M
Bed community size
120-bed community
A larger shared setting that may offer more common spaces and organized community services.
Years in operation
29 years in operation
A longer operating history, which may indicate experience navigating regulations and delivering ongoing care.
Walk Score
Walk Score: 49 / 100
Somewhat walkable. A few nearby services may be reachable on foot, but most trips require transportation.

Services

Medicare/medicaid

About this community

License details

Facility type
Nursing
Issuance January 3, 2023
Expiration January 3, 2026
County: CAMERON

Additional licensing details

License number: 311300
Year opened: 6/26/1996

Ownership & operating entity

Harlingen Nursing and Rehabilitation Center is administrated by JOSE LONGORIA.

Management company: REGENCY IHS OF HARLINGEN LLC
Owner: OAKBEND MEDICAL CENTER
Ownership type: COUNTY

Type Of Units

Medicaid and Medicare
120 units
Total beds
120 units

Staffing

Key information about the people who lead and staff this community.

Leadership

Administrator email: [email protected]

What does this home offer?

Accepts Medicaid icon

Accept Medicaid: Yes

Total residents icon

Total Residents: 120

Housing options icon

Housing Options: Private Rooms

Building type icon
Building type icon

Building Type: Single-story

Transportation services icon

Transportation Services

Fitness and recreation icon

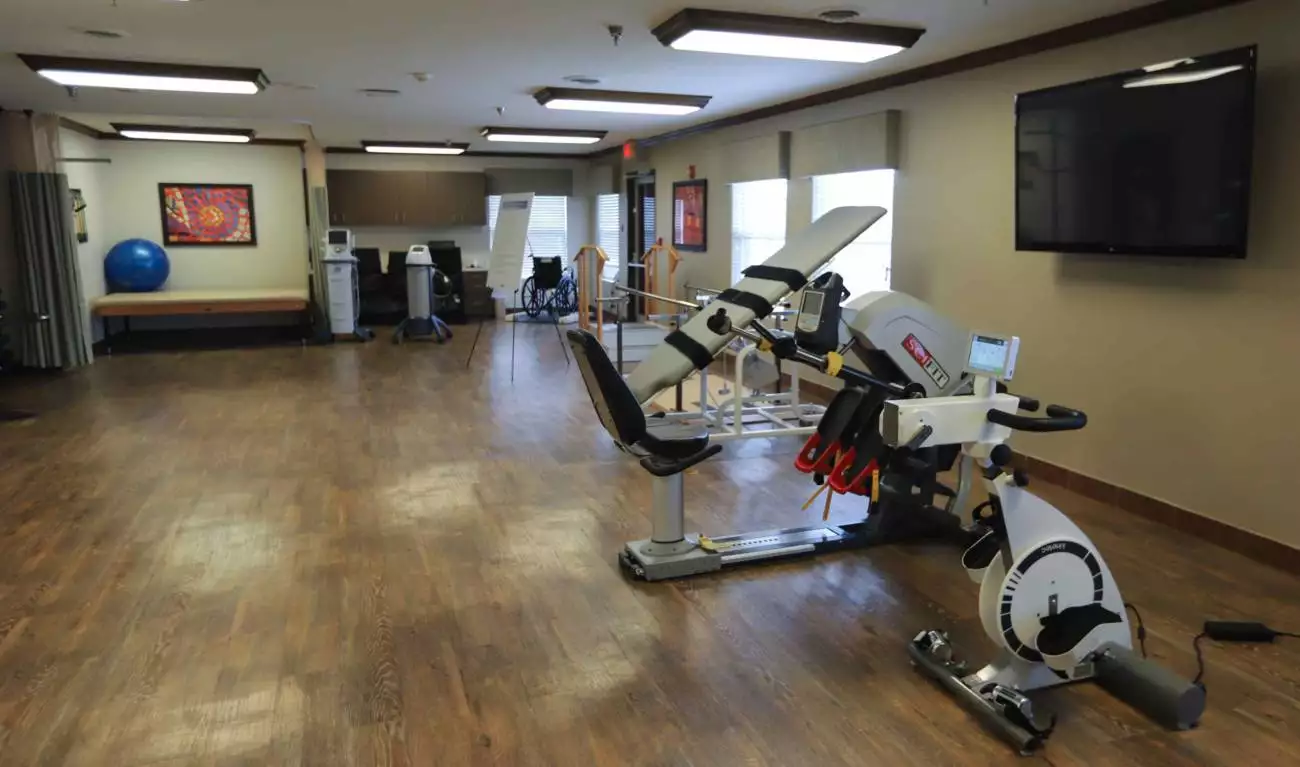
Fitness and Recreation

Types of Care at Harlingen Nursing and Rehabilitation Center

Memory Care
Contact Harlingen Nursing and Rehabilitation Center

Inspection History

In Texas, the Health and Human Services Commission (HHSC) is the primary regulatory body that conducts unannounced inspections and publishes quality reports for all long-term care homes.

Health Inspection History

Inspections
Total health inspections 5

Texas average 7.4


Last Health inspection on Nov 2024

Total health citations 17
Citations per inspection
3.4

Health citations are formal notices following inspections when they fail to comply with safety and care standards.

14 of 17 citations resulted from standard inspections; and 3 of 17 resulted from complaint investigations.

Breakdown of citation severity (last 3 years)
Critical Health citations More info 1
50% better than Texas average

Texas average: 2


Serious Health citations More info 0
100% better than Texas average

Texas average: 0.4

1 critical citation More info Texas average: 2

0 serious citations More info Texas average: 0.4

14 moderate citations More info Texas average: 23

2 minor citations More info Texas average: 0.4
Citations history (last 3 years)
Infection Control moderate citation Nov 08, 2024
Corrected

Nutrition moderate citation Nov 08, 2024
Corrected

Quality of Care moderate citation Nov 08, 2024
Corrected

Quality of Care critical citation Sep 20, 2024
Corrected

Compare Memory Care around Cameron County

The information below is reported by the Texas Health and Human Services Commission.
The Heights of Alamo
SNF

Nursing Home 24/7 care needed

MC

Memory Care Specialized care for those with Memory Loss, Alzheimer's, or dementia, ensuring safety and support.

Alamo
130
-
19
2
-
-
-
-
Private Rooms
Sun Valley Rehabilitation and Healthcare Center
SNF

Nursing Home 24/7 care needed

MC

Memory Care Specialized care for those with Memory Loss, Alzheimer's, or dementia, ensuring safety and support.

Harlingen
124
-
37
1
-
-
-
-
Private Rooms
Harlingen Nursing and Rehabilitation Center
SNF

Nursing Home 24/7 care needed

MC

Memory Care Specialized care for those with Memory Loss, Alzheimer's, or dementia, ensuring safety and support.

Harlingen
120
-
49
3
-
-
-
-
Private Rooms
Windsor Atrium
SNF

Nursing Home 24/7 care needed

MC

Memory Care Specialized care for those with Memory Loss, Alzheimer's, or dementia, ensuring safety and support.

Harlingen
120
-
14
3
-
-
-
-
Private Rooms

Places of interest near Harlingen Nursing and Rehabilitation Center

Address 2.5 miles from city center

Address 3810 Hale Ave, Harlingen, TX 78550

Calculate Travel Distance to Harlingen Nursing and Rehabilitation Center

Add your location

Address

Staffing Data

Source: CMS Payroll-Based Journal (Q2 2025)

115
Total Staff
99
Employees
16
Contractors
34,296
Total Hours (Quarter)
47
Avg Staff/Day
8
Avg Shift (hrs)
Nursing Staff Breakdown
Role Count Avg Shift (hrs) Uses Contractors?
Registered Nurse69.1 No
Licensed Practical Nurse207.7 No
Certified Nursing Assistant468.3 No
Staff by Category
Administration
2 staff
7.5hs shift avg
Nursing Staff
87 staff
8.2hs shift avg
Physicians & Practitioners
4 staff
8.1hs shift avg
Therapy Services
13 staff
6.4hs shift avg
Activities & Recreation
0 staff
0hs shift avg
Social Services
3 staff
3.8hs shift avg
Dietary Services
5 staff
8.2hs shift avg
Other Services
1 staff
7.6hs shift avg
Contractor Analysis
7.1%
of total hours from contractors
2,448 contractor hours this quarter
Physical Therapy Assistant: 4 Qualified Social Worker: 2 Speech Language Pathologist: 2 Respiratory Therapy Technician: 1 Medical Director: 1 Occupational Therapy Aide: 3 Occupational Therapy Assistant: 1 Physical Therapy Aide: 2
Role Employees Contractors Total Staff Total Hours Days Worked % of Days Avg Shift (hrs)
Certified Nursing Assistant4604615,71091100%8.3
Licensed Practical Nurse200205,46691100%7.7
Medication Aide/Technician7072,64991100%8
Registered Nurse6061,62591100%9.1
RN Director of Nursing2021,1037785%8.2
Clinical Nurse Specialist3031,0747481%7.7
Other Dietary Services Staff4041,0509099%8.1
Nurse Aide in Training6061,0266470%8
Physical Therapy Assistant0449117279%6.7
Speech Language Pathologist0227857380%6.3
Nurse Practitioner1015826571%9
Administrator1015536571%8.5
Dietitian1015366369%8.5
Respiratory Therapy Technician0114856673%7.4
Mental Health Service Worker1014576066%7.6
Occupational Therapy Aide0331221820%4.7
Qualified Social Worker123942527%3.8
Occupational Therapy Assistant0113867%6.3
Physical Therapy Aide022231112%2.1
Medical Director0116910%0.7

Facility Characteristics

Source: CMS Long-Term Care Facility Characteristics (Data as of Jan 2026)

Total census
102 residents
Residents by payment source
Medicare
3 residents (2.9%)
Medicaid
74 residents (72.5%)
Private pay or other
25 residents (24.5%)
Programs & Services
Residents' Group

Residents meet regularly to discuss policies, care quality, and activities

Nurse Aide Training

State-approved Nurse Aide Training and Competency Evaluation Program on-site

Active Resident Council

Organized group of residents that meets regularly to discuss facility policies, quality of life, and activities.

Quality of care over time

These measures show how residents usually do over time at this home, based on health outcomes and preventive care.

High-risk clinical events score Info A composite score based on pressure ulcers, falls with injury, weight loss, walking ability decline, and activities of daily living decline. 4.3
50% better than Texas average

Texas average: 8.6

Functional decline score Info A composite score based on activities of daily living decline, walking ability decline, and incontinence. 8.2
49% better than Texas average

Texas average: 16.0

Long-stay resident measures
Significantly above average Texas avg: 4.2 Info CMS star rating based on long-stay quality measure performance. 5 stars = significantly above average, 1 star = significantly below average.
Need for Help with Daily Activities Increased Info Percent of long-stay residents whose need for help with daily activities has increased 6.8%
58% better than Texas average

Texas average: 16.2%

Walking Ability Worsened Info Percent of long-stay residents whose ability to move independently worsened 5.5%
66% better than Texas average

Texas average: 16.2%

Low Risk Residents with Bowel/Bladder Incontinence Info Percent of low risk long-stay residents who lose control of their bowels or bladder 12.3%
21% better than Texas average

Texas average: 15.7%

Falls with Major Injury Info Percent of long-stay residents experiencing one or more falls with major injury 0.6%
83% better than Texas average

Texas average: 3.2%

High Risk Residents with Pressure Ulcers Info Percent of long-stay high risk residents with pressure ulcers 3.0%
31% better than Texas average

Texas average: 4.4%

Urinary Tract Infection Info Percent of long-stay residents with a urinary tract infection 0.0%
100% better than Texas average

Texas average: 0.8%

Lost Too Much Weight Info Percent of long-stay residents who lose too much weight 5.7%
63% worse than Texas average

Texas average: 3.5%

Depressive Symptoms Info Percent of long-stay residents who have depressive symptoms 0.3%
89% better than Texas average

Texas average: 2.9%

Antipsychotic Use Info Percent of long-stay residents who received an antipsychotic medication 0.9%
89% better than Texas average

Texas average: 7.9%

Pneumococcal Vaccine Info Percent of long-stay residents assessed and appropriately given the pneumococcal vaccine 100.0%
In line with Texas average

Texas average: 97.3%

Influenza Vaccine Info Percent of long-stay residents assessed and appropriately given the seasonal influenza vaccine 100.0%
In line with Texas average

Texas average: 97.9%

Short-stay resident measures
Significantly above average Texas avg: 2.9 Info CMS star rating based on short-stay quality measure performance. 5 stars = much above average, 1 star = much below average.
Pneumococcal Vaccine Info Percent of short-stay residents assessed and appropriately given the pneumococcal vaccine 99.8%
10% better than Texas average

Texas average: 90.4%

Antipsychotic medication increase Info Percent of short-stay residents who newly received an antipsychotic medication 1.2%
18% better than Texas average

Texas average: 1.4%

Influenza Vaccine Info Percent of short-stay residents assessed and appropriately given the seasonal influenza vaccine 100.0%
14% better than Texas average

Texas average: 88.0%

Re-hospitalized after SNF stay Info Percentage of short-stay residents who were re-hospitalized after their nursing home admission. 23.6%
9% better than Texas average

Texas average: 25.9%

Emergency department visits Info Percentage of short-stay residents who had an outpatient emergency department visit. 3.0%
75% better than Texas average

Texas average: 12.0%

Falls with major injury Info Percentage of SNF residents who experience falls with major injury during their stay. 0.0%
100% better than Texas average

Texas average: 0.8%

Ability to care for self at discharge Info Percentage of residents at or above expected ability to care for themselves at discharge. 40.5%
24% worse than Texas average

Texas average: 53.7%

Successful return to home or community Info Rate of successful return to home or community from a skilled nursing facility. 67.8%
34% better than Texas average

Texas average: 50.6%

Penalties and fines

Federal penalties imposed by CMS for regulatory violations, including civil money penalties (fines) and denials of payment for new Medicare/Medicaid admissions.

Source: CMS Penalties Database (Data as of Jan 2026)

Total fines amount $6K
93% lower than Texas average

Texas average: $80K

Number of fines 1
60% fewer fines than Texas average

Texas average: 2.5

Payment Denials Info Serious action where Medicare and/or Medicaid temporarily stops payments for new residents until issues are fixed. 0
100% fewer payment denials than Texas average

Texas average: 0.2

Fines amount comparison
This facility $6K
Texas average $80K
Penalty History

Penalties are imposed by CMS for violations of federal nursing home regulations.

Civil Money Penalty Info Fines imposed for noncompliance, which can be assessed per day or per instance of violation. Sep 20, 2024
$6K

Last updated: Jan 2026

Guides for Better Senior Living

Care Cost Calculator: See Prices in Your Area

Nursing Home Data Explorer

Don’t Wait Too Long: 7 Red Flag Signs Your Parent Needs Assisted Living Now

The True Cost of Assisted Living in 2025 – And How Families Are Paying For It

Understanding Senior Living Costs: Pricing Models, Discounts & Financial Assistance

Financial Aid for Texas Seniors

Get financial aid guidance

Community Care for the Aged and Disabled (CCAD)

TX Medicaid CCAD

Age 65+ or disabled, Texas resident, Medicaid-eligible, care need (not always nursing home level).

~$2,829/month (300% FBR, individual).

$2,000 (individual), $3,000 (couple).

Large state; rural access challenges.

Texas Community Care Services

TX CCS

Age 60+, Texas resident, at risk of decline.

~$2,000/month (individual, varies).

$5,000 (individual).

Limited funding; high demand in urban areas.

Area Agency on Aging (AAA) Services

Texas AAA Services

Age 60+, TX resident; no income/asset limits.

None; donations encouraged.

Not assessed.

28 AAAs; includes Meals on Wheels in some areas.

Medicare Savings Program (MSP)

Texas Medicare Savings Program

Age 65+ or disabled, TX resident, Medicare Part A/B.

~$2,510/month (QMB), ~$3,380/month (SLMB), ~$3,598/month (QI)—individual.

$9,430 (individual), $14,130 (couple).

Includes Extra Help for Part D; no waitlist.

Low-Income Home Energy Assistance Program (LIHEAP)

Texas Comprehensive Energy Assistance Program (CEAP)

Age 60+ prioritized, TX resident, low-income.

~$3,970/month (185% FPL).

Not assessed.

Priority for elderly/disabled; covers gas, electric, propane.

Family Caregiver Support Program (FCSP)

Texas Family Caregiver Support Program

Caregivers of 60+ needing care or 55+ caregivers of others; TX resident; 2+ ADLs.

No strict cap; prioritizes low-income (~$24,980/year).

Not assessed.

High rural demand; includes grandparent caregivers.

Senior Community Service Employment Program (SCSEP)

Texas SCSEP

Age 55+, unemployed, low-income, TX resident.

~$1,983/month (125% FPL).

Not specified.

Priority for veterans, rural residents; AARP partnership.

VA Aid and Attendance (A&A) and Housebound Benefits

Texas VA Aid and Attendance/Housebound

Age 65+ or disabled veteran/spouse, TX resident, wartime service, ADL help (A&A) or homebound.

Net income < ~$1,984/month (veteran with dependent, A&A); pension offsets income.

~$155,356 (net worth).

High veteran population; supports rural/urban needs.

Property Tax Exemption for Seniors

Texas Senior Property Tax Exemption

Age 65+, TX resident, homeowner (homestead).

None; tax-based eligibility.

Not assessed.

$25,000+ exemption; optional freeze in some counties; saves ~$500-$1,000/year.

Senior Farmers’ Market Nutrition Program (SFMNP)

Texas SFMNP

Age 60+, TX resident, low-income.

~$2,322/month (185% FPL).

Not assessed.

Vouchers (~$50/season); serves ~20,000 via 28 AAAs.