Harlingen Nursing and Rehabilitation Center

Memory Care in Cameron County

CMS overall rating Info The Overall CMS Rating combines results from health inspections, staffing levels and quality measures. Health inspections carry the most weight. Staffing and quality scores can increase or decrease the final rating based on performance compared to state and national standards.

Overview of Harlingen Nursing and Rehabilitation Center

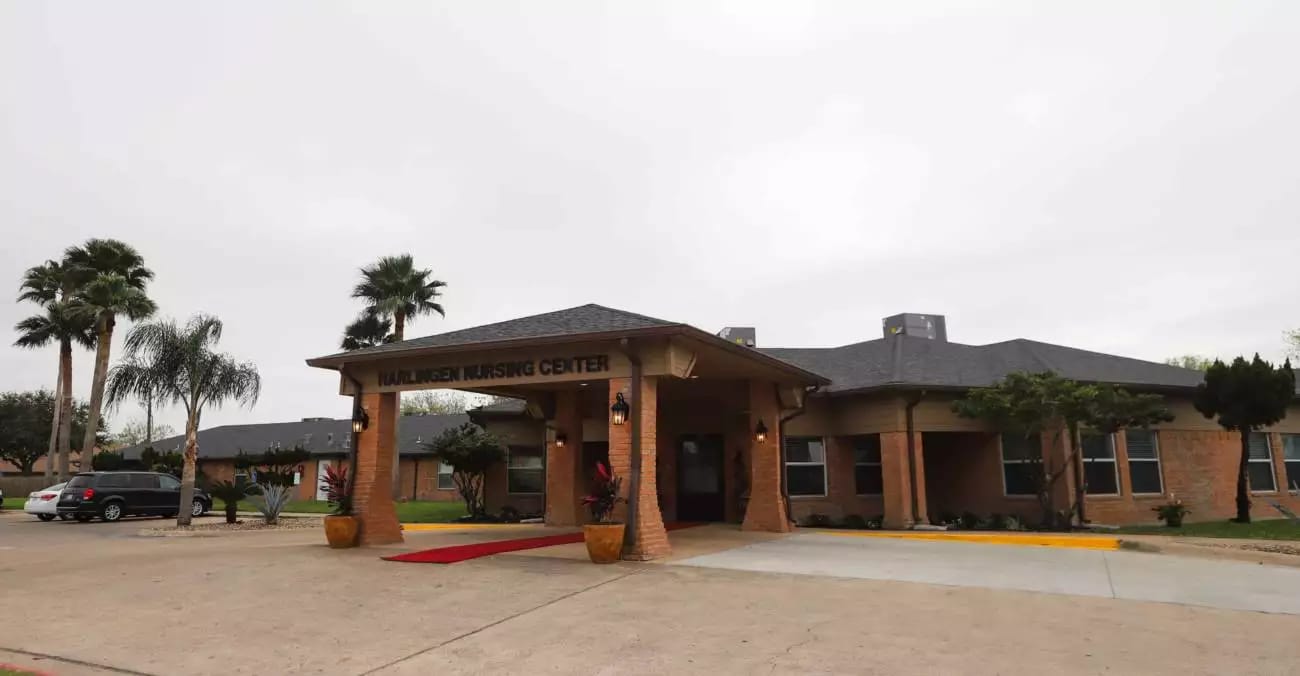
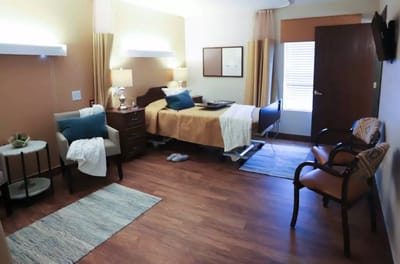
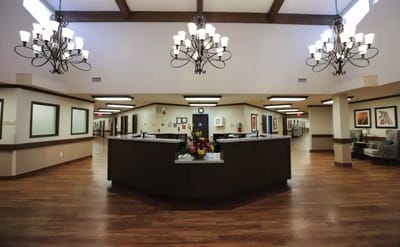
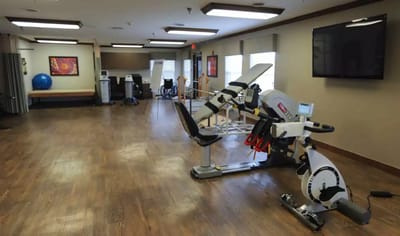
Discover an exceptional living experience with the Harlingen Nursing and Rehabilitation Center located in Harlingen, TX, providing skilled nursing and clinical services, therapy services and rehabilitation, hospice services, and home health services. Here, well-appointed and comfortable accommodations with different floor plans are available for its residents. With an expert and dedicated team, residents can receive care and comfort for quality of life during their stay.

The community is committed to providing its residents with the healthiest life possible. Moreover, with its top-tier amenities and services, residents can enjoy the following: delightful and healthy meals, wifi and cable services, a beauty salon, and transportation services. Visit its beautiful and lovely common spaces such as the courtyard and meet new companions along the way. At the Harlingen Nursing and Rehabilitation Center, seniors are guaranteed a blissful and secure living experience.

(956) 412-8660

Quality ratings

Measured by Centers for Medicare & Medicaid Services (CMS)

Overall rating Info The Overall CMS Rating combines results from health inspections, staffing levels and quality measures. Health inspections carry the most weight. Staffing and quality scores can increase or decrease the final rating based on performance compared to state and national standards.
5/5 ▲ 2.0 Texas average: 3.0/5
Health Inspection Info Based on the results of the facility's three most recent standard inspections and any complaint investigations. CMS reviews the number, scope, and severity of deficiencies, with more recent findings weighted more heavily.
5/5 ▲ 2.1 Texas average: 2.9/5
Staffing Info Measures average nursing staff hours per resident per day, including Registered Nurses (RNs) and total nursing staff. Ratings are adjusted based on the level of care residents require and are compared to state and national benchmarks.
1/5 ▼ 1.4 Texas average: 2.4/5
Quality Measures Info Based on clinical and physical health indicators reported to CMS, such as hospital readmissions, falls, pressure ulcers, and improvements in mobility. These measures reflect how well residents' health needs are being managed.
5/5 ▲ 1.1 Texas average: 4.0/5

Staffing hours breakdown

Info Daily nursing hours per resident by staff type, reported to CMS. Higher is generally better — compare this facility to state and national averages to see where staffing stands.

Hours per resident per day — compared to Texas state averages

Total nursing care / resident Info This home is ranked 212th out of 246 homes in Texas.

Total adjusted nursing hours per resident per day, combining RN, LPN, and aide time. CMS adjusts this for case-mix so facilities can be fairly compared.
2h 59m per day
This facility Texas avg (3h 47m per day)
vs Texas avg
-21%

4 of 5 metrics below state avg

Standout metric Nurse Aide is +7% above state avg
Staff typeHours / dayvs state avg
Registered Nurse (RN) Info RNs hold the highest nursing license and can assess residents, interpret test results, and direct care plans. More RN hours per day often signals stronger clinical oversight and faster response to health changes. 19m per day ▼ 27% State avg: 26m per day · National avg: 41m per day
Nurse Aide Info Certified Nurse Aides (CNAs) provide the most direct day-to-day assistance: bathing, dressing, feeding, and mobility. Nurse aide hours are typically the largest staffing category and directly affect residents' quality of life. 2h 10m per day ▲ 7% State avg: 2h 1m per day · National avg: 2h 21m per day
Total Nursing (Weekend) Info Combined nursing hours (RN + LPN + Nurse Aide) per resident per day on weekends. Staffing often drops on weekends — this figure reveals whether the facility maintains adequate coverage outside of weekday hours. 2h 49m per day ▼ 6% State avg: 2h 59m per day · National avg: 3h 26m per day
Physical Therapist Info Hours per resident per day provided by licensed Physical Therapists (PTs) or PT Assistants. PT services help residents recover mobility after injury or illness and are especially important for post-acute (short-stay) rehabilitation. 2m per day ▼ 50% State avg: 4m per day · National avg: 4m per day
RN (Weekend) Info Registered nurse hours specifically on weekends. Facilities sometimes reduce RN presence on Saturdays and Sundays — a low weekend RN figure compared to weekday hours can indicate reduced clinical oversight when most administrative staff are absent. 11m per day ▼ 48% State avg: 21m per day · National avg: 29m per day

Capacity and availability

Medium-capacity home

Offers a balance of services and community atmosphere.

Total beds 120
Avg. Length of Stay
137 days

Who this home usually serves

TYPE OF STAY

Primarily long-term care, limited rehab

Most residents stay long-term, while a smaller portion are admitted for short-term rehab.

Might be optimal for
Long-term residence Daily assistance Occasional rehab needs

Breakdown by payment type

Medicare

16% of new residents, usually for short-term rehab.

Typical stay 1 - 2 months

Private pay

68% of new residents, often for short stays.

Typical stay 2 months

Medicaid

17% of new residents, often for long-term daily care.

Typical stay 2 years

Finances and operations

Privately-owned community
Home revenue
$9.1M
Profit
$1.8M
Privately-owned community
Home revenue
$9.1M
Profit
$1.8M
Payroll costs Info The portion of the home's budget spent on staff, including nurses, caregivers, and other employees who support care and operations.
$3.2M
35.6% of revenue
Other operating costs Info All remaining costs needed to run the home, such as food, utilities, building maintenance, supplies and administrative expenses.
$4.1M
Total costs $7.3M
Bed community size
120-bed community
A larger shared setting that may offer more common spaces and organized community services.
Years in operation
29 years in operation
A longer operating history, which may indicate experience navigating regulations and delivering ongoing care.
Walk Score
Walk Score: 49 / 100
Somewhat walkable. A few nearby services may be reachable on foot, but most trips require transportation.

Services

Medicare/medicaid

About this community

Occupancy

Occupancy rate
15%
In line with Texas average
Occupied beds
18 / 120
Average residents 75 per day

License Details

Facility TypeNursing
IssuanceJanuary 3, 2023
ExpirationJanuary 3, 2026
CountyCameron
License Number311300
Year Opened6/26/1996

Ownership & Operating Entity

Harlingen Nursing and Rehabilitation Center is administrated by Jose Longoria.

Management CompanyREGENCY IHS OF HARLINGEN LLC
OwnerOAKBEND MEDICAL CENTER
Ownership TypeCOUNTY

Type Of Units

Medicaid and Medicare
120 units
Total beds
120 units

Staffing

Key information about the people who lead and staff this community.

Leadership

Administrator Email [email protected]

What does this home offer?

Accepts Medicaid icon

Accept Medicaid: Yes

Total residents icon

Total Residents: 120

Housing options icon

Housing Options: Private Rooms

Building type icon
Building type icon

Building Type: Single-story

Transportation services icon

Transportation Services

Fitness and recreation icon

Fitness and Recreation

Types of Care at Harlingen Nursing and Rehabilitation Center

Memory Care

Contact Harlingen Nursing and Rehabilitation Center

Inspection History

In Texas, the Health and Human Services Commission (HHSC) is the primary regulatory body that conducts unannounced inspections and publishes quality reports for all long-term care homes.

5 visits/inspections Info Inspections are mandatory, regular evaluations conducted by state health departments or regulatory agencies. They ensure the community provides safe, compliant care, covering areas like resident health, staff and management.

Latest inspection

Date November 8, 2024
Routine

17 deficiencies

Deficiencies indicate regulatory issues. A higher number implies the facility had several areas requiring improvement.

Texas average: 32 deficiencies

Inspection Report Summary for Harlingen Nursing and Rehabilitation Center

The most recent inspection on November 8, 2024, found deficiencies related to grooming services, food labeling, and infection prevention and control practices. Earlier inspections showed a pattern of issues including care plan implementation, medical record documentation, resident supervision, dignity, activities, and infection control. A notable complaint investigation in September 2024 identified immediate jeopardy due to inadequate supervision leading to a resident elopement, which was corrected promptly. Other complaint investigations substantiated concerns about dignity, activities, and infection control lapses. The facility’s inspection history shows ongoing challenges in care and infection control, with some corrective actions taken but recurring issues noted over time.

Health Inspection History

Inspections
Total health inspections 5

Texas average 7.4


Last Health inspection on Nov 2024

Total health citations 17

Texas average 25.9

Citations per inspection
3.4

Texas average 3.67


Health citations are formal notices following inspections when they fail to comply with safety and care standards.

14 of 17 citations resulted from standard inspections; and 3 of 17 resulted from complaint investigations.

Breakdown of citation severity (last 3 years)
Critical Health citations More info 1
50% better than Texas average

Texas average: 2


Serious Health citations More info 0
100% better than Texas average

Texas average: 0.4

1 critical citation More info Texas average: 2

0 serious citations More info Texas average: 0.4

14 moderate citations More info Texas average: 23

2 minor citations More info Texas average: 0.4
Citations history (last 3 years)
Infection Control moderate citation Info Issues related to preventing and controlling infections, including hygiene practices and safety protocols. Nov 08, 2024
Corrected

Nutrition moderate citation Info Issues related to food quality, meal service, and resident's nutritional needs. Nov 08, 2024
Corrected

Quality of Care moderate citation Info Issues related to how well residents receive appropriate treatment and support for their medical and daily care needs. Nov 08, 2024
Corrected

Quality of Care critical citation Info Issues related to how well residents receive appropriate treatment and support for their medical and daily care needs. Sep 20, 2024
Corrected

Compare Memory Care around Cameron County The information below is reported by the Texas Health and Human Services Commission.

Filter by care type
The Heights of Alamo
NH

Nursing Home Licensed facility providing 24/7 skilled nursing care for residents with complex, ongoing medical needs. Staffed by RNs, LPNs, and CNAs. Inspected and star-rated annually by CMS. Accepts Medicare (short-term rehab) and Medicaid (long-term care).

MC

Memory Care Secured, specialized care for people living with Alzheimer's or dementia. Staff trained in cognitive impairment, with higher staff-to-resident ratios and an environment designed to reduce confusion and wandering risk.

Alamo130No 19 8-844Private Rooms
Sun Valley Rehabilitation and Healthcare Center
NH

Nursing Home Licensed facility providing 24/7 skilled nursing care for residents with complex, ongoing medical needs. Staffed by RNs, LPNs, and CNAs. Inspected and star-rated annually by CMS. Accepts Medicare (short-term rehab) and Medicaid (long-term care).

MC

Memory Care Secured, specialized care for people living with Alzheimer's or dementia. Staff trained in cognitive impairment, with higher staff-to-resident ratios and an environment designed to reduce confusion and wandering risk.

Harlingen (Estrellita Subdivision)124No 37 5-000Private Rooms
Harlingen Nursing and Rehabilitation Center
NH

Nursing Home Licensed facility providing 24/7 skilled nursing care for residents with complex, ongoing medical needs. Staffed by RNs, LPNs, and CNAs. Inspected and star-rated annually by CMS. Accepts Medicare (short-term rehab) and Medicaid (long-term care).

MC

Memory Care Secured, specialized care for people living with Alzheimer's or dementia. Staff trained in cognitive impairment, with higher staff-to-resident ratios and an environment designed to reduce confusion and wandering risk.

Harlingen (Hale Avenue)120No 49 29-000Private Rooms
Windsor Atrium
NH

Nursing Home Licensed facility providing 24/7 skilled nursing care for residents with complex, ongoing medical needs. Staffed by RNs, LPNs, and CNAs. Inspected and star-rated annually by CMS. Accepts Medicare (short-term rehab) and Medicaid (long-term care).

MC

Memory Care Secured, specialized care for people living with Alzheimer's or dementia. Staff trained in cognitive impairment, with higher staff-to-resident ratios and an environment designed to reduce confusion and wandering risk.

Harlingen120No 14 50-312Private Rooms

Financial Assistance for
Memory Care in Texas

Get Financial aid guidance

Community Care for the Aged and Disabled (CCAD)

TX Medicaid CCAD

Age 65+ or disabled
General Texas resident, Medicaid-eligible, care need (not always nursing home level).
Income Limits (2025) ~$2,829/month 300% FBR, individual
Asset Limits $2,000 (individual), $3,000 (couple).
TX

Large state; rural access challenges.

Benefits
Personal care (5-7 hours/day) Respite (240 hours/year) Adult day care (~$60/day) Home aides

Texas Community Care Services

TX CCS

Age 60+
General Texas resident, at risk of decline.
Income Limits ~$2,000/month individual, varies
Asset Limits $5,000 individual
TX

Limited funding; high demand in urban areas.

Benefits
In-home care (3-5 hours/week) Respite (up to 10 days/year) Transportation (~5 trips/month)

Area Agency on Aging (AAA) Services

Texas AAA Services

Age 60+
General TX resident; no income/asset limits.
Income Limits (2025) None; donations encouraged.
Asset Limits Not assessed.
TX

28 AAAs; includes Meals on Wheels in some areas.

Benefits
Meals (~$5-$7/meal) Transportation Homemaker services (~4 hours/week) Respite (~5 days/year) Legal aid

Medicare Savings Program (MSP)

Texas Medicare Savings Program

Age 65+ or disabled
General TX resident, Medicare Part A/B.
Income Limits (2025) ~$2,510/month (QMB), ~$3,380/month (SLMB), ~$3,598/month (QI)—individual.
Asset Limits $9,430 (individual), $14,130 (couple).
TX

Includes Extra Help for Part D; no waitlist.

Benefits
Covers Part B premiums ($174.70/month) Deductibles ($240/year) Copays (~20%)

Low-Income Home Energy Assistance Program (LIHEAP)

Texas Comprehensive Energy Assistance Program (CEAP)

Age 60+ prioritized
General TX resident, low-income.
Income Limits (2025) ~$3,970/month 185% FPL
Asset Limits Not assessed.
TX

Priority for elderly/disabled; covers gas, electric, propane.

Benefits
Heating/cooling aid ($300-$1,000/season) Emergency aid ($500 max)

Family Caregiver Support Program (FCSP)

Texas Family Caregiver Support Program

Age
General Caregivers of 60+ needing care or 55+ caregivers of others; TX resident; 2+ ADLs.
Income Limits (2025) No strict cap; prioritizes low-income ~$24,980/year
Asset Limits Not assessed.
TX

High rural demand; includes grandparent caregivers.

Benefits
Respite (4-6 hours/week or 5 days/year) Adult day care ($60/day) Training Supplies (~$500/year)

Senior Community Service Employment Program (SCSEP)

Texas SCSEP

Age 55+
General unemployed, low-income, TX resident.
Income Limits (2025) ~$1,983/month 125% FPL
Asset Limits Not specified.
TX

Priority for veterans, rural residents; AARP partnership.

Benefits
Paid training (~20 hours/week at ~$7.25/hour) Job placement

VA Aid and Attendance (A&A) and Housebound Benefits

Texas VA Aid and Attendance/Housebound

Age 65+ or disabled veteran/spouse
General TX resident, wartime service, ADL help (A&A) or homebound.
Income Limits (2025) Net income < ~$1,984/month (veteran with dependent, A&A); pension offsets income.
Asset Limits ~$155,356 net worth
TX

High veteran population; supports rural/urban needs.

Benefits
Cash (~$1,433-$2,642/month veteran, ~$951-$1,318 spouse) for care costs

Property Tax Exemption for Seniors

Texas Senior Property Tax Exemption

Age 65+
General TX resident, homeowner (homestead).
Income Limits (2025) None; tax-based eligibility.
Asset Limits Not assessed.
TX

$25,000+ exemption; optional freeze in some counties; saves ~$500-$1,000/year.

Benefits
Tax exemption or freeze (~$500-$1,000/year savings)

Senior Farmers’ Market Nutrition Program (SFMNP)

Texas SFMNP

Age 60+
General TX resident, low-income.
Income Limits (2025) ~$2,322/month 185% FPL
Asset Limits Not assessed.
TX

Vouchers (~$50/season); serves ~20,000 via 28 AAAs.

Benefits
Vouchers (~$50/season) for produce at farmers’ markets

Places of interest near Harlingen Nursing and Rehabilitation Center

Address 2.5 miles from city center Info Estimated distance in miles from Harlingen's city center to Harlingen Nursing and Rehabilitation Center's address, calculated via Google Maps.

Calculate Travel Distance to Harlingen Nursing and Rehabilitation Center

Add your location

Address

Staffing Data (Q2 2025)

This data corresponds to Q2 2025 and is based on CMS Payroll-Based Journal.

Total staff 115
Employees 99
Contractors 16
Staff to resident ratio 1.13:1
25% worse than Texas average

Texas average ratio: 1.51:1

Avg staff/day 47
Average shift 8 hours
0% compared with Texas average

Texas average: 8.1 hours

Total staff hours (quarter) 34,296
Nursing staff breakdown
Registered Nurse

Manages medical care and health needs.

Total count 6
Average shift length Info Average shift length. Calculated as total hours divided by days worked and average staff per day. 9.1 hours

No contractors work on this role.

Licensed Practical Nurse

Assists with medical care and medications.

Total count 20
Average shift length Info Average shift length. Calculated as total hours divided by days worked and average staff per day. 7.7 hours

No contractors work on this role.

Certified Nursing Assistant

Helps with daily care and mobility.

Total count 46
Average shift length Info Average shift length. Calculated as total hours divided by days worked and average staff per day. 8.3 hours

No contractors work on this role.

Contractor staffing

Total hours from contractors

7.1%

2,448 contractor hours this quarter

Physical Therapy Assistant: 4 Occupational Therapy Aide: 3 Qualified Social Worker: 2 Speech Language Pathologist: 2 Physical Therapy Aide: 2 Respiratory Therapy Technician: 1 Medical Director: 1 Occupational Therapy Assistant: 1
Staff by category
Certified Nursing Assistant4604615,71091100%8.3
Licensed Practical Nurse200205,46691100%7.7
Medication Aide/Technician7072,64991100%8
Registered Nurse6061,62591100%9.1
RN Director of Nursing2021,1037785%8.2
Clinical Nurse Specialist3031,0747481%7.7
Other Dietary Services Staff4041,0509099%8.1
Nurse Aide in Training6061,0266470%8
Physical Therapy Assistant0449117279%6.7
Speech Language Pathologist0227857380%6.3
Nurse Practitioner1015826571%9
Administrator1015536571%8.5
Dietitian1015366369%8.5
Respiratory Therapy Technician0114856673%7.4
Mental Health Service Worker1014576066%7.6
Occupational Therapy Aide0331221820%4.7
Qualified Social Worker123942527%3.8
Occupational Therapy Assistant0113867%6.3
Physical Therapy Aide022231112%2.1
Medical Director0116910%0.7
46 Certified Nursing Assistant
% of Days 100%
20 Licensed Practical Nurse
% of Days 100%
7 Medication Aide/Technician
% of Days 100%
6 Registered Nurse
% of Days 100%
2 RN Director of Nursing
% of Days 85%
3 Clinical Nurse Specialist
% of Days 81%
4 Other Dietary Services Staff
% of Days 99%
6 Nurse Aide in Training
% of Days 70%
4 Physical Therapy Assistant
% of Days 79%
2 Speech Language Pathologist
% of Days 80%
1 Nurse Practitioner
% of Days 71%
1 Administrator
% of Days 71%
1 Dietitian
% of Days 69%
1 Respiratory Therapy Technician
% of Days 73%
1 Mental Health Service Worker
% of Days 66%
3 Occupational Therapy Aide
% of Days 20%
3 Qualified Social Worker
% of Days 27%
1 Occupational Therapy Assistant
% of Days 7%
2 Physical Therapy Aide
% of Days 12%
1 Medical Director
% of Days 10%

Facility Characteristics

Source: CMS Long-Term Care Facility Characteristics (Data as of Jan 2026)

Total residents 102
Medicare
3
2.9% of residents
Medicaid
74
72.5% of residents
Private pay or other
25
24.5% of residents
Programs & Services
Residents Group

Residents meet regularly to discuss policies, care quality, and activities

Nurse Aide Training

State-approved Nurse Aide Training and Competency Evaluation Program on-site

Active Resident Council

Organized group of residents that meets regularly to discuss facility policies, quality of life, and activities.

Quality of care over time

These measures show how residents usually do over time at this home, based on health outcomes and preventive care.

High-risk clinical events score Info A composite score based on pressure ulcers, falls with injury, weight loss, walking ability decline, and activities of daily living decline. 4.3
50% better than Texas average

Texas average: 8.6

Functional decline score Info A composite score based on activities of daily living decline, walking ability decline, and incontinence. 8.2
49% better than Texas average

Texas average: 16.0

Long-stay resident measures
Significantly above average Texas avg: 4.2 Info CMS star rating based on long-stay quality measure performance. 5 stars = significantly above average, 1 star = significantly below average.
Need for Help with Daily Activities Increased Info Percent of long-stay residents whose need for help with daily activities has increased 6.8%
58% better than Texas average

Texas average: 16.2%

Walking Ability Worsened Info Percent of long-stay residents whose ability to move independently worsened 5.5%
66% better than Texas average

Texas average: 16.2%

Low Risk Residents with Bowel/Bladder Incontinence Info Percent of low risk long-stay residents who lose control of their bowels or bladder 12.3%
21% better than Texas average

Texas average: 15.7%

Falls with Major Injury Info Percent of long-stay residents experiencing one or more falls with major injury 0.6%
83% better than Texas average

Texas average: 3.2%

High Risk Residents with Pressure Ulcers Info Percent of long-stay high risk residents with pressure ulcers 3.0%
31% better than Texas average

Texas average: 4.4%

Urinary Tract Infection Info Percent of long-stay residents with a urinary tract infection 0.0%
100% better than Texas average

Texas average: 0.8%

Lost Too Much Weight Info Percent of long-stay residents who lose too much weight 5.7%
63% worse than Texas average

Texas average: 3.5%

Depressive Symptoms Info Percent of long-stay residents who have depressive symptoms 0.3%
89% better than Texas average

Texas average: 2.9%

Antipsychotic Use Info Percent of long-stay residents who received an antipsychotic medication 0.9%
89% better than Texas average

Texas average: 7.9%

Pneumococcal Vaccine Info Percent of long-stay residents assessed and appropriately given the pneumococcal vaccine 100.0%
In line with Texas average

Texas average: 97.3%

Influenza Vaccine Info Percent of long-stay residents assessed and appropriately given the seasonal influenza vaccine 100.0%
In line with Texas average

Texas average: 97.9%

Short-stay resident measures
Significantly above average Texas avg: 2.9 Info CMS star rating based on short-stay quality measure performance. 5 stars = much above average, 1 star = much below average.
Pneumococcal Vaccine Info Percent of short-stay residents assessed and appropriately given the pneumococcal vaccine 99.8%
10% better than Texas average

Texas average: 90.4%

Antipsychotic medication increase Info Percent of short-stay residents who newly received an antipsychotic medication 1.2%
18% better than Texas average

Texas average: 1.4%

Influenza Vaccine Info Percent of short-stay residents assessed and appropriately given the seasonal influenza vaccine 100.0%
14% better than Texas average

Texas average: 88.0%

Re-hospitalized after SNF stay Info Percentage of short-stay residents who were re-hospitalized after their nursing home admission. 23.6%
9% better than Texas average

Texas average: 25.9%

Emergency department visits Info Percentage of short-stay residents who had an outpatient emergency department visit. 3.0%
75% better than Texas average

Texas average: 12.0%

Falls with major injury Info Percentage of SNF residents who experience falls with major injury during their stay. 0.0%
100% better than Texas average

Texas average: 0.8%

Ability to care for self at discharge Info Percentage of residents at or above expected ability to care for themselves at discharge. 40.5%
24% worse than Texas average

Texas average: 53.7%

Successful return to home or community Info Rate of successful return to home or community from a skilled nursing facility. 67.8%
34% better than Texas average

Texas average: 50.6%

Penalties and fines

Federal penalties imposed by CMS for regulatory violations, including civil money penalties (fines) and denials of payment for new Medicare/Medicaid admissions.

Source: CMS Penalties Database (Data as of Jan 2026)

Total fines amount $6K
93% lower than Texas average

Texas average: $80K

Number of fines 1
60% fewer fines than Texas average

Texas average: 2.5

Payment Denials Info Serious action where Medicare and/or Medicaid temporarily stops payments for new residents until issues are fixed. 0
100% fewer payment denials than Texas average

Texas average: 0.2

Fines amount comparison
This facility $6K
Texas average $80K
Penalty History

Penalties are imposed by CMS for violations of federal nursing home regulations.

Civil Money Penalty Info Fines imposed for noncompliance, which can be assessed per day or per instance of violation. Sep 20, 2024
$6K

Last updated: Jan 2026

Guides for Better Senior Living

Care Cost Calculator: See Prices in Your Area

Nursing Home Data Explorer

Don’t Wait Too Long: 7 Red Flag Signs Your Parent Needs Assisted Living Now

The True Cost of Assisted Living in 2025 – And How Families Are Paying For It

Understanding Senior Living Costs: Pricing Models, Discounts & Financial Assistance

Explore Open Rooms
1 Contact details
2 What type of senior care service are you looking for?
3 What budget do you have in mind for senior care?
4 How soon do you need to find care?
5 Additional details

Thank you for your interest!

Our team will be in touch shortly to help with next steps.