Harrison House of Georgetown
Nursing Home & Skilled Nursing · Delaware, DE
CMS overall rating Info CMS (the Centers for Medicare & Medicaid Services) is the federal agency that rates nursing home quality. Its Overall Rating runs from 1 to 5 stars, combining health inspections, staffing, and quality measures, with inspections weighted most heavily.

Harrison House of Georgetown

Nursing Home & Skilled Nursing · Delaware, DE
CMS overall rating Info CMS (the Centers for Medicare & Medicaid Services) is the federal agency that rates nursing home quality. Its Overall Rating runs from 1 to 5 stars, combining health inspections, staffing, and quality measures, with inspections weighted most heavily.
Calculator: See prices in your area
Harrison House of Georgetown accepts Medicare, Medicaid, and private pay.

Overview of Harrison House of Georgetown

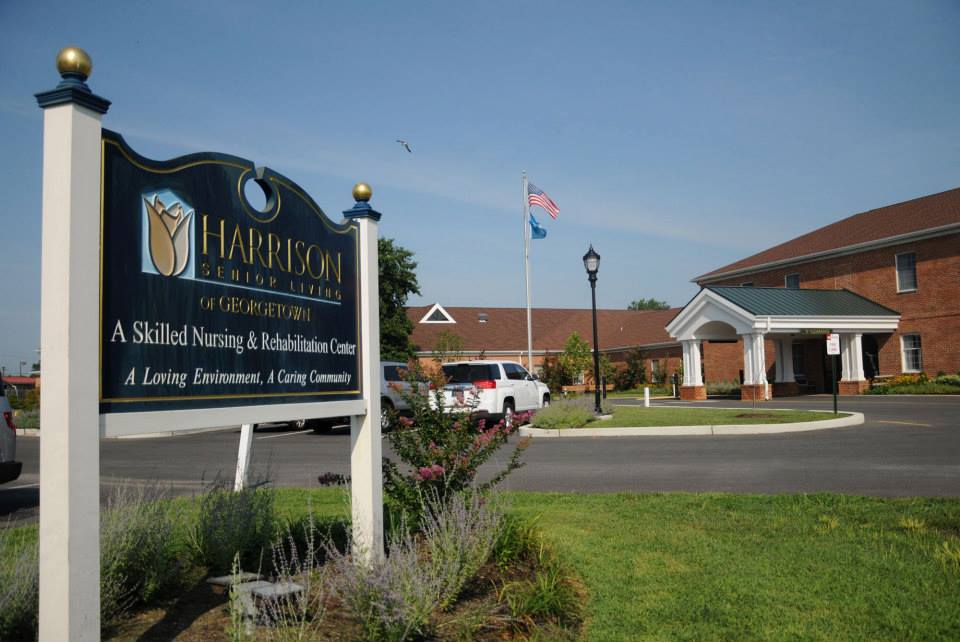
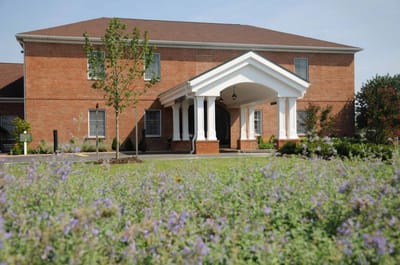
In the picturesque Georgetown, Delaware, Harrison House of Georgetown stands as a beacon of advanced therapeutic services catering to the needs of residents from eastern Connecticut to western New York. Evoking the tranquility of a farmhouse along the Eastern shore, this senior living community provides a serene backdrop for residents on their journey to regaining functionality. With 24-hour skilled nursing care, an on-site physician, and a dedicated Medical Director, Harrison House of Georgetown places the well-being and rehabilitation of its residents at the forefront of its commitment. Harrison House of Georgetown has been a bastion of 24-hour care for over three decades, overseen by licensed skilled nurses and compassionate caregivers. The private and semi-private rooms, recently revitalized, offer views of landscaped grounds or meticulously designed gardens, providing a rejuvenating environment for residents.

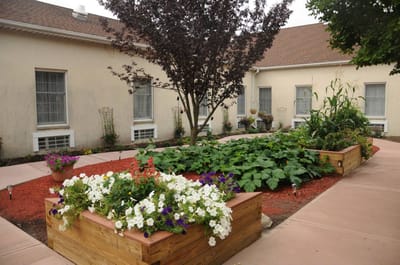
The campus boasts conveniences to streamline daily tasks, including a barber and beauty salon, restaurant-style dining, a private guest dining room, religious services, and transportation services. Whether requiring short-term or long-term skilled nursing care, Harrison House of Georgetown ensures residents receive superior attention and care from a highly-trained staff. The on-site rehab gym, featuring an Activities of Daily Living (ADL) suite, empowers residents for a triumphant return home by practicing essential daily activities such as dressing, self-feeding, laundry, meal preparation, and bathing. Collaborating closely with each resident, occupational therapists instill confidence and comfort in performing these vital skills. The impeccably maintained gardens and expansive porch area beckon residents and their families to unwind on comfortable rocking chairs. In the recently renovated services area, a dedicated team of tenured skilled nurses and therapists tirelessly collaborate to guide each individual toward achieving and sustaining their highest level of independence.

(302) 856-4574

Quality ratings

Measured by Centers for Medicare & Medicaid Services (CMS)

Overall rating Info The Overall CMS Rating combines results from health inspections, staffing levels and quality measures. Health inspections carry the most weight. Staffing and quality scores can increase or decrease the final rating based on performance compared to state and national standards.
▼ 38.8% Below DE avg. ▼ 38.8% Below DE avg.Click the badge to see the full State ranking.Click here to see the full State ranking.
Health Inspection Info Based on the results of the facility's three most recent standard inspections and any complaint investigations. CMS reviews the number, scope, and severity of deficiencies, with more recent findings weighted more heavily.
▼ 25.7% Below DE avg. ▼ 25.7% Below DE avg.Click the badge to see the full State ranking.Click here to see the full State ranking.
Staffing Info Measures average nursing staff hours per resident per day, including Registered Nurses (RNs) and total nursing staff. Ratings are adjusted based on the level of care residents require and are compared to state and national benchmarks.
▼ 24.2% Below DE avg. ▼ 24.2% Below DE avg.Click the badge to see the full State ranking.Click here to see the full State ranking.
Quality Measures Info Based on clinical and physical health indicators reported to CMS, such as hospital readmissions, falls, pressure ulcers, and improvements in mobility. These measures reflect how well residents' health needs are being managed.
▼ 52.7% Below DE avg. ▼ 52.7% Below DE avg.Click the badge to see the full State ranking.Click here to see the full State ranking.

Staffing hours breakdown

Info Daily nursing hours per resident by staff type, reported to CMS. Higher is generally better — compare this facility to state and national averages to see where staffing stands.

Hours per resident per day — compared to Delaware state averages

Total nursing care / resident Info This home is ranked 23rd out of 38 homes in Delaware for nurse hours. Total adjusted nursing hours per resident per day, combining RN, LPN, and aide time. CMS adjusts this for case-mix so facilities can be fairly compared.
4h 8m per day
Rank #23 / 38Nurse hours — State benchmarkedThis home is ranked 23rd out of 38 homes in Delaware for nurse hours. Shows adjusted nurse hours per resident per day benchmarked to the Delaware average, with a ranking across 38 Delaware SNFs. More hours mean more direct care. The national average is about 3.5 hrs; below 3.0 is a red flag.Click the rank badge to see the full State ranking.Click here to see the full State ranking.
This facility Delaware avg (4h 43m per day)
vs Delaware avg
-13%

5 of 6 metrics below state avg

Standout metric LPN / LVN is +10% above state avg
Staff typeHours / Day / Residentvs state avg
Registered Nurse (RN) Info RNs hold the highest nursing license and can assess residents, interpret test results, and direct care plans. More RN hours per day often signals stronger clinical oversight and faster response to health changes. 36m per day ▼ 42% State avg: 1h 2m per day · National avg: 41m per day
LPN / LVN Info Licensed Practical Nurses (LPNs) or Licensed Vocational Nurses (LVNs) deliver routine hands-on care — medication administration, wound dressing, and monitoring vital signs. They work under RN supervision and make up a large share of daily bedside care. 1h 7m per day ▲ 10% State avg: 1h 1m per day · National avg: 52m per day
Nurse Aide Info Certified Nurse Aides (CNAs) provide the most direct day-to-day assistance: bathing, dressing, feeding, and mobility. Nurse aide hours are typically the largest staffing category and directly affect residents' quality of life. 2h 19m per day ▼ 6% State avg: 2h 28m per day · National avg: 2h 21m per day
Weekend Total Nursing Info Combined nursing hours (RN + LPN + Nurse Aide) per resident per day on weekends. Staffing often drops on weekends — this figure reveals whether the facility maintains adequate coverage outside of weekday hours. 3h 21m per day ▼ 17% State avg: 4h 2m per day · National avg: 3h 26m per day
Physical Therapist Info Hours per resident per day provided by licensed Physical Therapists (PTs) or PT Assistants. PT services help residents recover mobility after injury or illness and are especially important for post-acute (short-stay) rehabilitation. 6m per day ▼ 33% State avg: 9m per day · National avg: 4m per day
Weekend RN Info Registered nurse hours specifically on weekends. Facilities sometimes reduce RN presence on Saturdays and Sundays — a low weekend RN figure compared to weekday hours can indicate reduced clinical oversight when most administrative staff are absent. 24m per day ▼ 44% State avg: 43m per day · National avg: 29m per day

Capacity and availability

This home usually has availability

Lower occupancy than the Delaware average: 80.7%
Occupancy rate
20.1% Rank #44 / 44Occupancy rate — State benchmarkedThis home is ranked 44th out of 44 homes in Delaware for occupancy rate. Shows this facility's occupancy rate versus the Delaware average, with its Statewide rank out of 44. Higher occupancy signals strong local demand and financial stability.Click the rank badge to see the full State ranking.Click here to see the full State ranking.
Avg. Length of Stay
163 days
Years in operation
41 years in operation
A longer operating history, which may indicate experience navigating regulations and delivering ongoing care.
Walk Score
Walk Score: 0 / 100 Rank #106 / 111Walk Score — State benchmarkedThis home is ranked 106th out of 111 homes in Delaware for walk score. Shows how walkable this facility's neighborhood is compared to the average Walk Score across Delaware SNFs. Higher scores benefit residents, families, and staff.Click the rank badge to see the full State ranking.Click here to see the full State ranking.
Car-dependent. Most errands require a car, with limited nearby walkable options.
BBB Rating
BBB Rating: A+ (Not Accredited)
An independent rating from the Better Business Bureau based on factors such as complaint history, transparency, and business practices.
How BBB ratings work

About this community

Staffing

Key information about the people who lead and staff this community.

Leadership

ContactMs. Carole Daniel, General Mgr

Contact Harrison House of Georgetown

Inspection History

In Delaware, the Department of Health and Social Services, Division of Health Care Quality is responsible for the oversight, unannounced inspection, and licensing of all long-term care settings.

Since 2023 · 3 years of data 90 deficiencies

Inspection Scorecard Info This scorecard compares key inspection, citation, and complaint metrics at this facility against the Delaware state average. Metrics rated ≥15% worse than average are highlighted in red; those ≥15% better are highlighted in green.

Since 2023 vs. Delaware state average
Overall vs. DE average 2 Worse Metrics worse than Delaware average:
• Total deficiencies (41% above)
• Deficiencies per year (41% above)
0 Better No metrics in this bucket.
Latest Inspection October 22, 2025 Annual Inspection

Deficiencies Info Deficiencies are formal regulatory issues recorded during state inspections.

This FacilityDE Averagevs. DE Avg
Total deficiencies Info Formal regulatory issues recorded by inspectors across all inspection types. 9064 This facility has 41% more total deficiencies than a typical Delaware nursing home (90 vs. DE avg 64).↑ 41% worse
Deficiencies per year Info Average deficiencies per year since 2023. 3021.3 This facility has 41% more deficiencies per year than a typical Delaware nursing home (30 vs. DE avg 21.3).↑ 41% worse

Inspection Reports Summary Info An editor-reviewed summary of the themes and findings across this facility's recent inspection reports.

  • October 22, 2025 annual inspection found two deficiencies causing actual harm, including failure to provide pressure ulcer care and adequate hydration leading to hospitalization.
  • July 31, 2025 routine inspection cited seven deficiencies including immediate jeopardy medication errors, infection control lapses, incomplete care plans, and unsafe kitchen sanitation.
  • June 6, 2023 complaint investigation substantiated failures in resident dignity, abuse reporting, transfer notifications, and consistent application of prescribed treatments.

Health Inspection History

Inspections since 2023
Total health inspections 4

Delaware average 4.4


Last Health inspection on Oct 2025

Total health citations
39 Rank #20 / 39Health citations — State benchmarkedThis home is ranked 20th out of 39 homes in Delaware for health citations. Shows this facility's total health deficiency citations benchmarked to the Delaware State average, with a ranking across all 39 DE SNFs. Lower citation counts earn a better rank.Click the rank badge to see the full State ranking.Click here to see the full State ranking.

Delaware average 38.9

Citations per inspection
9.75 Rank #23 / 39Citations per inspection — State benchmarkedThis home is ranked 23rd out of 39 homes in Delaware for citations per inspection. Shows average deficiency citations per CMS inspection for this facility versus the Delaware mean across 39 SNFs with citation data. Lower is better.Click the rank badge to see the full State ranking.Click here to see the full State ranking.

Delaware average 8.72


Health citations are formal notices following inspections when they fail to comply with safety and care standards.

26 of 39 citations resulted from standard inspections; 7 of 39 resulted from complaint investigations; and 6 of 39 came from combined inspections (standard and complaint).

Breakdown of citation severity (last 3 years)
Critical health citations
2
122% worse than Delaware average

Delaware average: 0.9


Serious health citations
2
67% worse than Delaware average

Delaware average: 1.2

2 critical citations Delaware average: 0.9

2 serious citations Delaware average: 1.2

35 moderate citations Delaware average: 35.7

0 minor citations Delaware average: 1
Citations history (last 3 years)
Quality of Care serious citation Oct 22, 2025
Corrected

Quality of Care serious citation Oct 22, 2025
Corrected

Environmental moderate citation Jul 31, 2025
Corrected

Infection Control moderate citation Jul 31, 2025
Corrected

Staffing Data

Reporting period: October 1 – December 31, 2025 (Q4 2025). Source: CMS Payroll-Based Journal report.

Total staff 243
Employees 158
Contractors 85
Staff to resident ratio 2.21 : 1
36% more staff per resident than Delaware average
Delaware average ratio: 1.63 : 1 Delaware average ratio: 1.63 : 1See full Delaware ranking
Avg staff/day 69
Average shift 7.6 hours
0% compared with Delaware average
Delaware average: 7.6 hours Delaware average shift: 7.6 hoursSee full Delaware ranking
Total staff hours (quarter) 48,209

Nursing staff breakdown

Q4 2025 · Oct 1 – Dec 31 More info This data comes from the CMS Payroll-Based Journal report covering October 1 – December 31, 2025.
Registered Nurse

Manages medical care and health needs.

RN Staff Info 31 total: 8 full-time employees and 23 contractors. 31
Average shift length Info Average shift length. Calculated as total hours divided by days worked and average staff per day. 7.7 hours
Licensed Practical Nurse

Assists with medical care and medications.

LPN Staff Info 71 total: 27 full-time employees and 44 contractors. 71
Average shift length Info Average shift length. Calculated as total hours divided by days worked and average staff per day. 8.7 hours
Certified Nursing Assistant

Helps with daily care and mobility.

CNA Staff Info 100 total: 82 full-time employees and 18 contractors. 100
Average shift length Info Average shift length. Calculated as total hours divided by days worked and average staff per day. 7.4 hours

Contractor staffing

Q4 2025 · Oct 1 – Dec 31 More info This data comes from the CMS Payroll-Based Journal report covering October 1 – December 31, 2025.

Total hours from contractors

9.5%

4,594 contractor hours this quarter

Licensed Practical Nurse: 44 Registered Nurse: 23 Certified Nursing Assistant: 18

Staff by category

Q4 2025 · Oct 1 – Dec 31 More info This data comes from the CMS Payroll-Based Journal report covering October 1 – December 31, 2025.
Certified Nursing Assistant821810023,63392100%7.4
Licensed Practical Nurse27447110,14692100%8.7
Registered Nurse823312,84192100%7.7
Clinical Nurse Specialist6062,07292100%7.2
RN Director of Nursing4042,0457480%9
Other Dietary Services Staff5051,93892100%6.6
Respiratory Therapy Technician7071,2407582%6.9
Dental Services Staff2029886470%7.8
Respiratory Therapist4049408896%5.9
Administrator1015126470%8
Dietitian1014886166%8
Physical Therapy Assistant2023726672%4.7
Qualified Activities Professional1013724650%8.1
Qualified Social Worker3032823740%7.1
Therapeutic Recreation Specialist4042053235%5.9
Nurse Practitioner1011361718%8
100 Certified Nursing Assistant
% of Days 100%
71 Licensed Practical Nurse
% of Days 100%
31 Registered Nurse
% of Days 100%
6 Clinical Nurse Specialist
% of Days 100%
4 RN Director of Nursing
% of Days 80%
5 Other Dietary Services Staff
% of Days 100%
7 Respiratory Therapy Technician
% of Days 82%
2 Dental Services Staff
% of Days 70%
4 Respiratory Therapist
% of Days 96%
1 Administrator
% of Days 70%
1 Dietitian
% of Days 66%
2 Physical Therapy Assistant
% of Days 72%
1 Qualified Activities Professional
% of Days 50%
3 Qualified Social Worker
% of Days 40%
4 Therapeutic Recreation Specialist
% of Days 35%
1 Nurse Practitioner
% of Days 18%

Penalties and fines

Includes penalties issued in 2024

Federal penalties imposed by CMS for regulatory violations, including civil money penalties (fines) and denials of payment for new Medicare/Medicaid admissions.

Source: CMS Penalties Database (Data as of Jan 2026)

Total fines amount $63K Rank #31 / 39Federal fines — State benchmarkedThis home is ranked 31st out of 39 homes in Delaware for federal fines. Shows this facility's cumulative CMS federal fine dollars versus the Delaware average among facilities with fines, and where it ranks among 39 skilled nursing facilities in the pool. Lower total dollars mean a better rank.Click the rank badge to see the full State ranking.Click here to see the full State ranking.
36% lower than Delaware average

Delaware average: $98K

Number of fines 1
46% fewer fines than Delaware average

Delaware average: 1.9

Payment Denials Info Serious action where Medicare and/or Medicaid temporarily stops payments for new residents until issues are fixed. 0
100% fewer payment denials than Delaware average

Delaware average: 0.2

Fines amount comparison
This facility $63K
Delaware average $98K
Penalty History

Penalties are imposed by CMS for violations of federal nursing home regulations.

1 penalty in the past 3 years

Aug 9, 2024 · $63K

Civil Money Penalty Info Fines imposed for noncompliance, which can be assessed per day or per instance of violation. Aug 9, 2024
$63K

Last updated: Jan 2026

Quality of care over time

These measures show how residents usually do over time at this home, based on health outcomes and preventive care.

High-risk clinical events score Info A composite score based on pressure ulcers, falls with injury, weight loss, walking ability decline, and activities of daily living decline. 11.0
15% worse than Delaware average

Delaware average: 9.6

Functional decline score Info A composite score based on activities of daily living decline, walking ability decline, and incontinence. 20.3
7% worse than Delaware average

Delaware average: 19.0

Long-stay resident measures
Below average Delaware avg: 3.8 Info CMS star rating based on long-stay quality measure performance. 5 stars = significantly above average, 1 star = significantly below average.
Need for Help with Daily Activities Increased Info Percent of long-stay residents whose need for help with daily activities has increased 16.6%
7% worse than Delaware average

Delaware average: 15.4%

Walking Ability Worsened Info Percent of long-stay residents whose ability to move independently worsened 19.9%
In line with Delaware average

Delaware average: 19.8%

Low Risk Residents with Bowel/Bladder Incontinence Info Percent of low risk long-stay residents who lose control of their bowels or bladder 24.3%
10% worse than Delaware average

Delaware average: 22.1%

Falls with Major Injury Info Percent of long-stay residents experiencing one or more falls with major injury 7.2%
144% worse than Delaware average

Delaware average: 3.0%

High Risk Residents with Pressure Ulcers Info Percent of long-stay high risk residents with pressure ulcers 3.7%
17% better than Delaware average

Delaware average: 4.4%

Urinary Tract Infection Info Percent of long-stay residents with a urinary tract infection 3.0%
39% worse than Delaware average

Delaware average: 2.1%

Lost Too Much Weight Info Percent of long-stay residents who lose too much weight 7.6%
32% worse than Delaware average

Delaware average: 5.8%

Depressive Symptoms Info Percent of long-stay residents who have depressive symptoms 0.9%
84% better than Delaware average

Delaware average: 6.0%

Antipsychotic Use Info Percent of long-stay residents who received an antipsychotic medication 14.8%
35% worse than Delaware average

Delaware average: 11.0%

Pneumococcal Vaccine Info Percent of long-stay residents assessed and appropriately given the pneumococcal vaccine 92.3%
In line with Delaware average

Delaware average: 95.3%

Influenza Vaccine Info Percent of long-stay residents assessed and appropriately given the seasonal influenza vaccine 95.2%
In line with Delaware average

Delaware average: 97.4%

Hospitalizations per 1,000 days Info Number of hospitalizations per 1,000 long-stay resident days. 1.73
5% better than Delaware average

Delaware average: 1.83

ED visits per 1,000 days Info Number of outpatient emergency department visits per 1,000 long-stay resident days. 1.46
7% worse than Delaware average

Delaware average: 1.37

Short-stay resident measures
Below average Delaware avg: 3.4 Info CMS star rating based on short-stay quality measure performance. 5 stars = much above average, 1 star = much below average.
Pneumococcal Vaccine Info Percent of short-stay residents assessed and appropriately given the pneumococcal vaccine 80.5%
In line with Delaware average

Delaware average: 82.1%

Antipsychotic medication increase Info Percent of short-stay residents who newly received an antipsychotic medication 1.9%
111% worse than Delaware average

Delaware average: 0.9%

Influenza Vaccine Info Percent of short-stay residents assessed and appropriately given the seasonal influenza vaccine 74.0%
11% worse than Delaware average

Delaware average: 83.1%

Re-hospitalized after SNF stay Info Percentage of short-stay residents who were re-hospitalized after their nursing home admission. 25.9%
20% worse than Delaware average

Delaware average: 21.5%

Emergency department visits Info Percentage of short-stay residents who had an outpatient emergency department visit. 13.1%
17% worse than Delaware average

Delaware average: 11.2%

Falls with major injury Info Percentage of SNF residents who experience falls with major injury during their stay. 0.0%
100% better than Delaware average

Delaware average: 0.8%

Ability to care for self at discharge Info Percentage of residents at or above expected ability to care for themselves at discharge. 43.9%
18% worse than Delaware average

Delaware average: 53.7%

Successful return to home or community Info Rate of successful return to home or community from a skilled nursing facility. 54.2%
7% better than Delaware average

Delaware average: 50.6%

Breakdown by payment type

Medicare

63% of new residents, usually for short-term rehab.

Typical stay 1 months

Private pay

33% of new residents, often for short stays.

Typical stay 3 - 4 months

Medicaid

4% of new residents, often for long-term daily care.

Typical stay 8 years

Facility Characteristics

Source: CMS Long-Term Care Facility Characteristics (Data as of Jan 2026)

Total residents 110
Medicare
17
15.5% of residents
Medicaid
80
72.7% of residents
Private pay or other
13
11.8% of residents
Programs & Services
Residents Group

Residents meet regularly to discuss policies, care quality, and activities

Active Resident Council

Organized group of residents that meets regularly to discuss facility policies, quality of life, and activities.

Finances and operations

Privately-owned community
Operated by a business corporation.
Home revenue
$18.1M
Profit
$228.6K
Privately-owned community Operated by a business corporation.
Home revenue
$18.1M Rank #20 / 35Revenue — State benchmarkedThis home is ranked 20th out of 35 homes in Delaware for revenue. Shows this facility's annual revenue compared to the Delaware SNF average. Higher revenue generally means more resources for staffing and capital — read alongside Payroll %.Click the rank badge to see the full State ranking.Click here to see the full State ranking.
Profit
$228.6K
Payroll costs Info The portion of the home's budget spent on staff, including nurses, caregivers, and other employees who support care and operations. Rank #19 / 35Payroll — State benchmarkedThis home is ranked 19th out of 35 homes in Delaware for payroll. Shows total annual staff payroll benchmarked to the Delaware average. Higher payroll investment relative to peers often signals better staffing and less reliance on cheaper contract labor.Click the rank badge to see the full State ranking.Click here to see the full State ranking.
$8.5M
46.9% of revenue Rank #15 / 35Payroll % — State benchmarkedThis home is ranked 15th out of 35 homes in Delaware for payroll %. Shows payroll as a percentage of revenue versus the Delaware average. Well-run Delaware SNFs typically land around 52–60% — the top third Statewide. Below 25% may signal understaffing or heavy agency use — read with Staffing ratings.Click the rank badge to see the full State ranking.Click here to see the full State ranking.
Other operating costs Info All remaining costs needed to run the home, such as food, utilities, building maintenance, supplies and administrative expenses.
$9.4M
Total costs $17.9M

Who this home usually serves

TYPE OF STAY

Mostly short-term rehab stays

Most residents typically stay for a few weeks or months before returning home or moving on.

Places of interest near Harrison House of Georgetown

Address 6778.1 miles from city center Info Estimated distance in miles from Georgetown's city center to Harrison House of Georgetown's address, calculated via Google Maps. — 23.21 miles to nearest hospital (Aoyitakezhen Health Hospital Out-patient Department)

Calculate Travel Distance to Harrison House of Georgetown

Add your location

Address

Financial Assistance for
Nursing Home in Delaware

Harrison House of Georgetown is located in Georgetown, Delaware.
Here are the financial assistance programs available to residents in Delaware.

Get Financial aid guidance

Elderly and Disabled Waiver

Delaware Medicaid E&D Waiver

Age 65+ or disabled
General Delaware resident, Medicaid- eligible, nursing home-level care need.
Income Limits (2025) ~$2,829/month 300% FBR, individual
Asset Limits $2,000 (individual), $3,000 (couple).
DE

Small state, faster processing in some areas.

Benefits
Personal care (5-7 hours/day) Respite (240 hours/year) Adult day care (~$60/day) Home modifications

Delaware Caregiver Support Program

DE Caregiver Support (NFCSP)

Age Caregiver of someone 60+
General Delaware resident.
Income Limits No strict limit; prioritizes low-income.
Asset Limits Not applicable.
DE

Limited slots; rural focus.

Benefits
In-home respite (4-6 hours/day) Adult day care (~$60/day) Short-term facility care (up to 5 days)

Program of All-Inclusive Care for the Elderly (PACE)

Delaware Medicaid PACE

Age 55+
General Delaware resident, nursing home-level care need, safe with PACE support.
Income Limits (2025) ~$2,829/month 300% FBR
Asset Limits $2,000 (individual), $3,000 (couple).
DE

Limited to specific areas (e.g., New Castle County); few providers.

Benefits
Personal care (5-7 hours/day) Medical care Meals Transportation Therapy

Medicare Savings Program (MSP)

Delaware Medicare Savings Program

Age 65+ or disabled
General Delaware resident, enrolled in Medicare Part A/B.
Income Limits (2025) ~$2,510/month (QMB), ~$3,380/month (SLMB), ~$3,598/month (QI)—individual, adjusted annually.
Asset Limits $9,430 (individual), $14,130 (couple).
DE

Three tiers; broader limits than some states.

Benefits
Covers Medicare Part B premiums ($174.70/month) Deductibles ($240/year) Copays (~20% of services)

Compare Nursing Home around Delaware

The information below is reported by the Delaware Department of Health and Social Services, Division of Health Care Quality.

5 facilities compared · CMS & DE Dept. of Health data

Filter by care type
Foulk Living
NH

Nursing Home Licensed facility providing 24/7 skilled nursing care for residents with complex, ongoing medical needs. Staffed by RNs, LPNs, and CNAs. Inspected and star-rated annually by CMS. Accepts Medicare (short-term rehab) and Medicaid (long-term care).

AL

Assisted Living A licensed, long-term care setting for seniors or individuals with disabilities who need help with daily activities — like bathing, dressing, and medication management — but not 24-hour skilled nursing. Offers housing, meals, and around-the-clock support while aiming to maximize resident independence.

IL

Independent Living Lifestyle-focused communities for older adults offering dining, activities, and transportation with minimal personal care. Best for active, independent seniors who want community without medical support.

MC

Memory Care Secured, specialized care for people living with Alzheimer's or dementia. Staff trained in cognitive impairment, with higher staff-to-resident ratios and an environment designed to reduce confusion and wandering risk.

Wilmington
44
Facility 44
DE AVG 102
Rank #67 / 73
92.5% +15%4.66 +51%0%$19.8k199.5143-
33
Facility 33
DE AVG 40
Rank #67 / 111
Leslie Johnson$11.5M$7.2M62.9%85060
Millcroft Living
NH

Nursing Home Licensed facility providing 24/7 skilled nursing care for residents with complex, ongoing medical needs. Staffed by RNs, LPNs, and CNAs. Inspected and star-rated annually by CMS. Accepts Medicare (short-term rehab) and Medicaid (long-term care).

AL

Assisted Living A licensed, long-term care setting for seniors or individuals with disabilities who need help with daily activities — like bathing, dressing, and medication management — but not 24-hour skilled nursing. Offers housing, meals, and around-the-clock support while aiming to maximize resident independence.

IL

Independent Living Lifestyle-focused communities for older adults offering dining, activities, and transportation with minimal personal care. Best for active, independent seniors who want community without medical support.

Newark (Possum Park Road)
28
Facility 28
DE AVG 102
Rank #71 / 73
72.1% -11%5.10 -19%+9%$16.4k396.5288-
35
Facility 35
DE AVG 40
Rank #62 / 111
Kristopher Brown$17.5M$11.4M65.5%85021
Complete Care at Silver Lake
NH

Nursing Home Licensed facility providing 24/7 skilled nursing care for residents with complex, ongoing medical needs. Staffed by RNs, LPNs, and CNAs. Inspected and star-rated annually by CMS. Accepts Medicare (short-term rehab) and Medicaid (long-term care).

AL

Assisted Living A licensed, long-term care setting for seniors or individuals with disabilities who need help with daily activities — like bathing, dressing, and medication management — but not 24-hour skilled nursing. Offers housing, meals, and around-the-clock support while aiming to maximize resident independence.

MC

Memory Care Secured, specialized care for people living with Alzheimer's or dementia. Staff trained in cognitive impairment, with higher staff-to-resident ratios and an environment designed to reduce confusion and wandering risk.

Dover
120
Facility 120
DE AVG 102
Rank #25 / 73
96.7% +20%4.26 +3%-9%$57.3k3010.02114-
7
Facility 7
DE AVG 40
Rank #98 / 111
-$17.8M$8.2M45.8%85027
Harrison House of Georgetown
NH

Nursing Home Licensed facility providing 24/7 skilled nursing care for residents with complex, ongoing medical needs. Staffed by RNs, LPNs, and CNAs. Inspected and star-rated annually by CMS. Accepts Medicare (short-term rehab) and Medicaid (long-term care).

AL

Assisted Living A licensed, long-term care setting for seniors or individuals with disabilities who need help with daily activities — like bathing, dressing, and medication management — but not 24-hour skilled nursing. Offers housing, meals, and around-the-clock support while aiming to maximize resident independence.

Georgetown (West North Street)
139
Facility 139
DE AVG 102
Rank #13 / 73
20.1% -75%4.13 +2%-11%$106.4k399.8428A+
0
Facility 0
DE AVG 40
Rank #106 / 111
Chase Carlin Harrison Trust$18.1M$8.5M46.9%85029
Kutz Senior Living Campus
NH

Nursing Home Licensed facility providing 24/7 skilled nursing care for residents with complex, ongoing medical needs. Staffed by RNs, LPNs, and CNAs. Inspected and star-rated annually by CMS. Accepts Medicare (short-term rehab) and Medicaid (long-term care).

AL

Assisted Living A licensed, long-term care setting for seniors or individuals with disabilities who need help with daily activities — like bathing, dressing, and medication management — but not 24-hour skilled nursing. Offers housing, meals, and around-the-clock support while aiming to maximize resident independence.

MC

Memory Care Secured, specialized care for people living with Alzheimer's or dementia. Staff trained in cognitive impairment, with higher staff-to-resident ratios and an environment designed to reduce confusion and wandering risk.

Wilmington
90
Facility 90
DE AVG 102
Rank #45 / 73
87.8% +9%5.21 -83%+12%$168.0k5914.8479-
41
Facility 41
DE AVG 40
Rank #52 / 111
David Bacher$16.5M$8.6M52.1%85043

Frequently Asked Questions about Harrison House of Georgetown

What neighborhood is Harrison House of Georgetown in?

Harrison House of Georgetown is in the West North Street neighborhood of Georgetown.

Are there photos of Harrison House of Georgetown?

Yes — there are 3 photos of Harrison House of Georgetown in the photo gallery on this page.

What is the phone number of Harrison House of Georgetown?

(302) 856-4574 will put you in contact with the team at Harrison House of Georgetown.

Is Harrison House of Georgetown Medicare or Medicaid certified?

Yes — Harrison House of Georgetown is a CMS-certified provider of Medicare and Medicaid.

Guides for Better Senior Living

Care Cost Calculator: See Prices in Your Area

Nursing Home Data Explorer

Don’t Wait Too Long: 7 Red Flag Signs Your Parent Needs Assisted Living Now

The True Cost of Assisted Living in 2025 – And How Families Are Paying For It

Understanding Senior Living Costs: Pricing Models, Discounts & Financial Assistance

Explore Open Rooms
1 Contact details
2 What type of senior care service are you looking for?
3 What budget do you have in mind for senior care?
4 How soon do you need to find care?
5 Additional details

Thank you for your interest!

Our team will be in touch shortly to help with next steps.