Harvard Gardens Rehabilitation and Care Center

Nursing Home · Cleveland, OH
CMS overall rating Info The Overall CMS Rating is scored from 1 to 5 stars and combines results from health inspections, staffing levels, and quality measures. Health inspections carry the most weight. Staffing and quality scores can increase or decrease the final rating based on performance compared to state and national standards.
Harvard Gardens Rehabilitation and Care Center

Nursing Home in Cleveland

CMS overall rating Info The Overall CMS Rating is scored from 1 to 5 stars and combines results from health inspections, staffing levels, and quality measures. Health inspections carry the most weight. Staffing and quality scores can increase or decrease the final rating based on performance compared to state and national standards.
Calculator: See prices in your area
Harvard Gardens Rehabilitation and Care Center accepts Medicare, Medicaid, and private pay.

Overview of Harvard Gardens Rehabilitation and Care Center

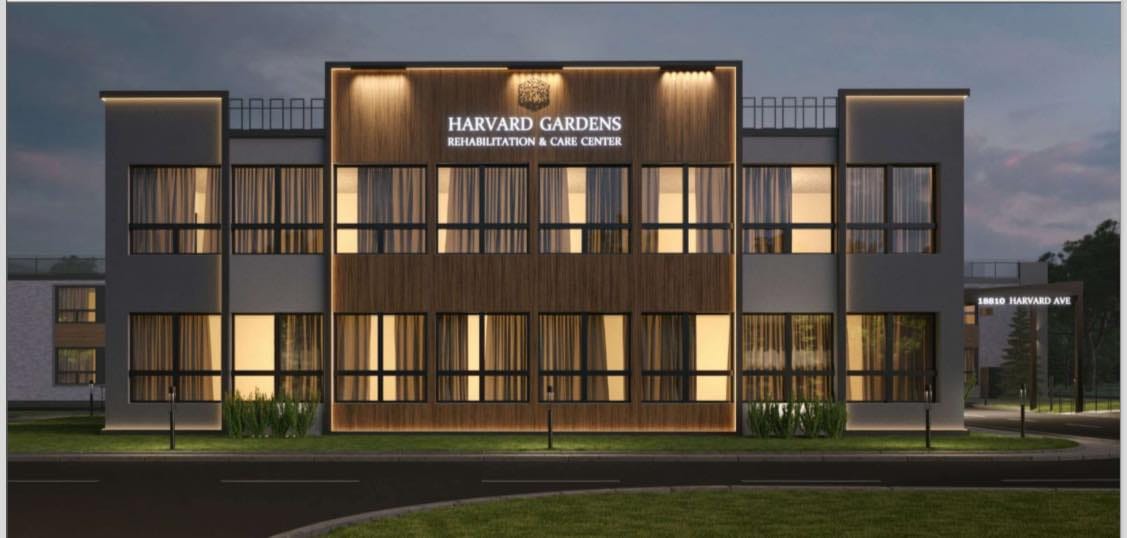
Experience a five-star recovery journey with Harvard Gardens Rehabilitation and Care Center, a renowned senior care provider in Cleveland, OH, offering comprehensive rehabilitation and skilled nursing services. Residents undergo standardized assessments and then are provided with personalized treatment plans overseen by a warm and dedicated team of care professionals. The community offers an array of specialized services, such as respiratory therapy, bedside rehab, orthopedic rehabilitation, and more to ensure residents have access to any services they may need to recover fully.

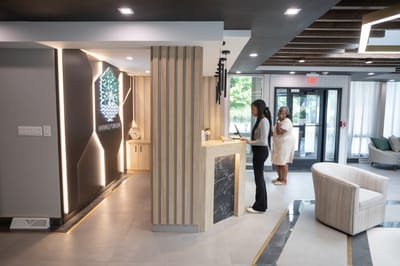
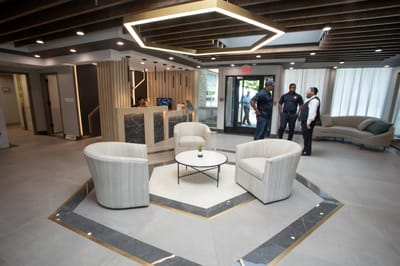
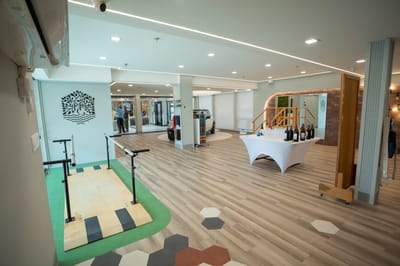
An array of on-site therapies and services, such as speech therapy, occupational therapy, physical therapy, and audiology services are also offered to ensure residents recover more fully and faster. Top-notch amenities are also provided to make residents’ stay as comfortable as possible, such as a restaurant-style dining area, concierge services, a fully-equipped gym, and beautifully landscaped grounds for a relaxing time outdoors.

Quality ratings

Measured by Centers for Medicare & Medicaid Services (CMS)

Overall rating Info The Overall CMS Rating combines results from health inspections, staffing levels and quality measures. Health inspections carry the most weight. Staffing and quality scores can increase or decrease the final rating based on performance compared to state and national standards.
▼ 68.6% Below OH avg.
Health Inspection Info Based on the results of the facility's three most recent standard inspections and any complaint investigations. CMS reviews the number, scope, and severity of deficiencies, with more recent findings weighted more heavily.
▼ 64.3% Below OH avg.
Staffing Info Measures average nursing staff hours per resident per day, including Registered Nurses (RNs) and total nursing staff. Ratings are adjusted based on the level of care residents require and are compared to state and national benchmarks.
▼ 59.1% Below OH avg.
Quality Measures Info Based on clinical and physical health indicators reported to CMS, such as hospital readmissions, falls, pressure ulcers, and improvements in mobility. These measures reflect how well residents' health needs are being managed.
▼ 8.2% Below OH avg.

Staffing hours breakdown

Info Daily nursing hours per resident by staff type, reported to CMS. Higher is generally better — compare this facility to state and national averages to see where staffing stands.

Hours per resident per day — compared to Ohio state averages

Total nursing care / resident Info This home is ranked 51st out of 165 homes in Ohio.

Total adjusted nursing hours per resident per day, combining RN, LPN, and aide time. CMS adjusts this for case-mix so facilities can be fairly compared.
3h 46m per day
Rank #51 / 165Nurse hours — state benchmarkedThis home is ranked 51st out of 165 homes in Ohio.Shows adjusted nurse hours per resident per day benchmarked to the Ohio average, with a ranking across 165 Ohio SNFs. More hours mean more direct care. The national average is about 3.5 hrs; below 3.0 is a red flag.
This facility Ohio avg (3h 32m per day)
vs Ohio avg
+6%

4 of 5 metrics below state avg

Staff type Hours / day vs state avg
Registered Nurse (RN) Info RNs hold the highest nursing license and can assess residents, interpret test results, and direct care plans. More RN hours per day often signals stronger clinical oversight and faster response to health changes. 15m per day ▼ 61% State avg: 38m per day · National avg: 41m per day
LPN / LVN Info Licensed Practical Nurses (LPNs) or Licensed Vocational Nurses (LVNs) deliver routine hands-on care — medication administration, wound dressing, and monitoring vital signs. They work under RN supervision and make up a large share of daily bedside care. 59m per day ■ Avg State avg: 58m per day · National avg: 52m per day
Nurse Aide Info Certified Nurse Aides (CNAs) provide the most direct day-to-day assistance: bathing, dressing, feeding, and mobility. Nurse aide hours are typically the largest staffing category and directly affect residents' quality of life. 1h 50m per day ▼ 14% State avg: 2h 8m per day · National avg: 2h 21m per day
Total Nursing (Weekend) Info Combined nursing hours (RN + LPN + Nurse Aide) per resident per day on weekends. Staffing often drops on weekends — this figure reveals whether the facility maintains adequate coverage outside of weekday hours. 2h 54m per day ▼ 12% State avg: 3h 17m per day · National avg: 3h 26m per day
RN (Weekend) Info Registered nurse hours specifically on weekends. Facilities sometimes reduce RN presence on Saturdays and Sundays — a low weekend RN figure compared to weekday hours can indicate reduced clinical oversight when most administrative staff are absent. 9m per day ▼ 64% State avg: 25m per day · National avg: 29m per day

Capacity and availability

This home usually has availability

Occupancy lower than 85% suggests more openings may be available.

Lower occupancy than the Ohio average: 78.7%
Occupancy rate 62.8% Rank #140 / 166Occupancy rate — state benchmarkedThis home is ranked 140th out of 166 homes in Ohio.Shows this facility's occupancy rate versus the Ohio average, with its statewide rank out of 166. Higher occupancy signals strong local demand and financial stability.
Avg. Length of Stay 174 days
Occupancy rate
62.8% Rank #140 / 166Occupancy rate — state benchmarkedThis home is ranked 140th out of 166 homes in Ohio.Shows this facility's occupancy rate versus the Ohio average, with its statewide rank out of 166. Higher occupancy signals strong local demand and financial stability.
Avg. Length of Stay
174 days

Who this home usually serves

TYPE OF STAY

Mostly long-term care residents

Most residents stay for extended periods and receive ongoing daily care.

Breakdown by payment type

Medicare

15% of new residents, usually for short-term rehab.

Typical stay 1 - 2 months

Private pay

13% of new residents, often for short stays.

Typical stay 2 years

Medicaid

72% of new residents, often for long-term daily care.

Typical stay 3 - 4 months

Finances and operations

Privately-owned community
Operated by a partnership between two or more business owners.
Home revenue
$10.4M
Operating loss
-$294.8K
Privately-owned community Operated by a partnership between two or more business owners.
Home revenue
$10.4M Rank #90 / 165Revenue — state benchmarkedThis home is ranked 90th out of 165 homes in Ohio.Shows this facility's annual revenue compared to the Ohio SNF average. Higher revenue generally means more resources for staffing and capital — read alongside Payroll %.
Operating loss
-$294.8K
Payroll costs Info The portion of the home's budget spent on staff, including nurses, caregivers, and other employees who support care and operations. Rank #66 / 165Payroll — state benchmarkedThis home is ranked 66th out of 165 homes in Ohio.Shows total annual staff payroll benchmarked to the Ohio average. Higher payroll investment relative to peers often signals better staffing and less reliance on cheaper contract labor.
$5.4M
51.6% of revenue Rank #42 / 165Payroll % — state benchmarkedThis home is ranked 42nd out of 165 homes in Ohio.Shows payroll as a percentage of revenue versus the Ohio average. Well-run SNFs often land around 55–65%. Below 25% may signal understaffing or heavy agency use — read with Staffing ratings.
Other operating costs Info All remaining costs needed to run the home, such as food, utilities, building maintenance, supplies and administrative expenses.
$5.3M
Total costs $10.7M
Walk Score
Walk Score: 34 / 100 Rank #67 / 115Walk Score — state benchmarkedThis home is ranked 67th out of 115 homes in Ohio.Shows how walkable this facility's neighborhood is compared to the average Walk Score across Ohio SNFs. Higher scores benefit residents, families, and staff.
Somewhat walkable. A few nearby services may be reachable on foot, but most trips require transportation.

About this community

Therapy & Rehabilitation

2 services
Rehabilitation Services
Short-Term Rehab

Staffing & Medical

1 service
24-Hour Staffing

Additional Services

1 service
Long-Term Support

What does this home offer?

Building type icon
Building type icon

Building Type: Two-story

Fitness and recreation icon

Fitness and Recreation

Types of Care at Harvard Gardens Rehabilitation and Care Center

Nursing Home

Contact Harvard Gardens Rehabilitation and Care Center

Health Inspection History

Inspections
Total health inspections 10

Ohio average 6.7


Last Health inspection on Apr 2025

Total health citations
58 Rank #151 / 166Health citations — state benchmarkedThis home is ranked 151st out of 166 homes in Ohio.Shows this facility's total health deficiency citations benchmarked to the Ohio state average, with a ranking across all 166 OH SNFs. Lower citation counts earn a better rank.

Ohio average 30.9

Citations per inspection
5.8 Rank #141 / 166Citations per inspection — state benchmarkedThis home is ranked 141st out of 166 homes in Ohio.Shows average deficiency citations per CMS inspection for this facility versus the Ohio mean across 166 SNFs with citation data. Lower is better.

Ohio average 4.59


Health citations are formal notices following inspections when they fail to comply with safety and care standards.

27 of 58 citations resulted from standard inspections; 21 of 58 resulted from complaint investigations; and 10 of 58 came from combined inspections (standard and complaint).

Breakdown of citation severity (last 4 years)
Critical Health citations More info
1
233% worse than Ohio average

Ohio average: 0.3


Serious Health citations More info 2
122% worse than Ohio average

Ohio average: 0.9

1 critical citation More info Ohio average: 0.3

2 serious citations More info Ohio average: 0.9

54 moderate citations More info Ohio average: 29

1 minor citation More info Ohio average: 0.7
Citations history (last 4 years)
Abuse/Neglect moderate citation Info Issues related to protecting resident's from harm, including abuse, neglect, or mistreatment. Apr 10, 2025
Corrected

Abuse/Neglect moderate citation Info Issues related to protecting resident's from harm, including abuse, neglect, or mistreatment. Apr 10, 2025
Corrected

Abuse/Neglect moderate citation Info Issues related to protecting resident's from harm, including abuse, neglect, or mistreatment. Apr 10, 2025
Corrected

Abuse/Neglect moderate citation Info Issues related to protecting resident's from harm, including abuse, neglect, or mistreatment. Apr 10, 2025
Corrected

Financial Assistance for
Nursing Home in Ohio

Harvard Gardens Rehabilitation and Care Center is located in Cleveland, Ohio.
Here are the financial assistance programs available to residents in Ohio.

Get Financial aid guidance

PASSPORT Waiver

Ohio Medicaid PASSPORT

Age 60+
General Ohio resident, Medicaid-eligible, nursing home-level care need.
Income Limits (2025) ~$2,829/month 300% FBR, individual
Asset Limits $2,000 (individual), $3,000 (couple).
OH

Administered through regional agencies; waitlists possible.

Benefits
Personal care (5-7 hours/day) Respite (240 hours/year) Adult day care ($65/day) Home modifications ($1,500 avg.)

Ohio Home Care Program (non-Medicaid)

OH HCP

Age 60+
General Ohio resident, at risk of decline.
Income Limits ~$2,000/month individual, varies
Asset Limits $5,000 individual
OH

Limited funding; regional variation.

Benefits
In-home care (3-5 hours/week) Respite (up to 10 days/year) Transportation (~5 trips/month)

Assisted Living Waiver (ALW)

Ohio Assisted Living Waiver

Age 21+ (65+ prioritized)
General OH resident, Medicaid-eligible, NFLOC.
Income Limits (2025) ~$2,829/month (individual); QIT required.
Asset Limits $2,000 (individual), $3,000 (couple).
OH

Covers ~300 facilities; room/board not included (separate cost).

Benefits
Personal care Meals Medication management Transportation (~$3,000-$4,000/month value)

Program of All-Inclusive Care for the Elderly (PACE)

Ohio PACE (e.g., McGregor PACE)

Age 55+
General OH resident (specific counties), NFLOC, safe with PACE support.
Income Limits (2025) ~$2,829/month (Medicaid-eligible); private pay option available.
Asset Limits $2,000 (individual), $3,000 (couple) for Medicaid enrollees.
OH

Available in 9 counties (e.g., Cuyahoga, Franklin); expanding via Healthy Aging Grants.

Benefits
Personal care (5-7 hours/day) Medical care Meals Transportation Respite Therapies

Medicare Savings Program (MSP)

Ohio Medicare Savings Program

Age 65+ or disabled
General OH resident, Medicare Part A/B.
Income Limits (2025) ~$2,510/month (QMB), ~$3,380/month (SLMB), ~$3,598/month (QI)—individual.
Asset Limits $9,430 (individual), $14,130 (couple).
OH

Three tiers; includes Extra Help for Part D; no waitlist.

Benefits
Covers Part B premiums ($174.70/month) Deductibles ($240/year) Copays (~20%)

Home Energy Assistance Program (HEAP)

Ohio HEAP

Age 60+ prioritized
General OH resident, low-income household.
Income Limits (2025) ~$3,970/month individual, 185% FPL
Asset Limits Not assessed; income-focused.
OH

Covers gas, electric, oil; emergency aid via Winter/Summer Crisis Programs.

Benefits
Heating/cooling aid ($300-$1,000/season) Emergency aid ($500 max)

Family Caregiver Support Program (FCSP)

Ohio Family Caregiver Support Program

Age
General Caregivers of 60+ needing care or 55+ caregivers of others; OH resident; functional needs (2+ ADLs).
Income Limits (2025) Prioritizes ~$24,980/year (individual); no strict cap.
Asset Limits Not assessed; need-based.
OH

12 AAAs; rural/low-income priority; volunteer respite option.

Benefits
Respite (4-6 hours/week or 5 days/year) Adult day care ($60/day) Training Supplies (~$500/year)

Senior Community Service Employment Program (SCSEP)

Ohio SCSEP

Age 55+
General unemployed, low-income, OH resident.
Income Limits (2025) ~$1,983/month 125% FPL
Asset Limits Not specified; income-focused.
OH

Priority for veterans, rural residents; AARP partnership.

Benefits
Paid training (~20 hours/week at ~$7.25/hour) Job placement

VA Aid and Attendance (A&A) and Housebound Benefits

Ohio VA Aid and Attendance/Housebound

Age 65+ or disabled veteran/spouse
General OH resident, wartime service, need for ADL help (A&A) or homebound.
Income Limits (2025) Net income < ~$1,984/month (veteran with dependent, A&A); pension offsets income.
Asset Limits ~$155,356 net worth limit
OH

High veteran demand; supports care in multiple settings.

Benefits
Cash (~$1,433-$2,642/month veteran, ~$951-$1,318 spouse) for care costs (e.g., in-home, assisted living)

Homestead Exemption

Ohio Homestead Exemption

Age 65+ (or disabled)
General OH resident, homeowner, low-income.
Income Limits (2025) ~$38,500/year individual, adjusted annually
Asset Limits Not assessed; home ownership required.
OH

Reduces taxable value by $25,000; applies to primary residence.

Benefits
Tax reduction (~$400-$800/year avg., varies by county)

Save the Dream Ohio (Homeowner Assistance Fund)

Ohio Save the Dream

Age 60+ prioritized
General OH resident, homeowner, hardship post-Jan 21, 2020.
Income Limits (2025) ~$147,600/year family of 4, 150% AMI; varies by county
Asset Limits Not assessed; hardship-focused.
OH

Covers delinquent mortgages, utilities, taxes; max $25,000 mortgage aid.

Benefits
Mortgage aid ($25,000 max) Utility/property tax aid ($5,000 avg.)

Places of interest near Harvard Gardens Rehabilitation and Care Center

Address 9.8 miles from city center Info Estimated distance in miles from Cleveland's city center to Harvard Gardens Rehabilitation and Care Center's address, calculated via Google Maps. — 0.5 miles to nearest hospital (Cleveland Clinic - South Pointe Hospital)

Calculate Travel Distance to Harvard Gardens Rehabilitation and Care Center

Add your location

Address

Staffing Data (Q2 2025)

This data corresponds to Q2 2025 and is based on CMS Payroll-Based Journal.

Total staff 91
Employees 91
Contractors 0
Staff to resident ratio 0.90:1
58% worse than Ohio average

Ohio average ratio: 2.14:1

Avg staff/day 31
Average shift 9.9 hours
22% better than Ohio average

Ohio average: 8.1 hours

Total staff hours (quarter) 28,059
Nursing staff breakdown
Registered Nurse

Manages medical care and health needs.

Total count 6
Average shift length Info Average shift length. Calculated as total hours divided by days worked and average staff per day. 9.1 hours

No contractors work on this role.

Licensed Practical Nurse

Assists with medical care and medications.

Total count 26
Average shift length Info Average shift length. Calculated as total hours divided by days worked and average staff per day. 10.6 hours

No contractors work on this role.

Certified Nursing Assistant

Helps with daily care and mobility.

Total count 54
Average shift length Info Average shift length. Calculated as total hours divided by days worked and average staff per day. 9.8 hours

No contractors work on this role.

Contractor staffing

Total hours from contractors

0%

0 contractor hours this quarter

No contractor roles were reported this quarter.

Staff by category
Certified Nursing Assistant 54 0 54 17,462 91 100% 9.8
Licensed Practical Nurse 26 0 26 7,368 91 100% 10.6
Registered Nurse 6 0 6 1,245 81 89% 9.1
RN Director of Nursing 2 0 2 522 64 70% 7.7
Administrator 1 0 1 504 63 69% 8
Nurse Practitioner 1 0 1 504 64 70% 7.9
Clinical Nurse Specialist 1 0 1 454 61 67% 7.4
54 Certified Nursing Assistant
% of Days 100%
26 Licensed Practical Nurse
% of Days 100%
6 Registered Nurse
% of Days 89%
2 RN Director of Nursing
% of Days 70%
1 Administrator
% of Days 69%
1 Nurse Practitioner
% of Days 70%
1 Clinical Nurse Specialist
% of Days 67%

Facility Characteristics

Source: CMS Long-Term Care Facility Characteristics (Data as of Jan 2026)

Total residents 101
Medicare
4
4% of residents
Medicaid
94
93.1% of residents
Private pay or other
3
3% of residents
Programs & Services
Residents Group

Residents meet regularly to discuss policies, care quality, and activities

Active Resident Council

Organized group of residents that meets regularly to discuss facility policies, quality of life, and activities.

Quality of care over time

These measures show how residents usually do over time at this home, based on health outcomes and preventive care.

High-risk clinical events score Info A composite score based on pressure ulcers, falls with injury, weight loss, walking ability decline, and activities of daily living decline. 5.6
In line with Ohio average

Ohio average: 5.8

Functional decline score Info A composite score based on activities of daily living decline, walking ability decline, and incontinence. 11.6
9% better than Ohio average

Ohio average: 12.7

Long-stay resident measures
Significantly above average Ohio avg: 4.7 Info CMS star rating based on long-stay quality measure performance. 5 stars = significantly above average, 1 star = significantly below average.
Need for Help with Daily Activities Increased Info Percent of long-stay residents whose need for help with daily activities has increased 6.5%
In line with Ohio average

Ohio average: 6.8%

Walking Ability Worsened Info Percent of long-stay residents whose ability to move independently worsened 10.0%
12% worse than Ohio average

Ohio average: 8.9%

Low Risk Residents with Bowel/Bladder Incontinence Info Percent of low risk long-stay residents who lose control of their bowels or bladder 18.2%
17% better than Ohio average

Ohio average: 22.0%

Falls with Major Injury Info Percent of long-stay residents experiencing one or more falls with major injury 2.3%
32% better than Ohio average

Ohio average: 3.4%

High Risk Residents with Pressure Ulcers Info Percent of long-stay high risk residents with pressure ulcers 3.2%
17% better than Ohio average

Ohio average: 3.9%

Urinary Tract Infection Info Percent of long-stay residents with a urinary tract infection 0.0%
100% better than Ohio average

Ohio average: 0.5%

Lost Too Much Weight Info Percent of long-stay residents who lose too much weight 5.9%
In line with Ohio average

Ohio average: 6.2%

Depressive Symptoms Info Percent of long-stay residents who have depressive symptoms 18.5%
23% better than Ohio average

Ohio average: 24.0%

Antipsychotic Use Info Percent of long-stay residents who received an antipsychotic medication 9.0%
6% worse than Ohio average

Ohio average: 8.4%

Pneumococcal Vaccine Info Percent of long-stay residents assessed and appropriately given the pneumococcal vaccine 100.0%
8% better than Ohio average

Ohio average: 92.4%

Influenza Vaccine Info Percent of long-stay residents assessed and appropriately given the seasonal influenza vaccine 81.3%
14% worse than Ohio average

Ohio average: 94.5%

Short-stay resident measures
Below average Ohio avg: 2.4 Info CMS star rating based on short-stay quality measure performance. 5 stars = much above average, 1 star = much below average.
Pneumococcal Vaccine Info Percent of short-stay residents assessed and appropriately given the pneumococcal vaccine 99.3%
27% better than Ohio average

Ohio average: 78.0%

Antipsychotic medication increase Info Percent of short-stay residents who newly received an antipsychotic medication 0.9%
27% better than Ohio average

Ohio average: 1.3%

Influenza Vaccine Info Percent of short-stay residents assessed and appropriately given the seasonal influenza vaccine 33.8%
55% worse than Ohio average

Ohio average: 75.6%

Re-hospitalized after SNF stay Info Percentage of short-stay residents who were re-hospitalized after their nursing home admission. 20.4%
19% better than Ohio average

Ohio average: 25.1%

Emergency department visits Info Percentage of short-stay residents who had an outpatient emergency department visit. 16.7%
34% worse than Ohio average

Ohio average: 12.5%

Falls with major injury Info Percentage of SNF residents who experience falls with major injury during their stay. 0.0%
100% better than Ohio average

Ohio average: 0.8%

Penalties and fines

Federal penalties imposed by CMS for regulatory violations, including civil money penalties (fines) and denials of payment for new Medicare/Medicaid admissions.

Source: CMS Penalties Database (Data as of Jan 2026)

Total fines amount $206K
200% higher than Ohio average

Ohio average: $69K

Number of fines 6
224% more fines than Ohio average

Ohio average: 1.9

Payment Denials Info Serious action where Medicare and/or Medicaid temporarily stops payments for new residents until issues are fixed. 1
86% more payment denials than Ohio average

Ohio average: 0.5

Fines amount comparison
This facility $206K
Ohio average $69K
Penalty History

Penalties are imposed by CMS for violations of federal nursing home regulations.

7 penalties in the past 3 years

Multiple penalties were reported in the last 3 years.

Civil Money Penalty Info Fines imposed for noncompliance, which can be assessed per day or per instance of violation. Feb 13, 2025
$36K
Civil Money Penalty Info Fines imposed for noncompliance, which can be assessed per day or per instance of violation. Feb 20, 2024
$4K
Civil Money Penalty Info Fines imposed for noncompliance, which can be assessed per day or per instance of violation. Feb 12, 2024
$4K
Civil Money Penalty Info Fines imposed for noncompliance, which can be assessed per day or per instance of violation. Jan 22, 2024
$9K

Last updated: Jan 2026

Compare Nursing Home around Cleveland The information below is reported by the Ohio Department of Health, Bureau of Survey and Certification.

5 facilities compared · CMS & OH Dept. of Health data · Updated May 2026

Filter by care type
Algart Health Care
NH

Nursing Home Licensed facility providing 24/7 skilled nursing care for residents with complex, ongoing medical needs. Staffed by RNs, LPNs, and CNAs. Inspected and star-rated annually by CMS. Accepts Medicare (short-term rehab) and Medicaid (long-term care).

AL

Assisted Living A licensed, long-term care setting for seniors or individuals with disabilities who need help with daily activities — like bathing, dressing, and medication management — but not 24-hour skilled nursing. Offers housing, meals, and around-the-clock support while aiming to maximize resident independence.

Cleveland (Edgewater) 36 94.3% +20% 4.17 -48% +18% 0 11 5.5 - 69 - 62 Ireland, Garth $11.1M $2.7M 23.9% 366308
Crawford Manor Health Care Center
NH

Nursing Home Licensed facility providing 24/7 skilled nursing care for residents with complex, ongoing medical needs. Staffed by RNs, LPNs, and CNAs. Inspected and star-rated annually by CMS. Accepts Medicare (short-term rehab) and Medicaid (long-term care).

AL

Assisted Living A licensed, long-term care setting for seniors or individuals with disabilities who need help with daily activities — like bathing, dressing, and medication management — but not 24-hour skilled nursing. Offers housing, meals, and around-the-clock support while aiming to maximize resident independence.

Cleveland (Hough) 50 76.1% -3% 3.72 -23% +5% 2 45 5.6 2 33 D- 70 Hall, Gregory $4.4M $2.1M 47.9% 366110
CityView Healthcare & Rehabilitation
NH

Nursing Home Licensed facility providing 24/7 skilled nursing care for residents with complex, ongoing medical needs. Staffed by RNs, LPNs, and CNAs. Inspected and star-rated annually by CMS. Accepts Medicare (short-term rehab) and Medicaid (long-term care).

AL

Assisted Living A licensed, long-term care setting for seniors or individuals with disabilities who need help with daily activities — like bathing, dressing, and medication management — but not 24-hour skilled nursing. Offers housing, meals, and around-the-clock support while aiming to maximize resident independence.

Cleveland (Central) 146 70.0% -11% 2.91 -38% -18% 4 47 3.6 5 94 - 60 - $14.3M $5.2M 36.4% 365879
Harvard Gardens Rehabilitation and Care Center
NH

Nursing Home Licensed facility providing 24/7 skilled nursing care for residents with complex, ongoing medical needs. Staffed by RNs, LPNs, and CNAs. Inspected and star-rated annually by CMS. Accepts Medicare (short-term rehab) and Medicaid (long-term care).

AL

Assisted Living A licensed, long-term care setting for seniors or individuals with disabilities who need help with daily activities — like bathing, dressing, and medication management — but not 24-hour skilled nursing. Offers housing, meals, and around-the-clock support while aiming to maximize resident independence.

IL

Independent Living Lifestyle-focused communities for older adults offering dining, activities, and transportation with minimal personal care. Best for active, independent seniors who want community without medical support.

MC

Memory Care Secured, specialized care for people living with Alzheimer's or dementia. Staff trained in cognitive impairment, with higher staff-to-resident ratios and an environment designed to reduce confusion and wandering risk.

Cleveland (Lee - Miles) 130 62.8% -20% 3.77 -28% +6% 6 58 5.8 3 89 - 34 Hgrcc Holdings Llc $10.4M $4.4M 42.1% 365828
Baldwin Manor Nursing Home -
NH

Nursing Home Licensed facility providing 24/7 skilled nursing care for residents with complex, ongoing medical needs. Staffed by RNs, LPNs, and CNAs. Inspected and star-rated annually by CMS. Accepts Medicare (short-term rehab) and Medicaid (long-term care).

Cleveland (Woodland Hills) - - - - - - - - - 0 - - - - - 39 - - - - -

Guides for Better Senior Living

Care Cost Calculator: See Prices in Your Area

Nursing Home Data Explorer

Don’t Wait Too Long: 7 Red Flag Signs Your Parent Needs Assisted Living Now

The True Cost of Assisted Living in 2025 – And How Families Are Paying For It

Understanding Senior Living Costs: Pricing Models, Discounts & Financial Assistance

Frequently Asked Questions about Harvard Gardens Rehabilitation and Care Center

What neighborhood is Harvard Gardens Rehabilitation and Care Center in?

Harvard Gardens Rehabilitation and Care Center is in the Lee - Miles neighborhood.

Is Harvard Gardens Rehabilitation and Care Center in a walkable area?

Harvard Gardens Rehabilitation and Care Center has a walk score of 34. Somewhat walkable. A few nearby services may be reachable on foot, but most trips require transportation.

Are there photos of Harvard Gardens Rehabilitation and Care Center?

Yes — there are 3 photos of Harvard Gardens Rehabilitation and Care Center in the photo gallery on this page.

What is the address of Harvard Gardens Rehabilitation and Care Center?

Harvard Gardens Rehabilitation and Care Center is located at 18810 Harvard Ave, Cleveland, OH 44122, United States.

What is the phone number of Harvard Gardens Rehabilitation and Care Center?

(216) 752-3600 will put you in contact with the team at Harvard Gardens Rehabilitation and Care Center.

Is Harvard Gardens Rehabilitation and Care Center Medicare or Medicaid certified?

Yes — Harvard Gardens Rehabilitation and Care Center is a CMS-certified provider of Medicare and Medicaid.

Explore Open Rooms
1 Contact details
2 What type of senior care service are you looking for?
3 What budget do you have in mind for senior care?
4 How soon do you need to find care?
5 Additional details

Thank you for your interest!

Our team will be in touch shortly to help with next steps.