Total health inspections
5
Arizona average 6.3
Last Health inspection on Aug 2025

We arrange tours, appointments, and even moving support so you don’t have to
Thank you for your interest!
Our team will be in touch shortly to help with next steps.
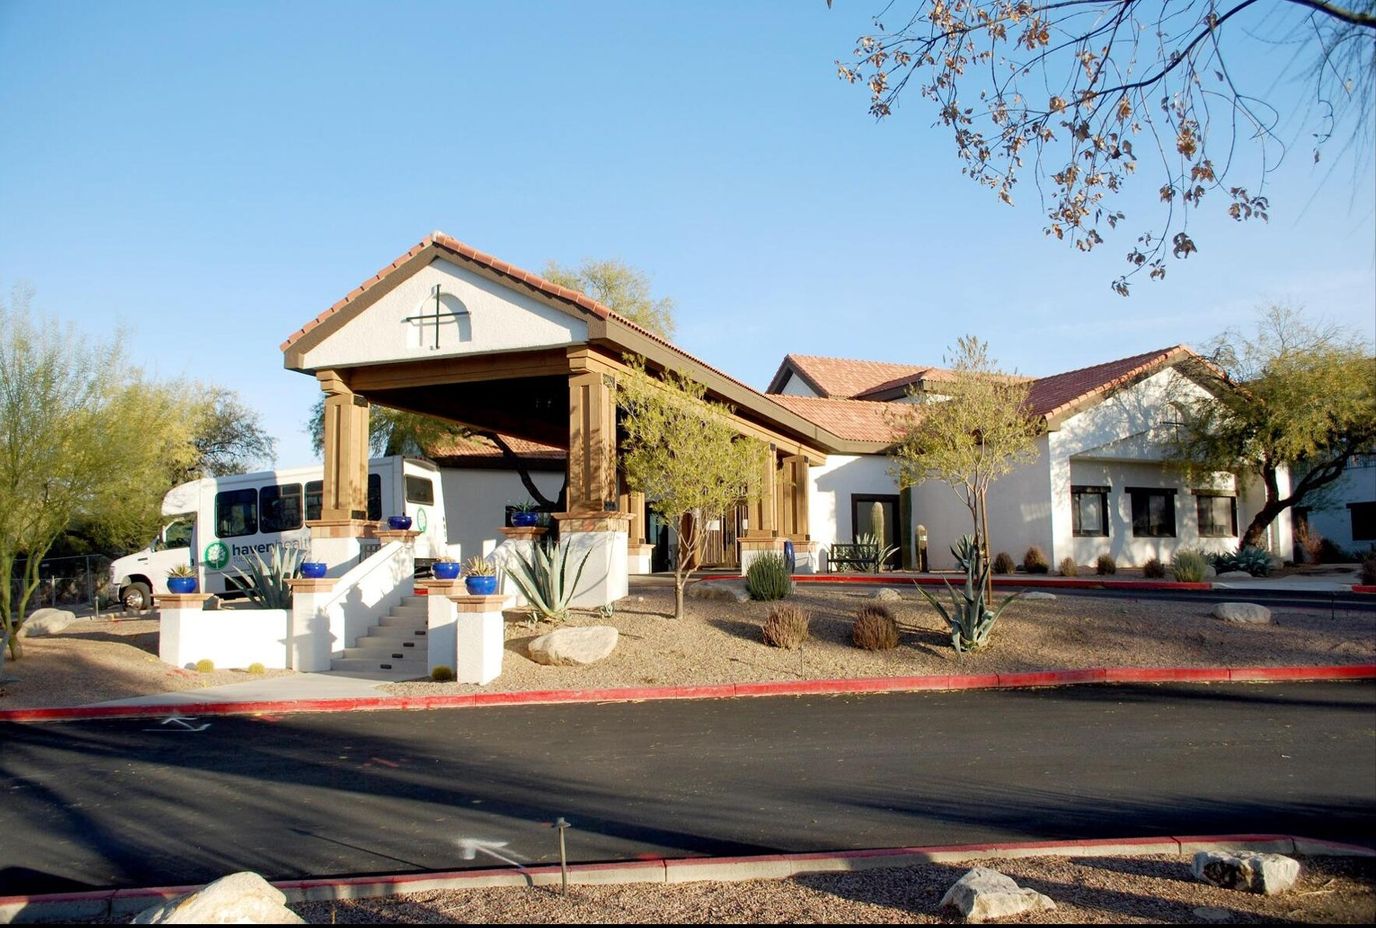
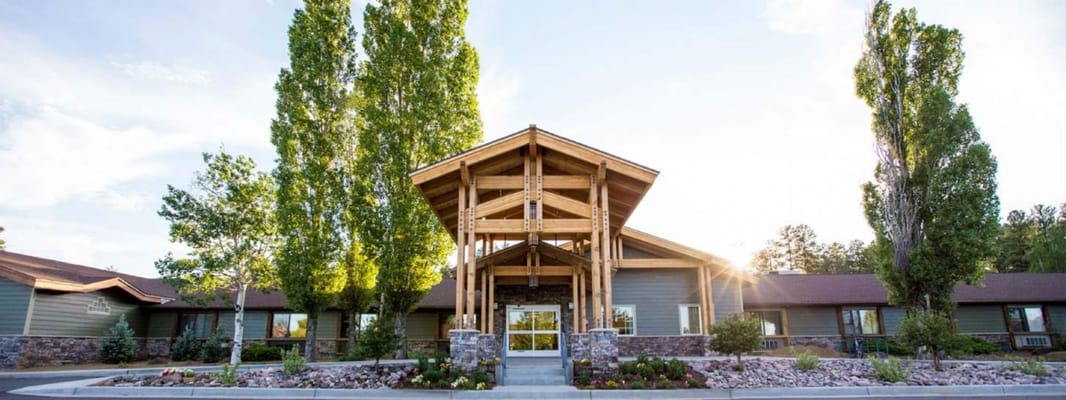

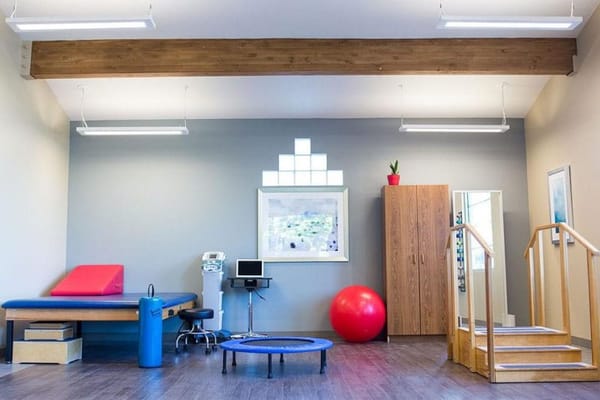

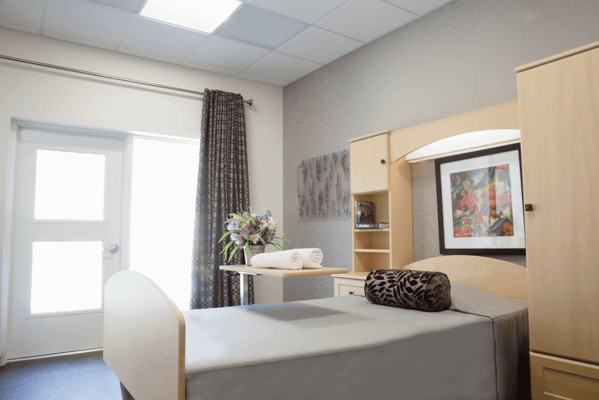
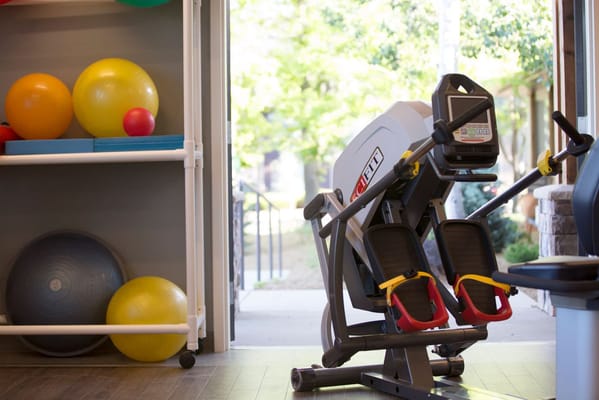


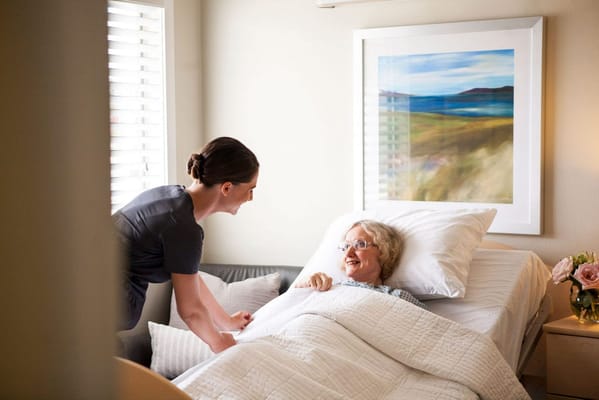


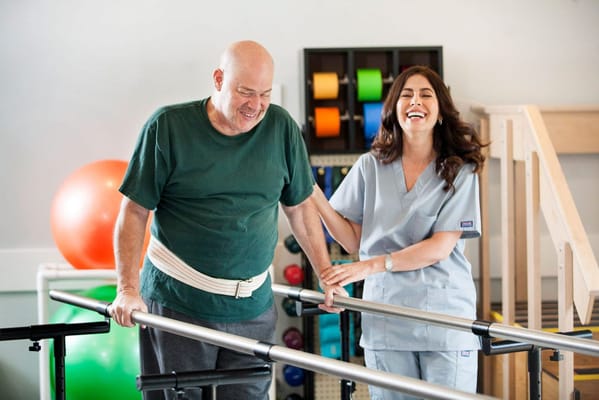

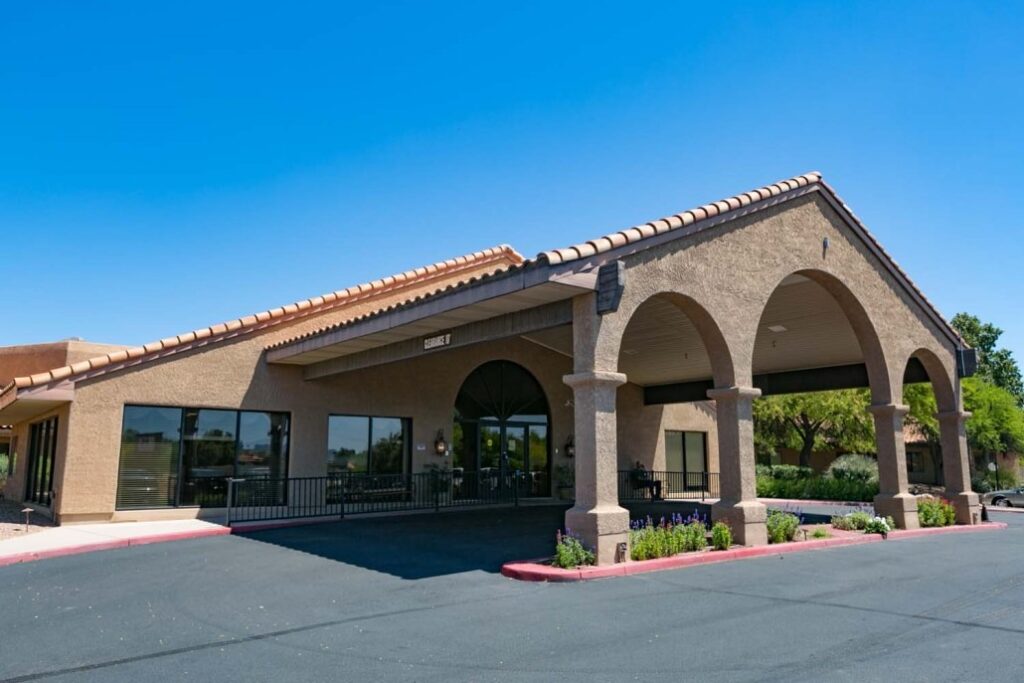
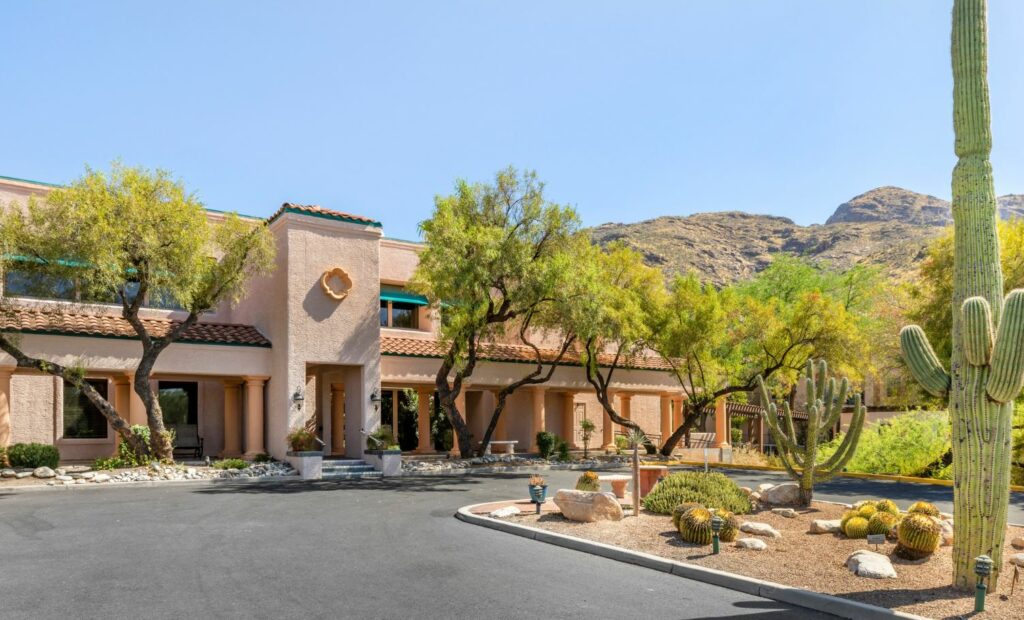
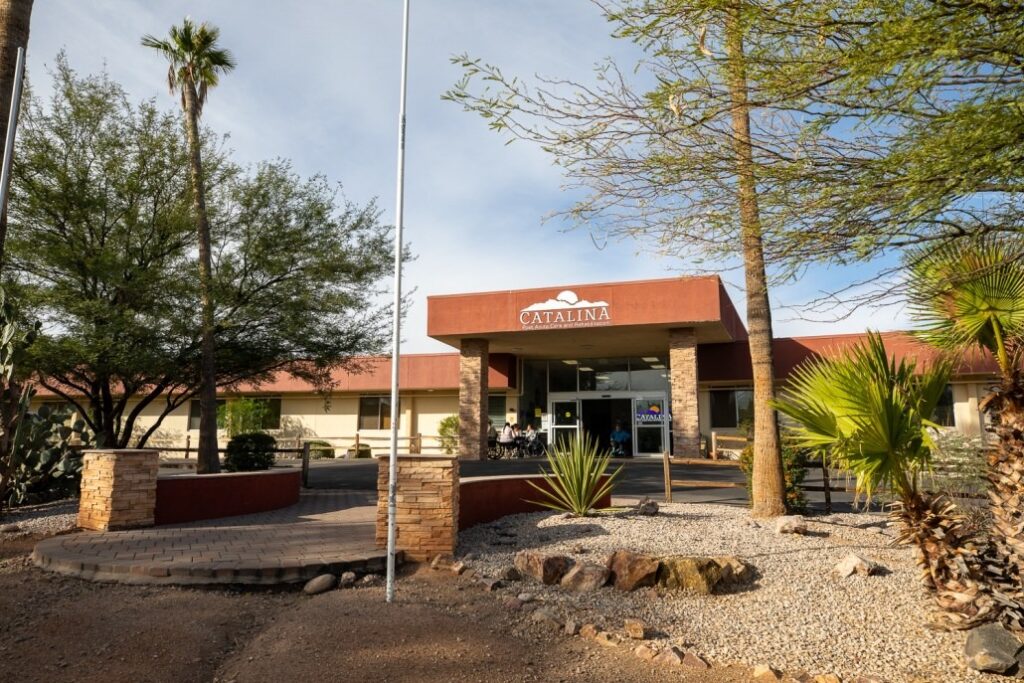
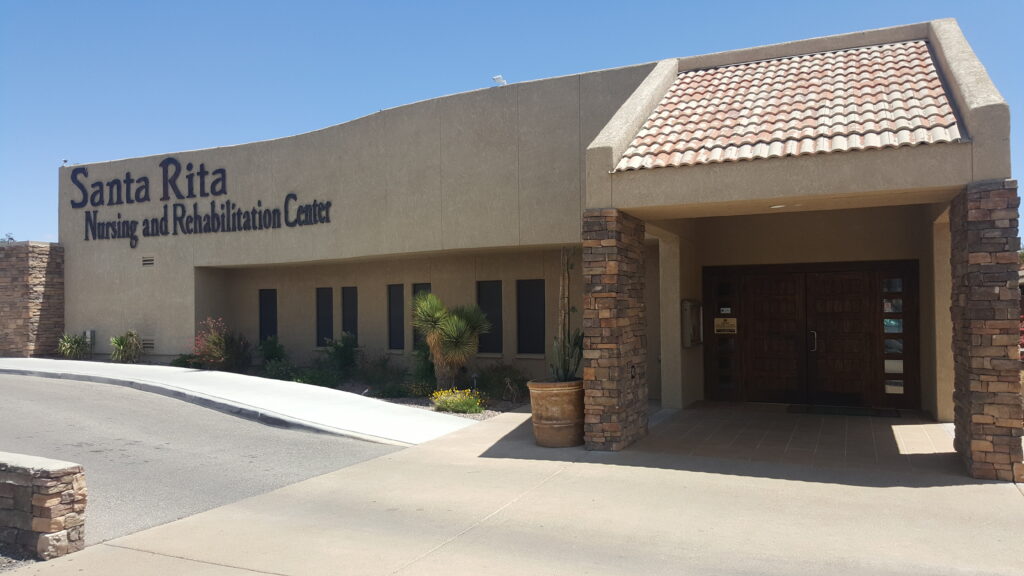
Beautifully nestled in the warm neighborhood of Tucson, AZ, Haven Health Tucson provides a relaxing and cozy setting for skilled nursing care and rehabilitation services. Their team of excellent care professionals works closely with residents and their families in creating personalized care plans that suit their individual needs and preferences. With access to physical therapy, occupational therapy, and speech therapy, residents have the tools they need to maintain their mobility and strength to continue living their best lives.
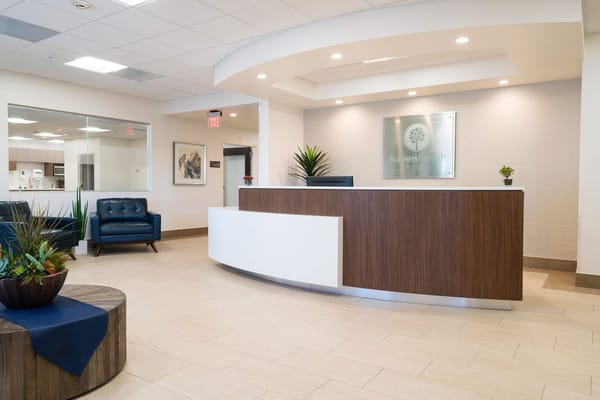
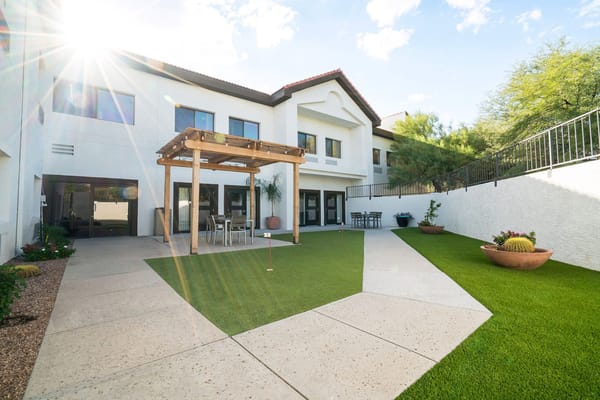
From enriching activities to delicious meals, the community provides residents with all that they need to maintain their wellness and well-being. Spacious and cozy common areas are also available to provide residents with relaxing spaces for chatting with friends. Here, you can receive top-notch care amidst an intimate residential environment that fosters fun and relaxation.
Offers a balance of services and community atmosphere.
Lower occupancy suggests more openings may be available.
Residents typically stay for brief periods, with frequent admissions and discharges throughout the year.
21% of new residents, usually for short-term rehab.
73% of new residents, often for short stays.
6% of new residents, often for long-term daily care.
Haven Health Tucson is legally operated by Haven Of Tucson, and administrated by Andrew Miles.
Key information about the people who lead and staff this community.
Housing Options: Private Rooms
Building Type: 2-story
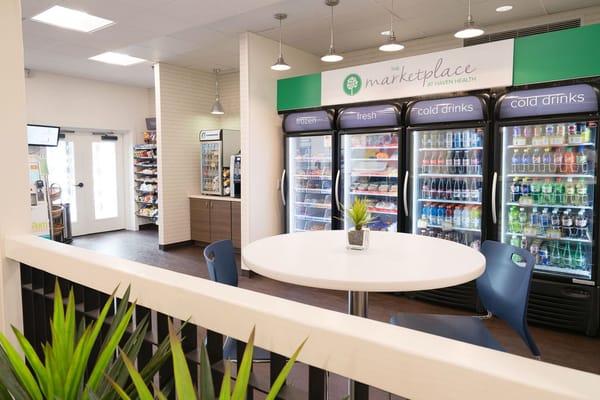
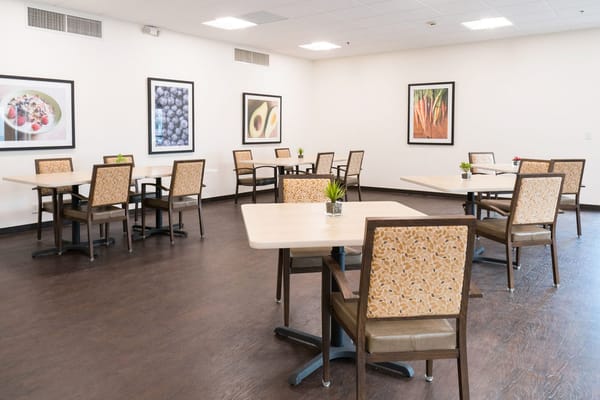
Dining Services
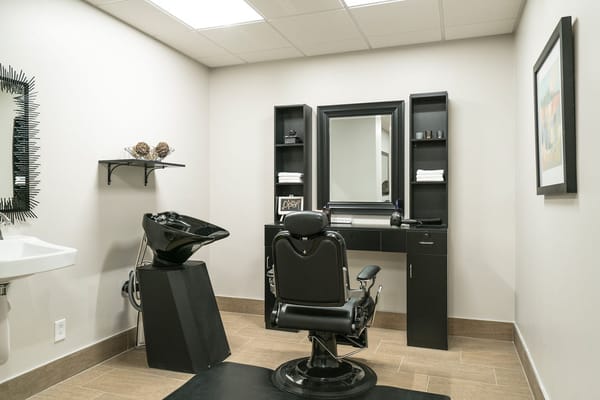
Beauty Services
Housekeeping Services

Health Programs
In Arizona, the Department of Health Services, Bureau of Long Term Care Licensing performs regular onsite inspections and investigates complaints for all licensed residential and nursing facilities.
12 complaint inspections
Arizona average: 6 complaint visits
Arizona average: 5 inspections
Formal expressions of dissatisfaction or concern made by residents, or their families regarding various aspects of the care, services, and environment provided.
Arizona average: 6 complaints
Deficiencies indicate regulatory issues. A higher number implies the facility had several areas requiring improvement.
Arizona average: 9 deficiencies
The most recent inspection on April 28, 2025, found no deficiencies. Earlier inspections showed a pattern of deficiencies primarily related to medication management, care planning, infection control, and dietary services. Prior reports also noted issues with documentation, restraint monitoring, hearing assistance, and physical environment maintenance. Complaint investigations were generally unsubstantiated, with no enforcement actions or fines listed in the available reports. The facility’s inspection history indicates some recurring areas for improvement, but recent surveys suggest progress toward resolving prior issues.
Arizona average 6.3
Last Health inspection on Aug 2025
Arizona average 23.2
Arizona average 3.82
Health citations are formal notices following inspections when they fail to comply with safety and care standards.
13 of 19 citations resulted from standard inspections; 3 of 19 resulted from complaint investigations; and 3 of 19 came from combined inspections (standard and complaint).
Arizona average: 0.1
Arizona average: 0.6
Data sourced from CMS Health Deficiencies reports. Citation severity codes range from A (least serious) to L (most serious). Immediate Jeopardy (J-L) citations indicate situations where the facility's noncompliance has placed residents at risk of death or serious harm.
Nursing Home Licensed facility providing 24/7 skilled nursing care for residents with complex, ongoing medical needs. Staffed by RNs, LPNs, and CNAs. Inspected and star-rated annually by CMS. Accepts Medicare (short-term rehab) and Medicaid (long-term care).
Nursing Home Licensed facility providing 24/7 skilled nursing care for residents with complex, ongoing medical needs. Staffed by RNs, LPNs, and CNAs. Inspected and star-rated annually by CMS. Accepts Medicare (short-term rehab) and Medicaid (long-term care).
Assisted Living A licensed, long-term care setting for seniors or individuals with disabilities who need help with daily activities — like bathing, dressing, and medication management — but not 24-hour skilled nursing. Offers housing, meals, and around-the-clock support while aiming to maximize resident independence.
Independent Living Lifestyle-focused communities for older adults offering dining, activities, and transportation with minimal personal care. Best for active, independent seniors who want community without medical support.
Memory Care Secured, specialized care for people living with Alzheimer's or dementia. Staff trained in cognitive impairment, with higher staff-to-resident ratios and an environment designed to reduce confusion and wandering risk.
Nursing Home Licensed facility providing 24/7 skilled nursing care for residents with complex, ongoing medical needs. Staffed by RNs, LPNs, and CNAs. Inspected and star-rated annually by CMS. Accepts Medicare (short-term rehab) and Medicaid (long-term care).
Nursing Home Licensed facility providing 24/7 skilled nursing care for residents with complex, ongoing medical needs. Staffed by RNs, LPNs, and CNAs. Inspected and star-rated annually by CMS. Accepts Medicare (short-term rehab) and Medicaid (long-term care).
Nursing Home Licensed facility providing 24/7 skilled nursing care for residents with complex, ongoing medical needs. Staffed by RNs, LPNs, and CNAs. Inspected and star-rated annually by CMS. Accepts Medicare (short-term rehab) and Medicaid (long-term care).
![]() 6.3 miles from city center
6.3 miles from city center
Add your location
This data corresponds to Q2 2025 and is based on CMS Payroll-Based Journal.
Arizona average ratio: 1.83:1
Arizona average: 8.5 hours
Manages medical care and health needs.
This role is partially covered by contractors.
Assists with medical care and medications.
This role is partially covered by contractors.
Helps with daily care and mobility.
This role is partially covered by contractors.
Total hours from contractors
7,808 contractor hours this quarter
| Certified Nursing Assistant | 59 | 7 | 66 | 18,048 | 91 | 100% | 9.7 |
| Licensed Practical Nurse | 25 | 3 | 28 | 9,726 | 91 | 100% | 9.2 |
| Qualified Activities Professional | 27 | 0 | 27 | 7,417 | 91 | 100% | 9.2 |
| Registered Nurse | 20 | 2 | 22 | 6,869 | 91 | 100% | 9.1 |
| Physical Therapy Aide | 0 | 8 | 8 | 2,159 | 86 | 95% | 6.7 |
| Speech Language Pathologist | 0 | 9 | 9 | 1,714 | 83 | 91% | 6.9 |
| Dental Services Staff | 4 | 0 | 4 | 1,411 | 65 | 71% | 8 |
| Other Dietary Services Staff | 2 | 0 | 2 | 949 | 66 | 73% | 7.4 |
| Physical Therapy Assistant | 0 | 3 | 3 | 619 | 81 | 89% | 7.3 |
| Respiratory Therapy Technician | 0 | 6 | 6 | 596 | 74 | 81% | 6.8 |
| Administrator | 1 | 0 | 1 | 512 | 64 | 70% | 8 |
| Therapeutic Recreation Specialist | 0 | 1 | 1 | 467 | 55 | 60% | 8.5 |
| Clinical Nurse Specialist | 2 | 0 | 2 | 464 | 32 | 35% | 8 |
| Qualified Social Worker | 0 | 1 | 1 | 388 | 70 | 77% | 5.5 |
| Nurse Practitioner | 2 | 0 | 2 | 384 | 59 | 65% | 6.5 |
| Occupational Therapy Aide | 0 | 1 | 1 | 94 | 45 | 49% | 2.1 |
| Medical Director | 0 | 1 | 1 | 57 | 6 | 7% | 9.5 |
| Occupational Therapy Assistant | 0 | 1 | 1 | 27 | 3 | 3% | 9 |
Source: CMS Long-Term Care Facility Characteristics (Data as of Jan 2026)
Residents meet regularly to discuss policies, care quality, and activities
State-approved Nurse Aide Training and Competency Evaluation Program on-site
Organized group of residents that meets regularly to discuss facility policies, quality of life, and activities.
Data sourced from CMS Long-Term Care Facility Characteristics quarterly report. Payer mix reflects the current resident census by primary payment source.
These measures show how residents usually do over time at this home, based on health outcomes and preventive care.
Arizona average: 7.6
Arizona average: 16.1
Arizona average: 11.2%
Arizona average: 20.8%
Arizona average: 2.1%
Arizona average: 5.1%
Arizona average: 1.3%
Arizona average: 5.4%
Arizona average: 4.5%
Arizona average: 10.3%
Arizona average: 97.2%
Arizona average: 94.6%
Arizona average: 91.5%
Arizona average: 1.0%
Arizona average: 87.3%
Quality measures are calculated from Minimum Data Set (MDS) assessments. For most measures, lower percentages indicate better care quality.
Federal penalties imposed by CMS for regulatory violations, including civil money penalties (fines) and denials of payment for new Medicare/Medicaid admissions.
Source: CMS Penalties Database (Data as of Jan 2026)
Arizona average: $30K
Arizona average: 1.7
Arizona average: 0.1
Penalties are imposed by CMS for violations of federal nursing home regulations.
Last updated: Jan 2026
Historical financial and operational data for Haven Health Tucson based on CMS SNF Cost Reports.
Loading trend charts...
Care Cost Calculator: See Prices in Your Area
Nursing Home Data Explorer
Don’t Wait Too Long: 7 Red Flag Signs Your Parent Needs Assisted Living Now
The True Cost of Assisted Living in 2025 – And How Families Are Paying For It
Understanding Senior Living Costs: Pricing Models, Discounts & Financial Assistance

Touring a community? Use this expert-backed checklist to stay organized, ask the right questions, and find the perfect fit.
We'll send you a PDF version of the touring checklist.