Explore Open Rooms

1 Contact details
2 What type of senior care service are you looking for?
3 What budget do you have in mind for senior care?
4 How soon do you need to find care?
5 Additional details

Thank you for your interest!

Our team will be in touch shortly to help with next steps.

Nursing Home

Hermitage Care & Rehabilitation Center

Nursing Home

Hermitage Care & Rehabilitation Center

1614 W Parrish Ave, Owensboro, KY 42301 View map
Overview of Hermitage Care & Rehabilitation Center

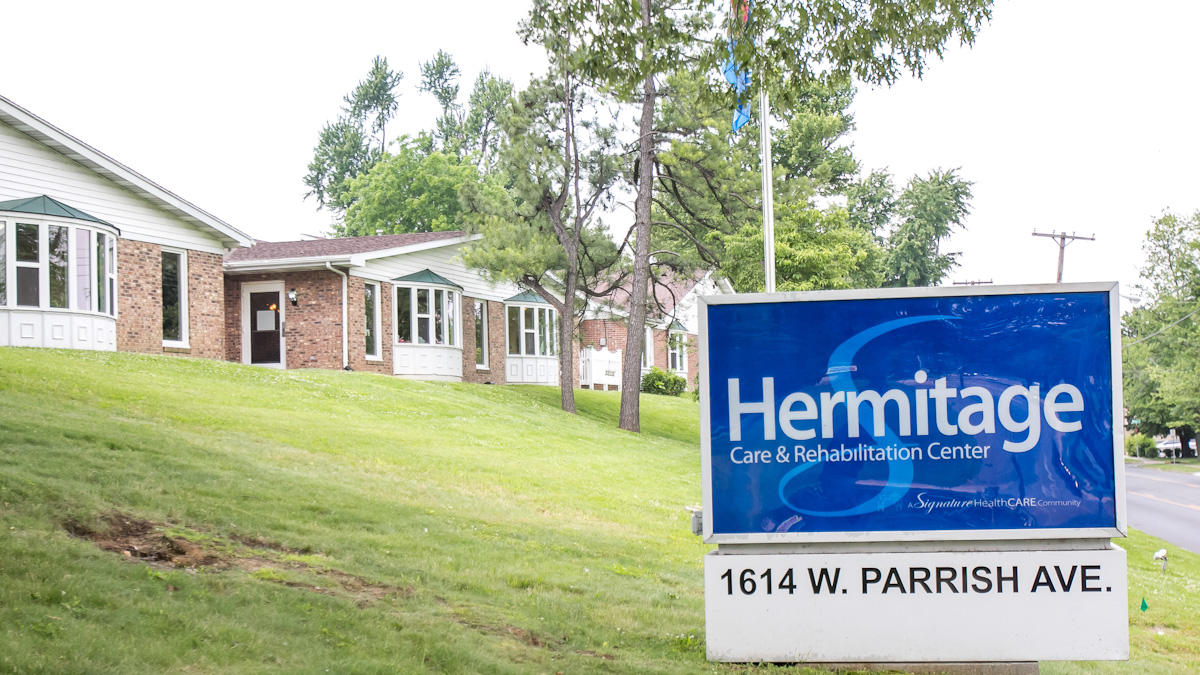
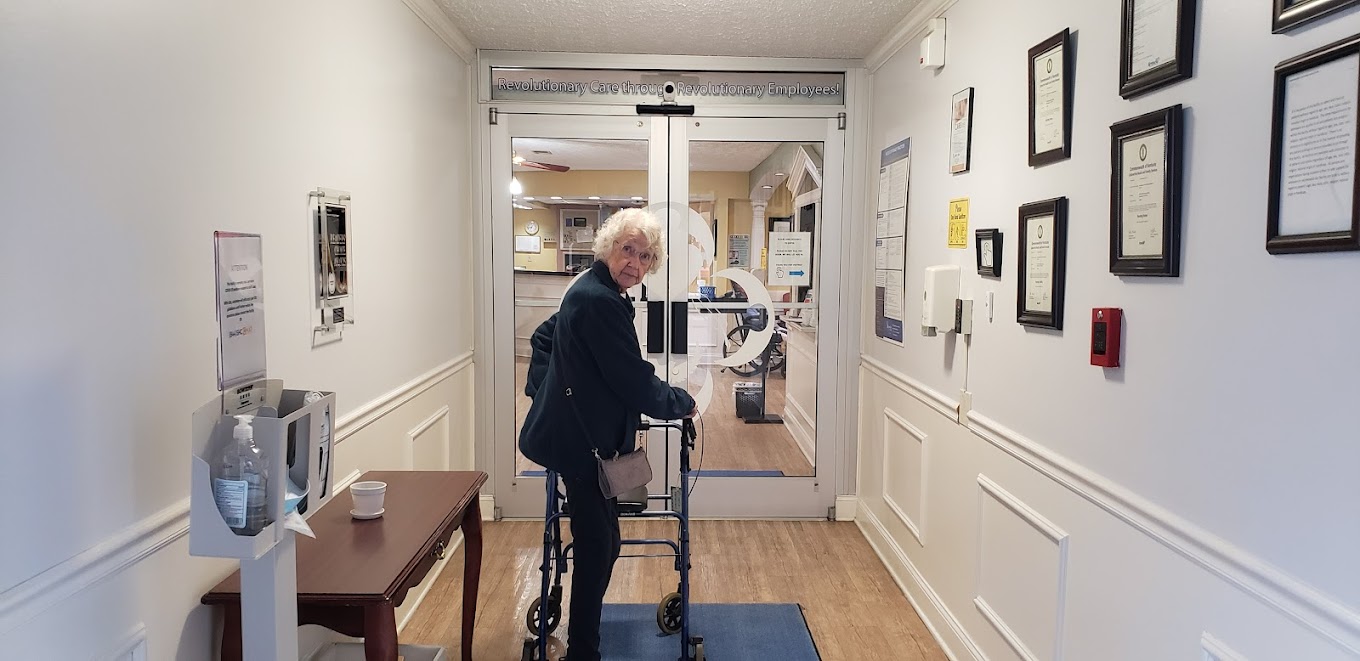
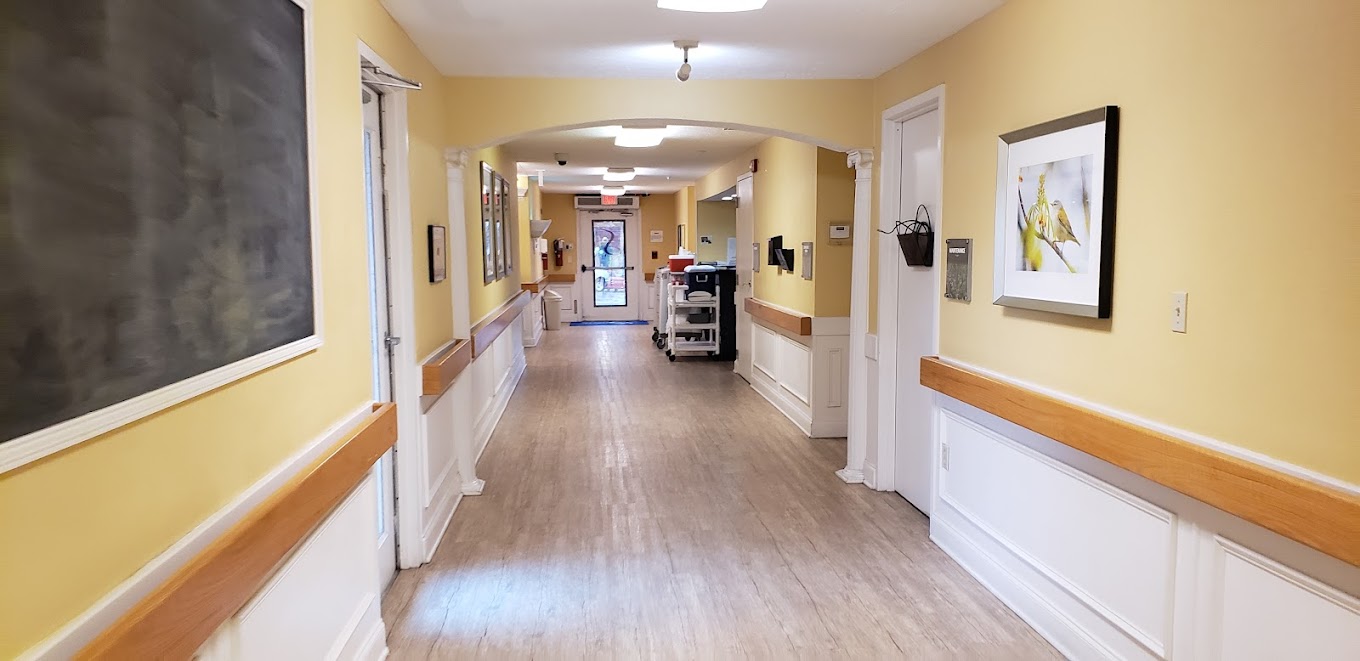
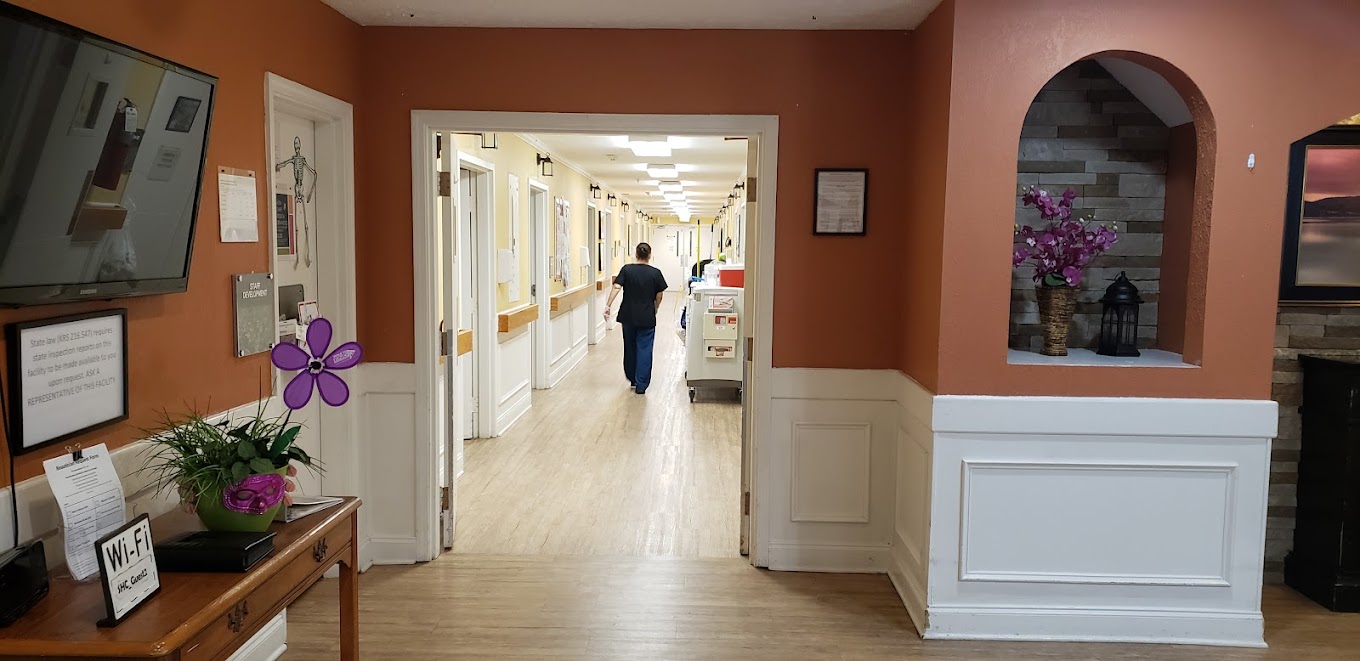
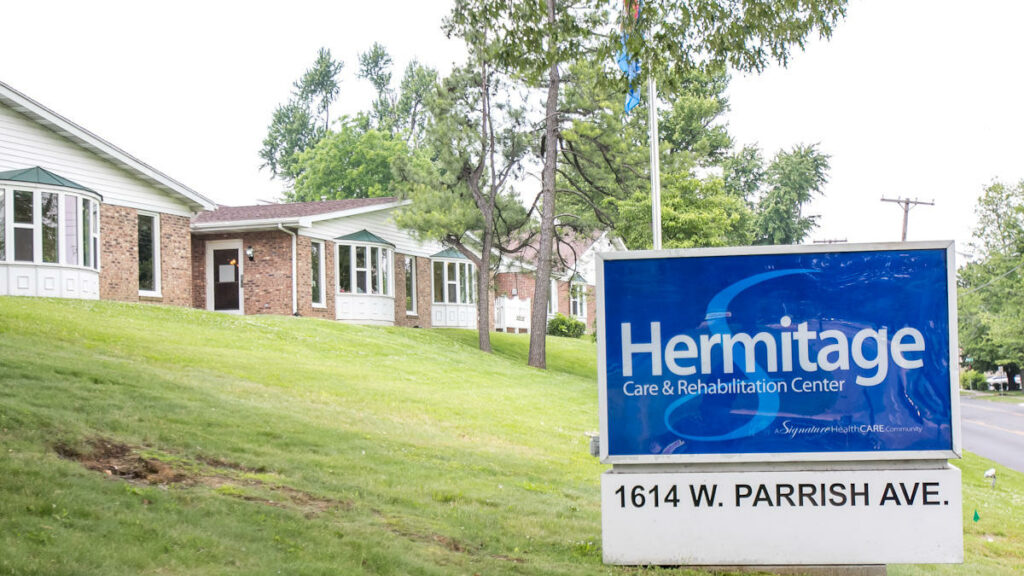
Hermitage Care and Rehabilitation Center in Owensboro, KY, is a prime skilled nursing community offering comprehensive services including clinical services, rehabilitation, care navigation, and more. Here, residents can choose from a wide array of well-accommodated and beautifully designed accommodations with a variety of floor plans. Committed to providing exceptional care that gives the comfort of a home in a friendly environment, a warm and caring team works 24/7 catering to the immediate needs and interests of its residents.

Dedicated to helping its residents continue to live life to the fullest, the community offers top-grade amenities and services, including social events and holiday programs, group excursions, and many more. Explore the friendly environment with a picturesque courtyard and bask in the area with your new friends. At Hermitage Care and Rehabilitation Center, residents can experience an empowering and stress-free retirement.

(270) 684-4559

Quality ratings

Measured by Centers for Medicare & Medicaid Services (CMS)

Overall rating Info The Overall CMS Rating combines results from health inspections, staffing levels and quality measures. Health inspections carry the most weight. Staffing and quality scores can increase or decrease the final rating based on performance compared to state and national standards.
4/5
Kentucky average: 2.8/5
Health Inspection Info Based on the results of the facility's three most recent standard inspections and any complaint investigations. CMS reviews the number, scope, and severity of deficiencies, with more recent findings weighted more heavily.
4/5
Kentucky average: 2.9/5
Staffing Info Measures average nursing staff hours per resident per day, including Registered Nurses (RNs) and total nursing staff. Ratings are adjusted based on the level of care residents require and are compared to state and national benchmarks.
4/5
Kentucky average: 2.4/5
Quality Measures Info Based on clinical and physical health indicators reported to CMS, such as hospital readmissions, falls, pressure ulcers, and improvements in mobility. These measures reflect how well residents' health needs are being managed.
4/5
Kentucky average: 2.9/5

Nursing care per resident

Info This shows how many total hours of nursing staff time are available per resident each day. Higher numbers usually mean more staff support.
4h 11m per day

This home provides 21% more nursing time per resident than the Kentucky average.

Kentucky average: 3h 27m per day

Staffing hours breakdown

Info Hours of care per resident per day, broken down by staff type. Data from CMS Medicare.
Staff type Facility State avg National avg
Registered Nurse (RN) Info Registered nurse hours per resident per day. 1h 3m per day 46m per day 41m per day
Nurse Aide Info Nurse aide hours per resident per day. 2h 20m per day 2h 25m per day 2h 21m per day
Total Nursing (Weekend) Info Total number of nurse staff hours per resident per day on weekends. 3h 15m per day 3h 29m per day 3h 26m per day
Physical Therapist Info Physical therapist staff hours per resident per day. 6m per day 4m per day 4m per day
RN (Weekend) Info Registered nurse hours per resident per day on weekends. 36m per day 31m per day 29m per day

Capacity and availability

Smaller home

May offer a more intimate, personalized care environment.

Total beds 92

This home usually has limited availability

Occupancy is moderate, suggesting balanced demand.

Similar demand to the Kentucky average
Occupancy rate 88%
Residents per day (avg) 84
Occupancy rate
88%
Residents per day (avg)
84

Who this home usually serves

TYPE OF STAY

Mostly short-term rehab stays

Most residents typically stay for a few weeks or months before returning home or moving on.

Might be optimal for
Short stays Recovery Medicare-covered care

Breakdown by payment type

Medicare

58% of new residents, usually for short-term rehab.

Typical stay 27 days

Private pay

34% of new residents, often for short stays.

Typical stay 2 months

Medicaid

8% of new residents, often for long-term daily care.

Typical stay 1 - 2 years

Finances and operations

Privately-owned community
Operated by a partnership between two or more business owners.
Home revenue
$13.6M
Profit
$197.6K
Privately-owned community Operated by a partnership between two or more business owners.
Home revenue
$13,564,025.00
Profit
$197,605.00
Payroll costs Info The portion of the home's budget spent on staff, including nurses, caregivers, and other employees who support care and operations.
$3.9M
28.6% of revenue
Other operating costs Info All remaining costs needed to run the home, such as food, utilities, building maintenance, supplies and administrative expenses.
$9.5M
Total costs $13.4M
Bed community size
92-bed community
A larger shared setting that may offer more common spaces and organized community services.
Years in operation
18 years in operation
A longer operating history, which may indicate experience navigating regulations and delivering ongoing care.
Walk Score
Walk Score: 49 / 100
Somewhat walkable. A few nearby services may be reachable on foot, but most trips require transportation.
BBB Rating
BBB Rating: A+ (Not Accredited)
An independent rating from the Better Business Bureau based on factors such as complaint history, transparency, and business practices.
How BBB ratings work

About this community

Occupancy

Occupancy rate
88%
In line with Kentucky average
Occupied beds
81 / 92
Average residents 80 per day

License details

Facility type
Long Term Care (nursing Facility, Nursing Home)
Status Active
Issuance July 1, 2025
Expiration June 30, 2026
County: DAVIESS

Additional licensing details

License number: 100086

Ownership & operating entity

Hermitage Care & Rehabilitation Center is legally operated by LP OWENSBORO, LLC, and administrated by MATTHEW.

Type Of Units

Long Term Care
16 units
NF (Nursing Facility)
76 units
Total beds
92 units

Staffing

Key information about the people who lead and staff this community.

Leadership

Contact: CEO

Care Services

Rehabilitation Services

Programs & Activities

Specific Programs
Clinical Services, Rehabilitation, Care Navigation, Life Enrichment

What does this home offer?

Accepts Medicaid icon

Accept Medicaid: Yes

Total residents icon

Total Residents: 92

Building type icon
Building type icon

Building Type: Single-story

Types of Care at Hermitage Care & Rehabilitation Center

Nursing Home
Contact Hermitage Care & Rehabilitation Center

Inspection History

In Kentucky, the Cabinet for Health and Family Services, Office of Inspector General is the regulatory authority that conducts inspections and investigates complaints in all long-term care homes.

4 visits/inspections

Latest inspection

Date:March 6, 2025
Type:Complaint Investigation

4 deficiencies

Deficiencies indicate regulatory issues. A higher number implies the facility had several areas requiring improvement.

Inspection Report Summary for Hermitage Care & Rehabilitation Center

The most recent inspection on March 6, 2025, was a complaint investigation that found no deficient practices. The prior inspection on February 14, 2025, noted that the facility was not in substantial compliance with federal regulations but did not result in any deficiencies being issued. Earlier reports did not list any fines, enforcement actions, or license suspensions. Complaint investigations have generally been unsubstantiated, with no deficiencies identified in the latest review. The inspection history shows a stable compliance pattern with no recent citations and no indication of worsening issues.

Health Inspection History

Inspections
Total health inspections 2

Kentucky average 2.9


Last Health inspection on Feb 2025

Total health citations 4

Kentucky average 13.5

Citations per inspection
2

Kentucky average 4.4


Health citations are formal notices following inspections when they fail to comply with safety and care standards.

All 4 citations resulted from standard inspections.

Breakdown of citation severity (last 3 years)
Critical Health citations More info 0
100% better than Kentucky average

Kentucky average: 1.1


Serious Health citations More info 0
100% better than Kentucky average

Kentucky average: 0.6

0 critical citations More info Kentucky average: 1.1

0 serious citations More info Kentucky average: 0.6

4 moderate citations More info Kentucky average: 11.6

0 minor citations More info Kentucky average: 0.1
Citations history (last 3 years)
Nutrition moderate citation Info Issues related to food quality, meal service, and resident's nutritional needs. Feb 14, 2025
Corrected

Nutrition moderate citation Info Issues related to food quality, meal service, and resident's nutritional needs. Aug 09, 2018
Corrected

Care Planning moderate citation Info Issues related to creating and updating personalized care plans for residents based on their needs and conditions. Aug 09, 2018
Corrected

Resident Rights moderate citation Info Issues related to resident's rights, including dignity, privacy, and the ability to make decisions about their care. Aug 09, 2018
Corrected

Compare Nursing Homes around Owensboro The information below is reported by the Kentucky Cabinet for Health and Family Services, Office of Inspector General.

5 facilities compared · CMS & KY Dept. of Health data · Updated Mar 2026

The Transitional Care Center of Owensboro
NH

Nursing Home Licensed facility providing 24/7 skilled nursing care for residents with complex, ongoing medical needs. Staffed by RNs, LPNs, and CNAs. Inspected and star-rated annually by CMS. Accepts Medicare (short-term rehab) and Medicaid (long-term care).

AL

Assisted Living A licensed, long-term care setting for seniors or individuals with disabilities who need help with daily activities — like bathing, dressing, and medication management — but not 24-hour skilled nursing. Offers housing, meals, and around-the-clock support while aiming to maximize resident independence.

Owensboro
-
-
-
8.49
-
-
0
0
0
13
-
80
-
-
-
-
185396
Hermitage Care & Rehabilitation Center
AL

Assisted Living A licensed, long-term care setting for seniors or individuals with disabilities who need help with daily activities — like bathing, dressing, and medication management — but not 24-hour skilled nursing. Offers housing, meals, and around-the-clock support while aiming to maximize resident independence.

IL

Independent Living Lifestyle-focused communities for older adults offering dining, activities, and transportation with minimal personal care. Best for active, independent seniors who want community without medical support.

MC

Memory Care Secured, specialized care for people living with Alzheimer's or dementia. Staff trained in cognitive impairment, with higher staff-to-resident ratios and an environment designed to reduce confusion and wandering risk.

NH

Nursing Home Licensed facility providing 24/7 skilled nursing care for residents with complex, ongoing medical needs. Staffed by RNs, LPNs, and CNAs. Inspected and star-rated annually by CMS. Accepts Medicare (short-term rehab) and Medicaid (long-term care).

Owensboro
92
92.4%
+14%
4.18
+43%
+12%
0
4
0
84
A+
49
Clark, Matthew
$13,6M
$3,9M
28.6%
185346
Chautauqua Health and Rehabilitation
NH

Nursing Home Licensed facility providing 24/7 skilled nursing care for residents with complex, ongoing medical needs. Staffed by RNs, LPNs, and CNAs. Inspected and star-rated annually by CMS. Accepts Medicare (short-term rehab) and Medicaid (long-term care).

AL

Assisted Living A licensed, long-term care setting for seniors or individuals with disabilities who need help with daily activities — like bathing, dressing, and medication management — but not 24-hour skilled nursing. Offers housing, meals, and around-the-clock support while aiming to maximize resident independence.

OWENSBORO
184
62.3%
-23%
3.21
-28%
-14%
0
34
4
124
-
-
Davis, Donna
$12,9M
$5,2M
40.1%
185236
Chautauqua Health and Rehabilitation
-
NH

Nursing Home Licensed facility providing 24/7 skilled nursing care for residents with complex, ongoing medical needs. Staffed by RNs, LPNs, and CNAs. Inspected and star-rated annually by CMS. Accepts Medicare (short-term rehab) and Medicaid (long-term care).

AL

Assisted Living A licensed, long-term care setting for seniors or individuals with disabilities who need help with daily activities — like bathing, dressing, and medication management — but not 24-hour skilled nursing. Offers housing, meals, and around-the-clock support while aiming to maximize resident independence.

Owensboro
-
-
-
-
-
-
-
-
-
0
0
0
-
-
45
-
-
-
-
-
Riverside Care & Rehabilitation Center
-
NH

Nursing Home Licensed facility providing 24/7 skilled nursing care for residents with complex, ongoing medical needs. Staffed by RNs, LPNs, and CNAs. Inspected and star-rated annually by CMS. Accepts Medicare (short-term rehab) and Medicaid (long-term care).

AL

Assisted Living A licensed, long-term care setting for seniors or individuals with disabilities who need help with daily activities — like bathing, dressing, and medication management — but not 24-hour skilled nursing. Offers housing, meals, and around-the-clock support while aiming to maximize resident independence.

Owensboro
-
-
-
-
-
-
-
-
-
0
0
0
-
-
25
-
-
-
-
-

Places of interest near Hermitage Care & Rehabilitation Center

Address 1.6 miles from city center — 0.57 miles to nearest hospital (Owensboro Health Healthpark)

Address 1614 W Parrish Ave, Owensboro, KY 42301

Calculate Travel Distance to Hermitage Care & Rehabilitation Center

Add your location

Address

Staffing Data (Q2 2025)

This data corresponds to Q2 2025 and is based on CMS Payroll-Based Journal.

Total staff 142
Employees 135
Contractors 7
Staff to resident ratio 1.63:1
7% worse than Kentucky average

Kentucky average ratio: 1.75:1

Avg staff/day 47
Average shift 8.4 hours
0% compared with Kentucky average

Kentucky average: 8.5 hours

Total staff hours (quarter) 35,856
Nursing staff breakdown
Registered Nurse

Manages medical care and health needs.

Total count 21
Average shift length Info Average shift length. Calculated as total hours divided by days worked and average staff per day. 9.4 hours

This role is partially covered by contractors.

Licensed Practical Nurse

Assists with medical care and medications.

Total count 13
Average shift length Info Average shift length. Calculated as total hours divided by days worked and average staff per day. 9.4 hours

No contractors work on this role.

Certified Nursing Assistant

Helps with daily care and mobility.

Total count 71
Average shift length Info Average shift length. Calculated as total hours divided by days worked and average staff per day. 8.7 hours

No contractors work on this role.

Contractor staffing

Total hours from contractors

0.5%

169 contractor hours this quarter

Registered Nurse: 4 Occupational Therapy Assistant: 2 Medical Director: 1
Staff by category
Certified Nursing Assistant7107116,98491100%8.7
Registered Nurse174214,30991100%9.4
Licensed Practical Nurse130133,94291100%9.4
Clinical Nurse Specialist8082,9447481%7.8
Physical Therapy Assistant3031,0106571%7.6
Speech Language Pathologist2027777684%6.5
Medication Aide/Technician4047117481%7.3
Respiratory Therapy Technician2027026673%7.1
Mental Health Service Worker1015846673%8.8
Other Dietary Services Staff4045657481%7.6
Dietitian1015266875%7.7
Qualified Social Worker3035226774%4.4
Dental Services Staff1014846369%7.7
Administrator1014806066%8
RN Director of Nursing1014475763%7.8
Nurse Practitioner1014325358%8.1
Physical Therapy Aide2023475055%6.9
Occupational Therapy Assistant022551719%3.2
Medical Director011361314%2.8
71 Certified Nursing Assistant
% of Days 100%
21 Registered Nurse
% of Days 100%
13 Licensed Practical Nurse
% of Days 100%
8 Clinical Nurse Specialist
% of Days 81%
3 Physical Therapy Assistant
% of Days 71%
2 Speech Language Pathologist
% of Days 84%
4 Medication Aide/Technician
% of Days 81%
2 Respiratory Therapy Technician
% of Days 73%
1 Mental Health Service Worker
% of Days 73%
4 Other Dietary Services Staff
% of Days 81%
1 Dietitian
% of Days 75%
3 Qualified Social Worker
% of Days 74%
1 Dental Services Staff
% of Days 69%
1 Administrator
% of Days 66%
1 RN Director of Nursing
% of Days 63%
1 Nurse Practitioner
% of Days 58%
2 Physical Therapy Aide
% of Days 55%
2 Occupational Therapy Assistant
% of Days 19%
1 Medical Director
% of Days 14%

Facility Characteristics

Source: CMS Long-Term Care Facility Characteristics (Data as of Jan 2026)

Total census
87 residents
Residents by payment source
Medicare
23 residents (26.4%)
Medicaid
49 residents (56.3%)
Private pay or other
15 residents (17.2%)
Programs & Services
Residents' Group

Residents meet regularly to discuss policies, care quality, and activities

Active Resident Council

Organized group of residents that meets regularly to discuss facility policies, quality of life, and activities.

Quality of care over time

These measures show how residents usually do over time at this home, based on health outcomes and preventive care.

High-risk clinical events score Info A composite score based on pressure ulcers, falls with injury, weight loss, walking ability decline, and activities of daily living decline. 14.6
39% worse than Kentucky average

Kentucky average: 10.5

Functional decline score Info A composite score based on activities of daily living decline, walking ability decline, and incontinence. 27.2
44% worse than Kentucky average

Kentucky average: 18.9

Long-stay resident measures
Above average Kentucky avg: 3.6 Info CMS star rating based on long-stay quality measure performance. 5 stars = significantly above average, 1 star = significantly below average.
Need for Help with Daily Activities Increased Info Percent of long-stay residents whose need for help with daily activities has increased 30.3%
80% worse than Kentucky average

Kentucky average: 16.8%

Walking Ability Worsened Info Percent of long-stay residents whose ability to move independently worsened 29.7%
52% worse than Kentucky average

Kentucky average: 19.6%

Low Risk Residents with Bowel/Bladder Incontinence Info Percent of low risk long-stay residents who lose control of their bowels or bladder 21.7%
6% worse than Kentucky average

Kentucky average: 20.5%

Falls with Major Injury Info Percent of long-stay residents experiencing one or more falls with major injury 2.2%
41% better than Kentucky average

Kentucky average: 3.8%

High Risk Residents with Pressure Ulcers Info Percent of long-stay high risk residents with pressure ulcers 7.6%
32% worse than Kentucky average

Kentucky average: 5.8%

Urinary Tract Infection Info Percent of long-stay residents with a urinary tract infection 0.0%
100% better than Kentucky average

Kentucky average: 1.9%

Lost Too Much Weight Info Percent of long-stay residents who lose too much weight 3.1%
54% better than Kentucky average

Kentucky average: 6.8%

Depressive Symptoms Info Percent of long-stay residents who have depressive symptoms 5.9%
59% better than Kentucky average

Kentucky average: 14.3%

Antipsychotic Use Info Percent of long-stay residents who received an antipsychotic medication 4.5%
71% better than Kentucky average

Kentucky average: 15.6%

Pneumococcal Vaccine Info Percent of long-stay residents assessed and appropriately given the pneumococcal vaccine 92.9%
In line with Kentucky average

Kentucky average: 93.9%

Influenza Vaccine Info Percent of long-stay residents assessed and appropriately given the seasonal influenza vaccine 98.5%
In line with Kentucky average

Kentucky average: 96.2%

Hospitalizations per 1,000 days Info Number of hospitalizations per 1,000 long-stay resident days. 2.03
9% worse than Kentucky average

Kentucky average: 1.87

ED visits per 1,000 days Info Number of outpatient emergency department visits per 1,000 long-stay resident days. 1.00
54% better than Kentucky average

Kentucky average: 2.19

Short-stay resident measures
Above average Kentucky avg: 2.3 Info CMS star rating based on short-stay quality measure performance. 5 stars = much above average, 1 star = much below average.
Pneumococcal Vaccine Info Percent of short-stay residents assessed and appropriately given the pneumococcal vaccine 96.5%
15% better than Kentucky average

Kentucky average: 83.7%

Antipsychotic medication increase Info Percent of short-stay residents who newly received an antipsychotic medication 1.1%
43% better than Kentucky average

Kentucky average: 1.9%

Influenza Vaccine Info Percent of short-stay residents assessed and appropriately given the seasonal influenza vaccine 96.0%
15% better than Kentucky average

Kentucky average: 83.6%

Re-hospitalized after SNF stay Info Percentage of short-stay residents who were re-hospitalized after their nursing home admission. 27.3%
11% worse than Kentucky average

Kentucky average: 24.5%

Emergency department visits Info Percentage of short-stay residents who had an outpatient emergency department visit. 7.6%
45% better than Kentucky average

Kentucky average: 13.9%

Falls with major injury Info Percentage of SNF residents who experience falls with major injury during their stay. 0.7%
9% better than Kentucky average

Kentucky average: 0.8%

Ability to care for self at discharge Info Percentage of residents at or above expected ability to care for themselves at discharge. 56.6%
5% better than Kentucky average

Kentucky average: 53.7%

Successful return to home or community Info Rate of successful return to home or community from a skilled nursing facility. 55.4%
10% better than Kentucky average

Kentucky average: 50.6%

Guides for Better Senior Living

Care Cost Calculator: See Prices in Your Area

Nursing Home Data Explorer

Don’t Wait Too Long: 7 Red Flag Signs Your Parent Needs Assisted Living Now

The True Cost of Assisted Living in 2025 – And How Families Are Paying For It

Understanding Senior Living Costs: Pricing Models, Discounts & Financial Assistance

Financial Aid for Kentucky Seniors

Get financial aid guidance

Home and Community Based Waiver

Kentucky Medicaid HCB Waiver

Age 65+ or disabled, Kentucky resident, Medicaid-eligible, nursing home-level care need.

~$2,829/month (300% FBR, individual).

$2,000 (individual), $3,000 (couple).

Rural focus; waitlists possible.

Hart-Supported Living Program

KY Hart-Supported Living

Age 65+ or disabled, Kentucky resident.

No strict limit; prioritizes low-income.

Not applicable.

Competitive grants; limited availability.

Kentucky Homecare Program

Kentucky Homecare Program

Age 60+, Kentucky resident, at risk of nursing home placement, not eligible for Medicaid waivers.

No strict limit; prioritizes low-income (~$24,980/year individual).

Not assessed; need-based focus.

15 AAAs; rural focus; not in nursing homes.

Medicare Savings Program (MSP)

Kentucky Medicare Savings Program

Age 65+ or disabled, Kentucky resident, Medicare Part A/B.

~$2,510/month (QMB), ~$3,380/month (SLMB), ~$3,598/month (QI)—individual.

$9,430 (individual), $14,130 (couple).

Three tiers; no waitlist; auto Extra Help for Part D.

National Family Caregiver Support Program (NFCSP) Respite

Kentucky NFCSP Respite Care

Caregivers of 60+ needing care or 55+ caregivers of others; Kentucky resident; functional needs (2+ ADLs).

Prioritizes ~$24,980/year (individual); no strict cap.

Not assessed; need-based.

15 AAAs; prioritizes low-income, rural caregivers.

Kentucky Family Caregiver Program

Kentucky Family Caregiver Program

Grandparents (often 55+) as primary caregivers to grandchildren under 18, Kentucky resident, not on Kinship Care.

~$31,225/year (individual); varies by AAA.

Not strictly assessed; need-based.

Max $1,500/year; statewide via AAAs.

Senior Community Service Employment Program (SCSEP)

Kentucky SCSEP

Age 55+, unemployed, low-income, Kentucky resident.

~$1,983/month (125% FPL).

Not specified; income-focused.

Priority for veterans, rural residents.

VA Aid and Attendance (A&A) and Housebound Benefits

Kentucky VA Aid and Attendance/Housebound

Age 65+ or disabled veteran/spouse, Kentucky resident, wartime service, need for ADL help (A&A) or homebound.

Net income < ~$1,984/month (veteran with dependent, A&A); pension offsets income.

~$155,356 (net worth limit).

High veteran demand in rural areas.