Hillcrest Convalescent Center
Nursing Home · Durham, NC
CMS overall rating Info The Overall CMS Rating is scored from 1 to 5 stars and combines results from health inspections, staffing levels, and quality measures. Health inspections carry the most weight. Staffing and quality scores can increase or decrease the final rating based on performance compared to state and national standards.

Hillcrest Convalescent Center

Nursing Home · Durham, NC
CMS overall rating Info The Overall CMS Rating is scored from 1 to 5 stars and combines results from health inspections, staffing levels, and quality measures. Health inspections carry the most weight. Staffing and quality scores can increase or decrease the final rating based on performance compared to state and national standards.
Calculator: See prices in your area
Hillcrest Convalescent Center accepts Medicare, Medicaid, and private pay.

Overview of Hillcrest Convalescent Center

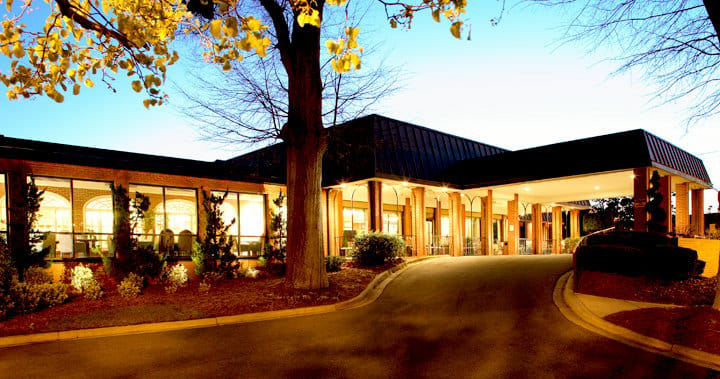
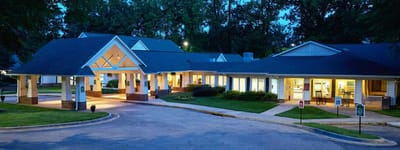
Set in Durham, North Carolina, Hillcrest Convalescent Center is a distinguished assisted living community offering various services, including Short-term Inpatient Rehabilitation, 24/7 Skilled Nursing, and Assisted Living. Hillcrest Durham is positioned just on the outskirts of the bustling downtown area, providing residents with easy access to local treasures. Rooted in seven decades of dedicated experience in senior care, it ensures that the level of care and contentment provided meets the highest standards. Their grounds exude tranquility, fostering an atmosphere of privacy and serenity.
Hillcrest Durham stands out by affording residents unparalleled privacy, personalized attention, and utmost convenience at the heart of Bull City, bolstered by round-the-clock skilled nursing care. Whether one requires a moderate level of assistance or a comprehensive care approach, Hillcrest Durham stands steadfast in delivering exceptional support. Within its spacious accommodations—featuring choices between private, semi-private, and even fully-appointed two-room suites—seniors find the ideal setting.

Quality ratings

Measured by Centers for Medicare & Medicaid Services (CMS)

Overall rating Info The Overall CMS Rating combines results from health inspections, staffing levels and quality measures. Health inspections carry the most weight. Staffing and quality scores can increase or decrease the final rating based on performance compared to state and national standards.
▲ 78.8% Above NC avg. ▲ 78.8% Above NC avg.Click the badge to see the full State ranking.Click here to see the full State ranking.
Health Inspection Info Based on the results of the facility's three most recent standard inspections and any complaint investigations. CMS reviews the number, scope, and severity of deficiencies, with more recent findings weighted more heavily.
▲ 77.0% Above NC avg. ▲ 77.0% Above NC avg.Click the badge to see the full State ranking.Click here to see the full State ranking.
Staffing Info Measures average nursing staff hours per resident per day, including Registered Nurses (RNs) and total nursing staff. Ratings are adjusted based on the level of care residents require and are compared to state and national benchmarks.
▲ 88.0% Above NC avg. ▲ 88.0% Above NC avg.Click the badge to see the full State ranking.Click here to see the full State ranking.
Quality Measures Info Based on clinical and physical health indicators reported to CMS, such as hospital readmissions, falls, pressure ulcers, and improvements in mobility. These measures reflect how well residents' health needs are being managed.
▼ 5.5% Below NC avg. ▼ 5.5% Below NC avg.Click the badge to see the full State ranking.Click here to see the full State ranking.

Staffing hours breakdown

Info Daily nursing hours per resident by staff type, reported to CMS. Higher is generally better — compare this facility to state and national averages to see where staffing stands.

Hours per resident per day — compared to North Carolina state averages

Total nursing care / resident Info This home is ranked 11th out of 65 homes in North Carolina.

Total adjusted nursing hours per resident per day, combining RN, LPN, and aide time. CMS adjusts this for case-mix so facilities can be fairly compared.
5h 46m per day
Rank #11 / 65Nurse hours — State benchmarkedThis home is ranked 11th out of 65 homes in North Carolina.Shows adjusted nurse hours per resident per day benchmarked to the North Carolina average, with a ranking across 65 North Carolina SNFs. More hours mean more direct care. The national average is about 3.5 hrs; below 3.0 is a red flag.Click the rank badge to see the full State ranking.Click here to see the full State ranking.
This facility North Carolina avg (3h 59m per day)
vs North Carolina avg
+45%
Staff typeHours / Day / Residentvs state avg
Total Nursing (Weekend) Info Combined nursing hours (RN + LPN + Nurse Aide) per resident per day on weekends. Staffing often drops on weekends — this figure reveals whether the facility maintains adequate coverage outside of weekday hours. 5h 4m per day

Capacity and availability

This home usually has availability

Occupancy lower than 85% suggests more openings may be available.

Higher occupancy than the North Carolina average: 76.4%
Occupancy rate 83.1% Rank #24 / 70Occupancy rate — State benchmarkedThis home is ranked 24th out of 70 homes in North Carolina.Shows this facility's occupancy rate versus the North Carolina average, with its Statewide rank out of 70. Higher occupancy signals strong local demand and financial stability.Click the rank badge to see the full State ranking.Click here to see the full State ranking.
Avg. Length of Stay 53 days
Occupancy rate
83.1% Rank #24 / 70Occupancy rate — State benchmarkedThis home is ranked 24th out of 70 homes in North Carolina.Shows this facility's occupancy rate versus the North Carolina average, with its Statewide rank out of 70. Higher occupancy signals strong local demand and financial stability.Click the rank badge to see the full State ranking.Click here to see the full State ranking.
Avg. Length of Stay
53 days

Who this home usually serves

TYPE OF STAY

Mostly short-term rehab stays

Most residents typically stay for a few weeks or months before returning home or moving on.

Breakdown by payment type

Medicare

93% of new residents, usually for short-term rehab.

Typical stay 29 days

Private pay

5% of new residents, often for short stays.

Typical stay 2 years

Medicaid

2% of new residents, often for long-term daily care.

Typical stay 7 - 8 months

Finances and operations

Privately-owned community
Operated by a business corporation.
Home revenue
$35.3M
Profit
$2.0M
Privately-owned community Operated by a business corporation.
Home revenue
$35.3M Rank #15 / 72Revenue — State benchmarkedThis home is ranked 15th out of 72 homes in North Carolina.Shows this facility's annual revenue compared to the North Carolina SNF average. Higher revenue generally means more resources for staffing and capital — read alongside Payroll %.Click the rank badge to see the full State ranking.Click here to see the full State ranking.
Profit
$2.0M
Payroll costs Info The portion of the home's budget spent on staff, including nurses, caregivers, and other employees who support care and operations. Rank #11 / 72Payroll — State benchmarkedThis home is ranked 11th out of 72 homes in North Carolina.Shows total annual staff payroll benchmarked to the North Carolina average. Higher payroll investment relative to peers often signals better staffing and less reliance on cheaper contract labor.Click the rank badge to see the full State ranking.Click here to see the full State ranking.
$15.5M
44% of revenue Rank #38 / 72Payroll % — State benchmarkedThis home is ranked 38th out of 72 homes in North Carolina.Shows payroll as a percentage of revenue versus the North Carolina average. Well-run North Carolina SNFs typically land around 49–62% — the top third Statewide. Below 25% may signal understaffing or heavy agency use — read with Staffing ratings.Click the rank badge to see the full State ranking.Click here to see the full State ranking.
Other operating costs Info All remaining costs needed to run the home, such as food, utilities, building maintenance, supplies and administrative expenses.
$16.8M
Total costs $32.3M
Walk Score
Walk Score: 81 / 100 Rank #3 / 73Walk Score — State benchmarkedThis home is ranked 3rd out of 73 homes in North Carolina.Shows how walkable this facility's neighborhood is compared to the average Walk Score across North Carolina SNFs. Higher scores benefit residents, families, and staff.Click the rank badge to see the full State ranking.Click here to see the full State ranking.
Very walkable. Most errands can be accomplished on foot, and many essentials are within a short walk.

About this community

Therapy & Rehabilitation

3 services
Rehabilitation Services
Respite Care
Short-Term Rehab

Staffing & Medical

1 service
24-Hour Staffing

Additional Services

4 services
Inpatient Short Term Rehabilitation
Home Care
24/7 Skilled Nursing
Outpatient Physical Therapy

Dining & Nutrition

Food DescriptionHillcrest residents enjoy a variety of delicious and nutritious choices at every meal. There is also the option for special requests that cater to the unique needs, tastes and desires of our residents and guests.

Contact Hillcrest Convalescent Center

Financial Assistance for
Nursing Home in North Carolina

Hillcrest Convalescent Center is located in Durham, North Carolina.
Here are the financial assistance programs available to residents in North Carolina.

Get Financial aid guidance

Community Alternatives Program for Disabled Adults

NC Medicaid CAP/DA

Age 65+ or disabled
General North Carolina resident, Medicaid- eligible, nursing home-level care need.
Income Limits (2025) ~$2,829/month 300% FBR, individual
Asset Limits $2,000 (individual), $3,000 (couple).
NC

High demand; waitlists common in urban areas.

Benefits
Personal care (5-7 hours/day) Respite (240 hours/year) Adult day care ($60/day) Home modifications ($1,500 avg.)

North Carolina Senior Care Options

NC SCO (via NFCSP)

Age Caregiver of someone 60+ (or with dementia)
General North Carolina resident.
Income Limits No strict limit; prioritizes low-income.
Asset Limits Not applicable.
NC

Limited slots; rural/urban balance.

Benefits
In-home respite (4-6 hours/day) Adult day care (~$60/day) Short-term facility care (up to 5 days)

Program of All-Inclusive Care for the Elderly (PACE)

North Carolina PACE (e.g., PACE of the Triad)

Age 55+
General NC resident (specific counties), NFLOC, safe with PACE support.
Income Limits (2025) ~$2,829/month (Medicaid-eligible); private pay option available.
Asset Limits $2,000 (individual), $3,000 (couple) for Medicaid enrollees.
NC

Available in 10+ counties (e.g., Guilford, Wake); multiple providers (e.g., PACE of the Southern Piedmont).

Benefits
Personal care (5-7 hours/day) Medical care Meals Transportation Respite Therapies

In-Home Aide Services

North Carolina In-Home Aide Services

Age 60+
General NC resident, unable to perform 1+ ADL, at risk of nursing home placement.
Income Limits (2025) No strict cap; prioritizes low-income ~$24,980/year
Asset Limits Not assessed; need-based.
NC

Family can be aides; varies by county funding.

Benefits
Personal care (5-20 hours/week) Meal prep Respite (~5 days/year) Errands

Medicare Savings Program (MSP)

North Carolina Medicare Savings Program

Age 65+ or disabled
General NC resident, Medicare Part A/B.
Income Limits (2025) ~$2,510/month (QMB), ~$3,380/month (SLMB), ~$3,598/month (QI)—individual.
Asset Limits $9,430 (individual), $14,130 (couple).
NC

Three tiers; no waitlist; includes Extra Help for Part D.

Benefits
Covers Part B premiums ($174.70/month) Deductibles ($240/year) Copays (~20%)

VA Aid and Attendance (A&A) and Housebound Benefits

North Carolina VA Aid and Attendance/Housebound

Age 65+ or disabled veteran/spouse
General NC resident, wartime service, need for ADL help (A&A) or homebound.
Income Limits (2025) Net income < ~$1,984/month (veteran with dependent, A&A); pension offsets income.
Asset Limits ~$155,356 net worth limit
NC

High veteran demand in rural/urban areas.

Benefits
Cash (~$1,433-$2,642/month veteran, ~$951-$1,318 spouse) for care costs (e.g., in-home, assisted living)

Urgent Repair Program (URP)

North Carolina Urgent Repair Program

Age 60+ prioritized
General NC resident, homeowner, low-income.
Income Limits (2025) ~$30,258/year 50% AMI, varies by county
Asset Limits Not strictly assessed; home value considered.
NC

Forgivable at $2,000/year; statewide via local partners.

Benefits
Repairs (~$8,000-$12,000 avg.) for safety (e.g., roofs, heating, accessibility)

State/County Special Assistance (SA)

North Carolina Special Assistance

Age 65+ (or disabled)
General NC resident, in licensed adult care home, low-income.
Income Limits (2025) ~$1,255/month (individual, 100% FPL); varies by facility rate.
Asset Limits $2,000 individual
NC

Covers assisted living; counties supplement state funds.

Benefits
Cash (~$1,200-$1,500/month) for room/board; Medicaid covers care services

Staffing Data

Reporting period: April 1 – June 30, 2025 (Q2 2025). Source: CMS Payroll-Based Journal report.

Total staff 283
Employees 242
Contractors 41
Staff to resident ratio 3.82:1
107% better than North Carolina average
North Carolina average ratio: 1.85:1 North Carolina average ratio: 1.85:1See full North Carolina ranking
Avg staff/day 79
Average shift 7.5 hours
6% worse than North Carolina average
North Carolina average: 8 hours North Carolina average shift: 8 hoursSee full North Carolina ranking
Total staff hours (quarter) 54,010

Nursing staff breakdown

Q2 2025 · Apr 1 – Jun 30 More info This data comes from the CMS Payroll-Based Journal report covering April 1 – June 30, 2025.
Registered Nurse

Manages medical care and health needs.

Total count 28
Average shift length Info Average shift length. Calculated as total hours divided by days worked and average staff per day. 9.4 hours

This role is partially covered by contractors.

Licensed Practical Nurse

Assists with medical care and medications.

Total count 26
Average shift length Info Average shift length. Calculated as total hours divided by days worked and average staff per day. 9.1 hours

This role is partially covered by contractors.

Certified Nursing Assistant

Helps with daily care and mobility.

Total count 170
Average shift length Info Average shift length. Calculated as total hours divided by days worked and average staff per day. 7 hours

This role is partially covered by contractors.

Contractor staffing

Q2 2025 · Apr 1 – Jun 30 More info This data comes from the CMS Payroll-Based Journal report covering April 1 – June 30, 2025.

Total hours from contractors

1.3%

704 contractor hours this quarter

Certified Nursing Assistant: 29 Registered Nurse: 6 Licensed Practical Nurse: 4 Occupational Therapy Assistant: 2

Staff by category

Q2 2025 · Apr 1 – Jun 30 More info This data comes from the CMS Payroll-Based Journal report covering April 1 – June 30, 2025.
Certified Nursing Assistant1412917022,90291100%7
Registered Nurse226286,26891100%9.4
Licensed Practical Nurse224266,03191100%9.1
Respiratory Therapy Technician8082,8217380%7.5
Clinical Nurse Specialist5052,3847178%7.9
Physical Therapy Assistant6061,9517785%7.1
Physical Therapy Aide4041,6526470%7.3
Administrator3031,5606571%8
Qualified Social Worker4041,4426571%7.5
Speech Language Pathologist5051,2976470%6.4
Medication Aide/Technician120121,20191100%5.9
Mental Health Service Worker2029276470%7.6
Therapeutic Recreation Specialist2028846470%7.3
Other Dietary Services Staff2027648695%7.8
Occupational Therapy Assistant1236536571%6.7
Nurse Practitioner1015016369%7.9
Dietitian1014966268%8
Occupational Therapy Aide1012803538%8
170 Certified Nursing Assistant
% of Days 100%
28 Registered Nurse
% of Days 100%
26 Licensed Practical Nurse
% of Days 100%
8 Respiratory Therapy Technician
% of Days 80%
5 Clinical Nurse Specialist
% of Days 78%
6 Physical Therapy Assistant
% of Days 85%
4 Physical Therapy Aide
% of Days 70%
3 Administrator
% of Days 71%
4 Qualified Social Worker
% of Days 71%
5 Speech Language Pathologist
% of Days 70%
12 Medication Aide/Technician
% of Days 100%
2 Mental Health Service Worker
% of Days 70%
2 Therapeutic Recreation Specialist
% of Days 70%
2 Other Dietary Services Staff
% of Days 95%
3 Occupational Therapy Assistant
% of Days 71%
1 Nurse Practitioner
% of Days 69%
1 Dietitian
% of Days 68%
1 Occupational Therapy Aide
% of Days 38%

Facility Characteristics

Source: CMS Long-Term Care Facility Characteristics (Data as of Jan 2026)

Total residents 74
Medicare
62
83.8% of residents
Medicaid
6
8.1% of residents
Private pay or other
6
8.1% of residents
Programs & Services
Residents Group

Residents meet regularly to discuss policies, care quality, and activities

Nurse Aide Training

State-approved Nurse Aide Training and Competency Evaluation Program on-site

Active Resident Council

Organized group of residents that meets regularly to discuss facility policies, quality of life, and activities.

Quality of care over time

These measures show how residents usually do over time at this home, based on health outcomes and preventive care.

High-risk clinical events score Info A composite score based on pressure ulcers, falls with injury, weight loss, walking ability decline, and activities of daily living decline. 13.9
21% worse than North Carolina average

North Carolina average: 11.5

Functional decline score Info A composite score based on activities of daily living decline, walking ability decline, and incontinence. 25.5
23% worse than North Carolina average

North Carolina average: 20.6

Long-stay resident measures
Need for Help with Daily Activities Increased Info Percent of long-stay residents whose need for help with daily activities has increased 15.5%
12% better than North Carolina average

North Carolina average: 17.5%

Low Risk Residents with Bowel/Bladder Incontinence Info Percent of low risk long-stay residents who lose control of their bowels or bladder 35.4%
65% worse than North Carolina average

North Carolina average: 21.4%

Falls with Major Injury Info Percent of long-stay residents experiencing one or more falls with major injury 6.2%
69% worse than North Carolina average

North Carolina average: 3.6%

High Risk Residents with Pressure Ulcers Info Percent of long-stay high risk residents with pressure ulcers 17.1%
171% worse than North Carolina average

North Carolina average: 6.3%

Urinary Tract Infection Info Percent of long-stay residents with a urinary tract infection 0.0%
100% better than North Carolina average

North Carolina average: 2.6%

Lost Too Much Weight Info Percent of long-stay residents who lose too much weight 16.7%
126% worse than North Carolina average

North Carolina average: 7.4%

Depressive Symptoms Info Percent of long-stay residents who have depressive symptoms 0.0%
100% better than North Carolina average

North Carolina average: 4.4%

Antipsychotic Use Info Percent of long-stay residents who received an antipsychotic medication 14.8%
10% worse than North Carolina average

North Carolina average: 13.4%

Pneumococcal Vaccine Info Percent of long-stay residents assessed and appropriately given the pneumococcal vaccine 95.1%
In line with North Carolina average

North Carolina average: 91.6%

Influenza Vaccine Info Percent of long-stay residents assessed and appropriately given the seasonal influenza vaccine 85.7%
9% worse than North Carolina average

North Carolina average: 94.1%

Short-stay resident measures
Pneumococcal Vaccine Info Percent of short-stay residents assessed and appropriately given the pneumococcal vaccine 98.3%
23% better than North Carolina average

North Carolina average: 79.9%

Antipsychotic medication increase Info Percent of short-stay residents who newly received an antipsychotic medication 2.9%
95% worse than North Carolina average

North Carolina average: 1.5%

Influenza Vaccine Info Percent of short-stay residents assessed and appropriately given the seasonal influenza vaccine 91.4%
17% better than North Carolina average

North Carolina average: 78.1%

Penalties and fines

Federal penalties imposed by CMS for regulatory violations, including civil money penalties (fines) and denials of payment for new Medicare/Medicaid admissions.

Source: CMS Penalties Database

No penalties in the past 3 years

No civil money penalties or payment denials were reported in the last 3 years.

Compare Nursing Home around Durham

The information below is reported by the North Carolina Department of Health and Human Services, Division of Health Service Regulation.

2 facilities compared · CMS & NC Dept. of Health data

Filter by care type
Hillcrest Convalescent Center
NH

Nursing Home Licensed facility providing 24/7 skilled nursing care for residents with complex, ongoing medical needs. Staffed by RNs, LPNs, and CNAs. Inspected and star-rated annually by CMS. Accepts Medicare (short-term rehab) and Medicaid (long-term care).

AL

Assisted Living A licensed, long-term care setting for seniors or individuals with disabilities who need help with daily activities — like bathing, dressing, and medication management — but not 24-hour skilled nursing. Offers housing, meals, and around-the-clock support while aiming to maximize resident independence.

Durham154 83.1% +9%5.76 +10%+45%$0---80 81 William Hoover$35.3M$15.5M44%345001
Atria Southpoint Walk
NH

Nursing Home Licensed facility providing 24/7 skilled nursing care for residents with complex, ongoing medical needs. Staffed by RNs, LPNs, and CNAs. Inspected and star-rated annually by CMS. Accepts Medicare (short-term rehab) and Medicaid (long-term care).

AL

Assisted Living A licensed, long-term care setting for seniors or individuals with disabilities who need help with daily activities — like bathing, dressing, and medication management — but not 24-hour skilled nursing. Offers housing, meals, and around-the-clock support while aiming to maximize resident independence.

IL

Independent Living Lifestyle-focused communities for older adults offering dining, activities, and transportation with minimal personal care. Best for active, independent seniors who want community without medical support.

Durham (Crooked Creek)20 93.4% +22%3.26 -15%-18%$220.0k394.96123 59 Donald Joseph$18.3M$7.3M40%345408

Guides for Better Senior Living

Care Cost Calculator: See Prices in Your Area

Nursing Home Data Explorer

Don’t Wait Too Long: 7 Red Flag Signs Your Parent Needs Assisted Living Now

The True Cost of Assisted Living in 2025 – And How Families Are Paying For It

Understanding Senior Living Costs: Pricing Models, Discounts & Financial Assistance

Frequently Asked Questions about Hillcrest Convalescent Center

Is Hillcrest Convalescent Center in a walkable area?

Hillcrest Convalescent Center has a walk score of 81. Very walkable. Most errands can be accomplished on foot, and many essentials are within a short walk.

What is the occupancy rate at Hillcrest Convalescent Center?

Hillcrest Convalescent Center's occupancy is 83.1%.

Are there photos of Hillcrest Convalescent Center?

Yes — there is 1 photo of Hillcrest Convalescent Center in the photo gallery on this page.

What is the phone number of Hillcrest Convalescent Center?

(919) 286-7705 will put you in contact with the team at Hillcrest Convalescent Center.

Is Hillcrest Convalescent Center Medicare or Medicaid certified?

Yes — Hillcrest Convalescent Center is a CMS-certified provider of Medicare and Medicaid.

Explore Open Rooms
1 Contact details
2 What type of senior care service are you looking for?
3 What budget do you have in mind for senior care?
4 How soon do you need to find care?
5 Additional details

Thank you for your interest!

Our team will be in touch shortly to help with next steps.