Explore Open Rooms

1 Contact details
2 What type of senior care service are you looking for?
3 What budget do you have in mind for senior care?
4 How soon do you need to find care?
5 Additional details

Thank you for your interest!

Our team will be in touch shortly to help with next steps.

Senior Living in Frederick

CMS overall rating Info The Overall CMS Rating combines results from health inspections, staffing levels and quality measures. Health inspections carry the most weight. Staffing and quality scores can increase or decrease the final rating based on performance compared to state and national standards.

Homewood Living Frederick

7407 Willow Rd, Frederick, MD 21702 View map
Overview of Homewood Living Frederick

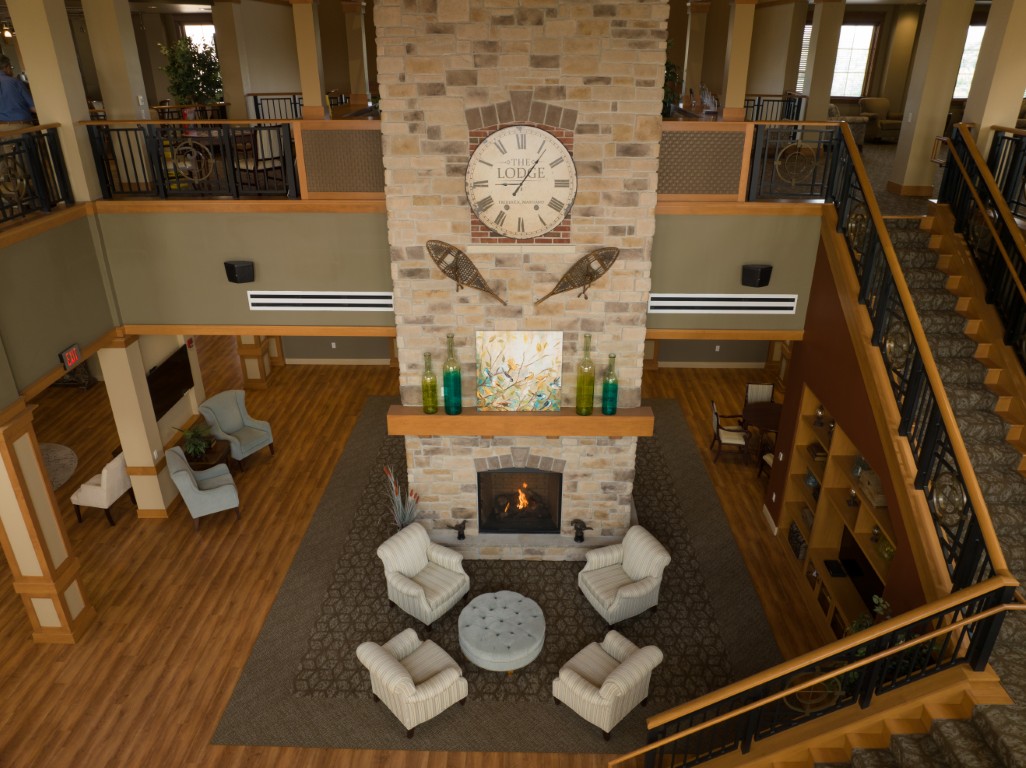
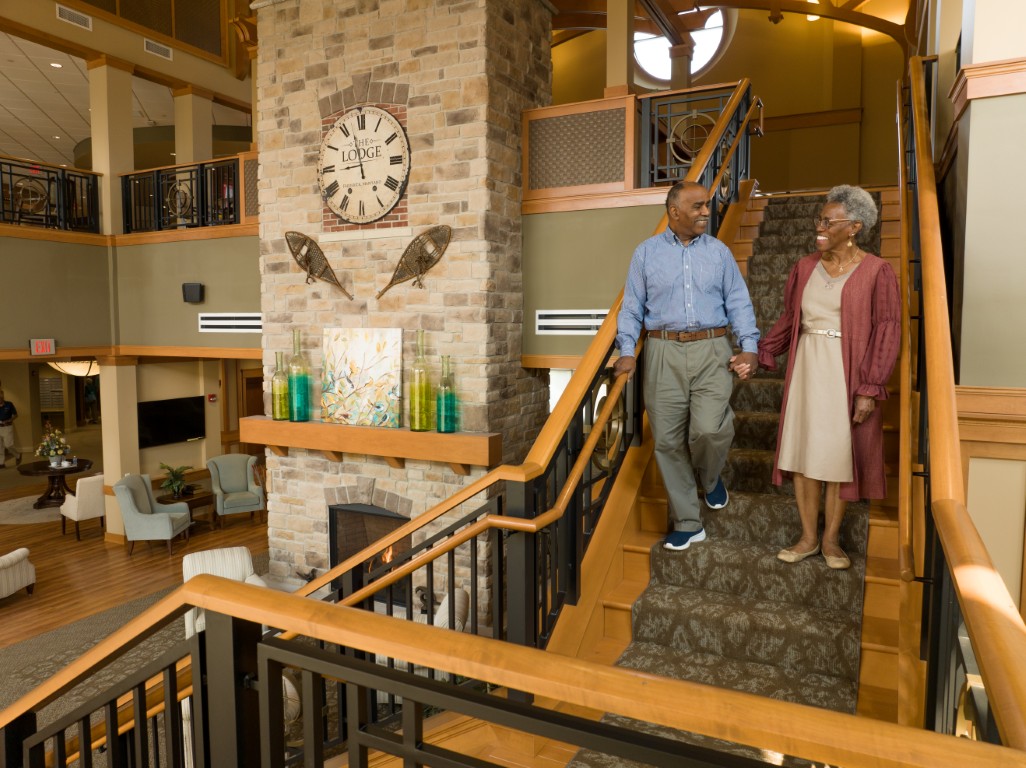
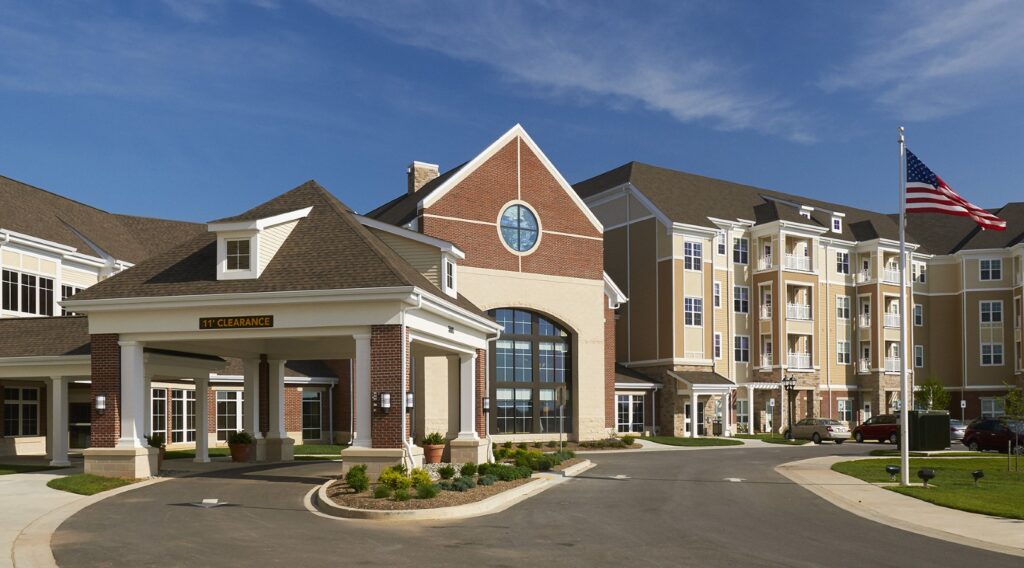
Enjoy your golden years at Homewood Living Frederick, a blissful retreat set in the vibrant neighborhood of Frederick, MD, offering independent living. With a variety of beautifully furnished and cozy accommodations, residents can rest assured of living comfortably in retirement. The community also promotes a hassle-free lifestyle, helping with chores and maintenance.

Residents will not run out of things to do, with plenty of recreation sites and unique local shops in the area. Delightful restaurants provide residents with a variety of dining options that satisfy their dietary needs and preferences. With its vibrant and welcoming environment, residents are guaranteed to flourish in retirement.

Quality ratings

Measured by Centers for Medicare & Medicaid Services (CMS)

Overall rating Info The Overall CMS Rating combines results from health inspections, staffing levels and quality measures. Health inspections carry the most weight. Staffing and quality scores can increase or decrease the final rating based on performance compared to state and national standards.
5/5
Maryland average: 3.0/5
Health Inspection Info Based on the results of the facility's three most recent standard inspections and any complaint investigations. CMS reviews the number, scope, and severity of deficiencies, with more recent findings weighted more heavily.
4/5
Maryland average: 2.8/5
Staffing Info Measures average nursing staff hours per resident per day, including Registered Nurses (RNs) and total nursing staff. Ratings are adjusted based on the level of care residents require and are compared to state and national benchmarks.
5/5
Maryland average: 3.0/5
Quality Measures Info Based on clinical and physical health indicators reported to CMS, such as hospital readmissions, falls, pressure ulcers, and improvements in mobility. These measures reflect how well residents' health needs are being managed.
5/5
Maryland average: 3.7/5

Nursing care per resident

Info This shows how many total hours of nursing staff time are available per resident each day. Higher numbers usually mean more staff support.
4h 15m per day

This home provides 13% more nursing time per resident than the Maryland average.

Maryland average: 3h 46m per day

Capacity and availability

Medium-capacity home

Offers a balance of services and community atmosphere.

Total beds 190

This home usually has availability

Lower occupancy suggests more openings may be available.

Lower demand than the Maryland average
Occupancy rate 72.3%
Residents per day (avg) 84
Occupancy rate
72.3%
Residents per day (avg)
84

Who this home usually serves

TYPE OF STAY

Mostly short-term rehab stays

Most residents typically stay for a few weeks or months before returning home or moving on.

Might be optimal for
Short stays Recovery Medicare-covered care

Breakdown by payment type

Medicare

83% of new residents, usually for short-term rehab.

Typical stay 1 months

Private pay

17% of new residents, often for short stays.

Typical stay 3 years

Finances and operations

Voluntary non-profit community
Operated by a church.
Home revenue
$46.7M
Surplus of revenue
$4.3M
Voluntary non-profit community Operated by a church.
Home revenue
$46,727,003.00
Surplus of revenue
$4,298,189.00
Payroll costs Info The portion of the home's budget spent on staff, including nurses, caregivers, and other employees who support care and operations.
$12.4M
26.4% of revenue
Other operating costs Info All remaining costs needed to run the home, such as food, utilities, building maintenance, supplies and administrative expenses.
$30.1M
Total costs $42.4M
Walk Score
Walk Score: 14 / 100
Car-dependent. Most errands require a car, with limited nearby walkable options.

About this community

Safety & Compliance

Wheelchair Accessible
Emergency Systems: Yes

Care Services

Nursing Services
Rehabilitation Services
Respite Care
Memory Care
Independent Living
Skilled Nursing
24-Hour Staffing

Dining & Nutrition

Food Description
Dining options include four on-campus venues with meals prepared fresh daily, offering gluten-free, dairy-free, and low-fat options.
Meals Included
Yes
Special Diets
Yes

What does this home offer?

Pets allowed icon
Pets allowed icon

Pets Allowed: Yes, Pets Allowed

Housing options icon

Housing Options: 1 Bed / 2 Bed

Building type icon
Building type icon

Building Type: 2-story

Dining services icon

Dining Services

Beauty services icon

Beauty Services

Social and recreational activities icon

Social and Recreational Activities

Exercise program icon

Exercise Programs

Types of Care at Homewood Living Frederick

Independent Living
Contact Homewood Living Frederick

Health Inspection History

Inspections
Total health inspections 3

Maryland average 3.9


Last Health inspection on Jul 2025

Total health citations 19

Maryland average 49.9

Citations per inspection
6.33

Maryland average 12.81


Health citations are formal notices following inspections when they fail to comply with safety and care standards.

All 19 citations resulted from standard inspections.

Breakdown of citation severity (last 3 years)
Critical Health citations More info 0
100% better than Maryland average

Maryland average: 0.5


Serious Health citations More info 0
100% better than Maryland average

Maryland average: 0.6

0 critical citations More info Maryland average: 0.5

0 serious citations More info Maryland average: 0.6

19 moderate citations More info Maryland average: 47.2

0 minor citations More info Maryland average: 1.7
Citations history (last 3 years)
Environmental moderate citation Info Issues related to building safety, cleanliness, maintenance, and overall living conditions. Jul 22, 2025
Corrected

Infection Control moderate citation Info Issues related to preventing and controlling infections, including hygiene practices and safety protocols. Jul 22, 2025
Corrected

Infection Control moderate citation Info Issues related to preventing and controlling infections, including hygiene practices and safety protocols. Jul 15, 2022
Corrected

Pharmacy moderate citation Info Issues related to medication management, including how drugs are stored, administered, and monitored. Jul 15, 2022
Corrected

Compare Senior Living around Frederick The information below is reported by the Maryland Department of Health, Office of Health Care Quality.

Filter by care type
Homewood Living Frederick
NH

Nursing Home Licensed facility providing 24/7 skilled nursing care for residents with complex, ongoing medical needs. Staffed by RNs, LPNs, and CNAs. Inspected and star-rated annually by CMS. Accepts Medicare (short-term rehab) and Medicaid (long-term care).

IL

Independent Living Lifestyle-focused communities for older adults offering dining, activities, and transportation with minimal personal care. Best for active, independent seniors who want community without medical support.

Frederick
190
Yes
14
1 Bed / 2 Bed
Foundry Square
IL

Independent Living Lifestyle-focused communities for older adults offering dining, activities, and transportation with minimal personal care. Best for active, independent seniors who want community without medical support.

Frederick
-
Yes
91
1 Bed / 2 Bed
Sharpe Square Senior Apartments
IL

Independent Living Lifestyle-focused communities for older adults offering dining, activities, and transportation with minimal personal care. Best for active, independent seniors who want community without medical support.

Frederick
-
No
88
1 Bed / 2 Bed
The Cascades of Frederick
IL

Independent Living Lifestyle-focused communities for older adults offering dining, activities, and transportation with minimal personal care. Best for active, independent seniors who want community without medical support.

Frederick (Carrollton)
-
Yes
54
1 Bed / 2 Bed
The Lodge at Willow Ponds
IL

Independent Living Lifestyle-focused communities for older adults offering dining, activities, and transportation with minimal personal care. Best for active, independent seniors who want community without medical support.

Frederick
-
Yes
93
1 Bed / 2 Bed

Places of interest near Homewood Living Frederick

Address 7 miles from city center
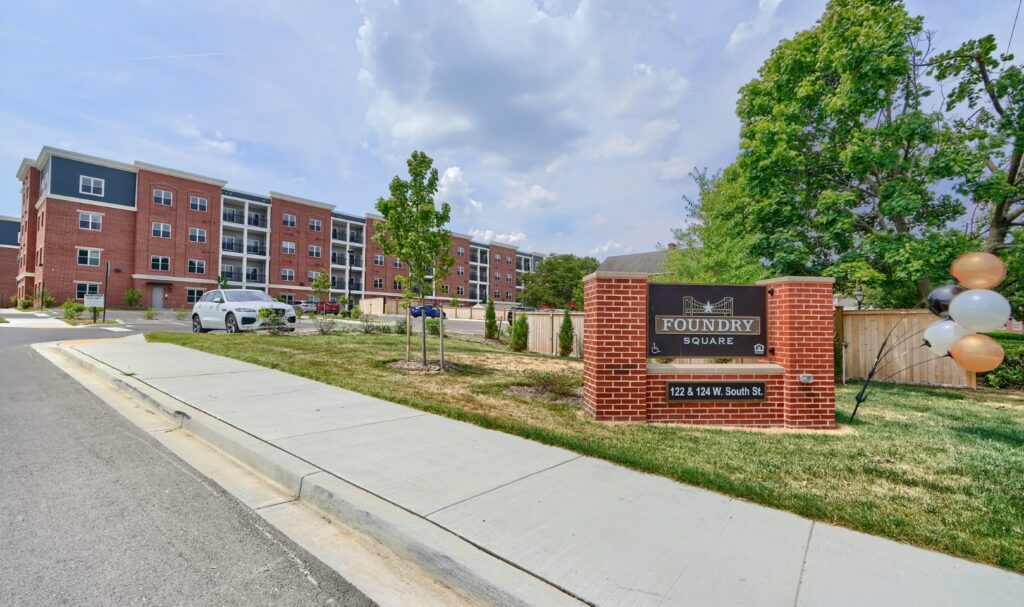
Address 7407 Willow Rd, Frederick, MD 21702

Calculate Travel Distance to Homewood Living Frederick

Add your location

Address

Staffing Data (Q2 2025)

This data corresponds to Q2 2025 and is based on CMS Payroll-Based Journal.

Total staff 195
Employees 99
Contractors 96
Staff to resident ratio 2.41:1
33% better than Maryland average

Maryland average ratio: 1.81:1

Avg staff/day 59
Average shift 7.3 hours
9% worse than Maryland average

Maryland average: 8 hours

Total staff hours (quarter) 39,063
Nursing staff breakdown
Registered Nurse

Manages medical care and health needs.

Total count 20
Average shift length Info Average shift length. Calculated as total hours divided by days worked and average staff per day. 8.5 hours

This role is partially covered by contractors.

Licensed Practical Nurse

Assists with medical care and medications.

Total count 32
Average shift length Info Average shift length. Calculated as total hours divided by days worked and average staff per day. 7.7 hours

This role is partially covered by contractors.

Certified Nursing Assistant

Helps with daily care and mobility.

Total count 93
Average shift length Info Average shift length. Calculated as total hours divided by days worked and average staff per day. 7.6 hours

This role is partially covered by contractors.

Contractor staffing

Total hours from contractors

15.9%

6,199 contractor hours this quarter

Certified Nursing Assistant: 51 Licensed Practical Nurse: 16 Registered Nurse: 5 Physical Therapy Assistant: 5 Respiratory Therapy Technician: 5 Speech Language Pathologist: 4 Qualified Social Worker: 4 Physical Therapy Aide: 3 Medical Director: 1 Occupational Therapy Assistant: 1 Diagnostic X-ray Services Staff: 1
Staff by category
Certified Nursing Assistant42519315,24491100%7.6
Licensed Practical Nurse1616327,13791100%7.7
Registered Nurse155204,32891100%8.5
Other Dietary Services Staff100103,1078088%6.3
Medication Aide/Technician4041,8528695%11.1
Clinical Nurse Specialist5051,5717684%7.3
Physical Therapy Assistant0559177582%6.5
Mental Health Service Worker3036706268%6.6
Speech Language Pathologist0446547481%3.6
Physical Therapy Aide0335816571%4.5
Qualified Social Worker0445147582%5.5
Nurse Practitioner1015046369%8
Respiratory Therapy Technician0554987785%3.6
Administrator1014966268%8
Occupational Therapy Aide1014806268%7.7
RN Director of Nursing1014305560%7.8
Occupational Therapy Assistant01158910%6.4
Medical Director011211516%1.4
Diagnostic X-ray Services Staff011233%0.6
93 Certified Nursing Assistant
% of Days 100%
32 Licensed Practical Nurse
% of Days 100%
20 Registered Nurse
% of Days 100%
10 Other Dietary Services Staff
% of Days 88%
4 Medication Aide/Technician
% of Days 95%
5 Clinical Nurse Specialist
% of Days 84%
5 Physical Therapy Assistant
% of Days 82%
3 Mental Health Service Worker
% of Days 68%
4 Speech Language Pathologist
% of Days 81%
3 Physical Therapy Aide
% of Days 71%
4 Qualified Social Worker
% of Days 82%
1 Nurse Practitioner
% of Days 69%
5 Respiratory Therapy Technician
% of Days 85%
1 Administrator
% of Days 68%
1 Occupational Therapy Aide
% of Days 68%
1 RN Director of Nursing
% of Days 60%
1 Occupational Therapy Assistant
% of Days 10%
1 Medical Director
% of Days 16%
1 Diagnostic X-ray Services Staff
% of Days 3%

Facility Characteristics

Source: CMS Long-Term Care Facility Characteristics (Data as of Jan 2026)

Total census
81 residents
Residents by payment source
Medicare
14 residents (17.3%)
Medicaid
16 residents (19.8%)
Private pay or other
51 residents (63%)
Programs & Services
Residents' Group

Residents meet regularly to discuss policies, care quality, and activities

CCRC

Part of a Continuing Care Retirement Community offering multiple care levels

Active Resident Council

Organized group of residents that meets regularly to discuss facility policies, quality of life, and activities.

Quality of care over time

These measures show how residents usually do over time at this home, based on health outcomes and preventive care.

High-risk clinical events score Info A composite score based on pressure ulcers, falls with injury, weight loss, walking ability decline, and activities of daily living decline. 19.5
50% worse than Maryland average

Maryland average: 12.9

Functional decline score Info A composite score based on activities of daily living decline, walking ability decline, and incontinence. 38.8
51% worse than Maryland average

Maryland average: 25.7

Long-stay resident measures
Need for Help with Daily Activities Increased Info Percent of long-stay residents whose need for help with daily activities has increased 45.7%
93% worse than Maryland average

Maryland average: 23.7%

Walking Ability Worsened Info Percent of long-stay residents whose ability to move independently worsened 34.4%
24% worse than Maryland average

Maryland average: 27.7%

Low Risk Residents with Bowel/Bladder Incontinence Info Percent of low risk long-stay residents who lose control of their bowels or bladder 36.3%
40% worse than Maryland average

Maryland average: 25.9%

Falls with Major Injury Info Percent of long-stay residents experiencing one or more falls with major injury 5.4%
135% worse than Maryland average

Maryland average: 2.3%

High Risk Residents with Pressure Ulcers Info Percent of long-stay high risk residents with pressure ulcers 7.4%
13% worse than Maryland average

Maryland average: 6.5%

Urinary Tract Infection Info Percent of long-stay residents with a urinary tract infection 2.0%
24% worse than Maryland average

Maryland average: 1.6%

Lost Too Much Weight Info Percent of long-stay residents who lose too much weight 4.5%
23% better than Maryland average

Maryland average: 5.8%

Depressive Symptoms Info Percent of long-stay residents who have depressive symptoms 0.8%
96% better than Maryland average

Maryland average: 20.2%

Antipsychotic Use Info Percent of long-stay residents who received an antipsychotic medication 6.5%
50% better than Maryland average

Maryland average: 12.9%

Pneumococcal Vaccine Info Percent of long-stay residents assessed and appropriately given the pneumococcal vaccine 96.9%
5% better than Maryland average

Maryland average: 92.0%

Influenza Vaccine Info Percent of long-stay residents assessed and appropriately given the seasonal influenza vaccine 100.0%
In line with Maryland average

Maryland average: 96.6%

Short-stay resident measures
Pneumococcal Vaccine Info Percent of short-stay residents assessed and appropriately given the pneumococcal vaccine 88.6%
13% better than Maryland average

Maryland average: 78.4%

Antipsychotic medication increase Info Percent of short-stay residents who newly received an antipsychotic medication 0.0%
100% better than Maryland average

Maryland average: 1.4%

Influenza Vaccine Info Percent of short-stay residents assessed and appropriately given the seasonal influenza vaccine 95.0%
18% better than Maryland average

Maryland average: 80.6%

Guides for Better Senior Living

Care Cost Calculator: See Prices in Your Area

Nursing Home Data Explorer

Don’t Wait Too Long: 7 Red Flag Signs Your Parent Needs Assisted Living Now

The True Cost of Assisted Living in 2025 – And How Families Are Paying For It

Understanding Senior Living Costs: Pricing Models, Discounts & Financial Assistance

Financial Aid for Maryland Seniors

Get financial aid guidance

Community Options Waiver

Maryland Medicaid Community Options Waiver

Age 65+ or disabled, Maryland resident, Medicaid- eligible, nursing home-level care need.

~$2,829/month (300% FBR, individual).

$2,000 (individual), $3,000 (couple) (excludes home, car).

High urban demand; rural outreach efforts.

Senior Care Program

Maryland Senior Care

Age 65+, Maryland resident, at risk of nursing home placement.

~$2,000/month (individual, varies by county).

$11,000 (individual).

Limited funding; waitlists common in high-demand areas.

Maryland Nursing Home Medicaid

Maryland Medical Assistance (Medicaid) Nursing Home Program

Age 65+, Maryland resident, Medicaid-eligible, requires nursing home-level care.

$943/month (individual); most income applied to care costs.

$2,500 (individual), $3,000 (couple); spousal protections up to $155,356.

Home equity limit $636,000; estate recovery applies post-55.

Senior Assisted Living Subsidy Program

Maryland Senior Assisted Living Group Home Subsidy

Age 62+, Maryland resident, in or moving to approved assisted living, low/moderate income.

~$34,000/year (individual, varies by county).

Not strict; prioritizes low-income.

Not available statewide; facility must be licensed by MDH.

Veterans Aid and Attendance (A&A) Benefit

Maryland VA Aid and Attendance

Wartime veteran/spouse, age 65+ or disabled, needs ADL help, Maryland resident.

Net income minus medical expenses < $1,984/month (individual with A&A).

$155,356 (net worth limit).

High veteran population in suburban/rural areas.

Senior Prescription Drug Assistance Program (SPDAP)

Maryland Senior Prescription Drug Assistance Program

Age 65+, Maryland resident (6+ months), Medicare Part D enrolled.

$48,560/year (individual, 300% FPL).

None specified.

Supplements Medicare Part D; annual enrollment required.

Medicare Savings Programs (MSP)

Maryland Medicare Savings Programs

Age 65+, Maryland resident, Medicare Part A/B enrollee.

$2,014/month (QMB), $2,706/month (SLMB/QI, individual).

$9,090 (individual), $13,630 (couple).

Includes QMB, SLMB, QI categories.

Community Personal Assistance Services (CPAS)

Maryland Medicaid Community Personal Assistance Services

Age 65+, Maryland resident, Medicaid-eligible, needs ADL assistance.

$943/month (individual); spend-down available.

$2,500 (individual), $3,000 (couple).

Consumer-directed option allows hiring family caregivers.

Tour Icon
Planning a tour? Check our touring checklist.
Chat Icon
Thinking of living here? We can help you speak to a current resident