Best Senior Living in Frederick, MD

Why trust this guide? Our editorial team analyzed 18 senior living communities in Frederick, MD using MD Dept. of Health (OHCQ) data, inspection records, complaints, amenities, and facility-level details. How we rank senior living in MD
Reviewed by
Last updated
We analyzed These are the facilities in Frederick, MD our team has analyzed — not a count of every senior living provider in Frederick, MD.
18 homes
Other senior care options in Frederick:

Compare Senior Living around Frederick

Info below is compiled from the MD Dept. of Health (OHCQ), senior community websites & trusted data sources such as Walk Score & BBB.

Communities are listed from highest-ranked to lowest-ranked based on our methodology.

Care Types in This Table AL (Assisted Living): Housing with help for daily activities like bathing, dressing, and medication, without 24-hour skilled nursing. NH (Nursing Home): 24/7 skilled nursing care for residents with complex, ongoing medical needs. SNF (Skilled Nursing Facility): Round-the-clock nursing care, often for recovery after surgery, injury, or illness. MC (Memory Care): Secured, specialized care for people living with Alzheimer's or dementia. RC (Respite Care): Short-term temporary care that gives family caregivers a break. IL (Independent Living): Community living with dining, activities, and transportation for active seniors who need little personal care. HOS (Hospice Care): Comfort-focused care for those with a terminal illness, prioritizing quality of life over treatment.
City and state of the facility. Used for mapping and state-average comparisons.
Licensed bed capacity (maximum allowed). Not the same as how many beds are currently filled.
Indicates whether residents are allowed to have pets in the facility.
Third-party neighborhood walkability score (0–100). Convenience/context metric, not a healthcare quality measure.
Description of bed or unit types offered (e.g. assisted living, memory care), as reported in state or facility disclosures.
Number of years the company has been in operation.
Better Business Bureau grade for the operating company. Reflects complaint handling and business practices, not clinical care quality.
Percentage of residents reported as male in state demographics, shown as a whole-number percent.
Percentage of residents reported as female in state demographics, shown as a whole-number percent.
Share of residents reported as White in the state-published race/ethnicity breakdown for this facility, shown as a whole-number percent. Parsed from the same source as the profile demographics section.
Share of residents reported as African American or Black in the state breakdown, shown as a whole-number percent. Labels in the raw data are normalized to this bucket for compare.
Combined share of all race/ethnicity groups that are not classified as White or African American (e.g. Hispanic, Asian, multiracial, and other labeled categories), summed to a single whole-number percent.
Share of residents aged 65–74 in reported demographics, as a whole-number percentage of residents.
Share of residents aged 75–84 in reported demographics, as a whole-number percentage of residents.
Share of residents aged 85–94 in reported demographics, as a whole-number percentage of residents.
Share of residents aged 95 or older in reported demographics, as a whole-number percentage of residents.
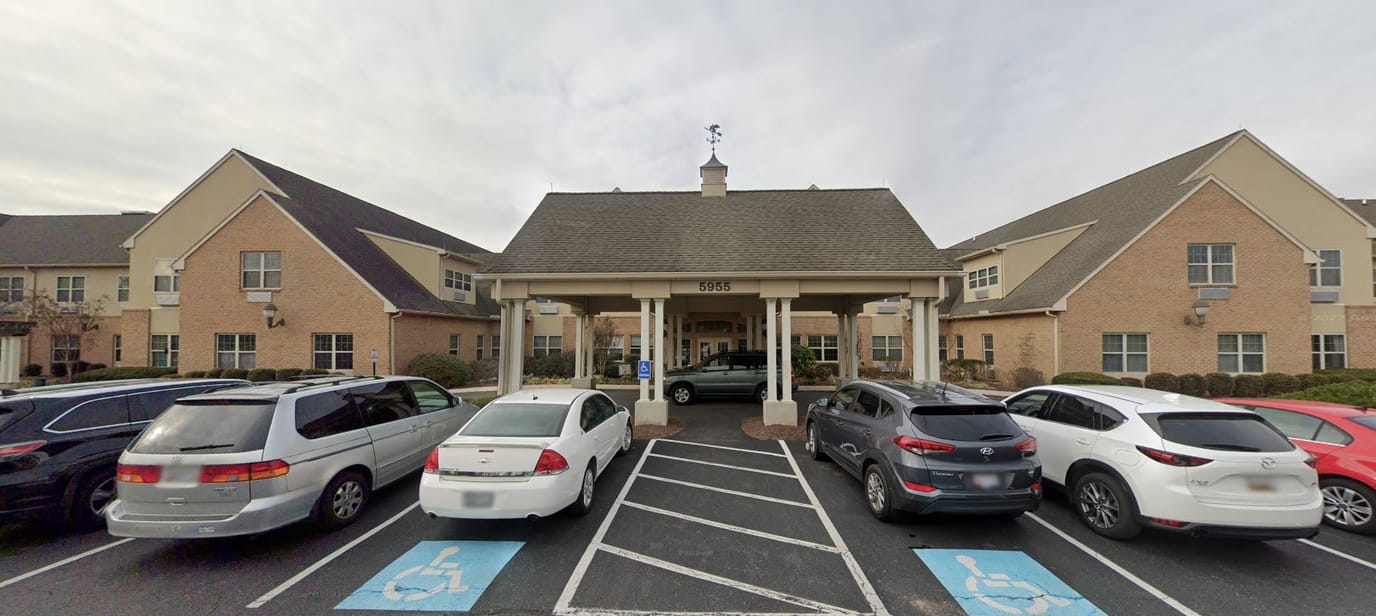
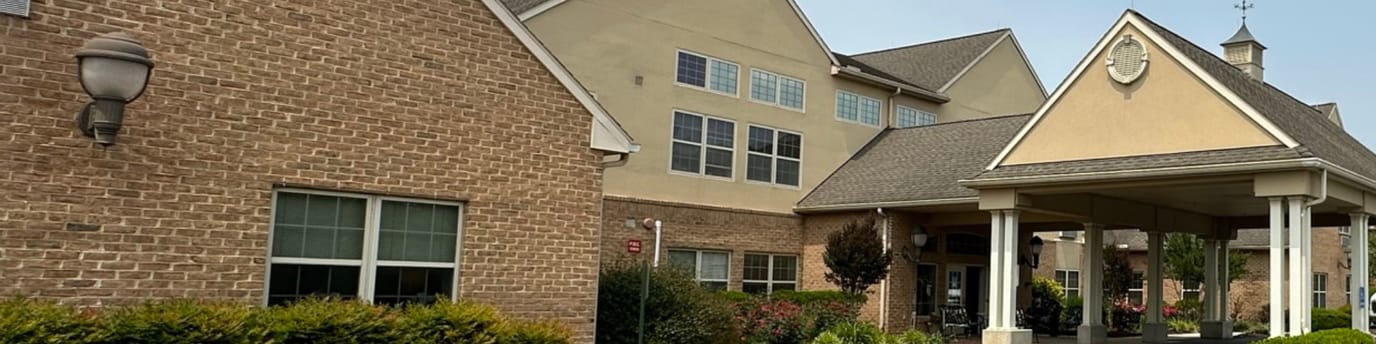
Country Meadows of Frederick
IL
AL
HOS
MC
NH
RC
SNF
Frederick (Tulip Hill)
160
Facility 160
MD AVG 86
Rank #7 / 74
Yes
12
Facility 12
MD AVG 49
Rank #152 / 169
Private Rooms
24
Facility 24
MD AVG 24
Rank #23 / 45
-
33%

Male Residents — State Benchmarked 33% of residents are male, compared to the Maryland average of 31%. This facility caters to a majority female resident pool (67% female), consistent with the broader assisted living trend where women significantly outnumber men.

67%

Female Residents — State Benchmarked 67% of residents are female, compared to the Maryland average of 69%. Women comprise the large majority, consistent with national assisted living demographics where women live longer and enter care facilities at higher rates.

97%

White Residents — State Benchmarked 97% of residents are reported as White, compared to the Maryland average of 81%. A higher White share than is typical for assisted living in Maryland in this dataset — compare with peer facilities for local context.

0%

African American Residents — State Benchmarked 0% of residents are reported as African American or Black, compared to the Maryland average of 13%. A lower African American share than is typical in Maryland; local markets still vary widely.

3%

Other Ethnicity Residents — State Benchmarked 3% of residents fall into categories other than White or African American (combined), compared to the Maryland average of 6%. This column aggregates Hispanic, Asian, multiracial, and any other labeled groups that are not classified as White or African American. Reported subgroups in this total: Hispanic (2%), Asian (1%).

6%

Residents Age 65–74 — State Benchmarked 6% of residents are 65–74, compared to the Maryland average of 13%. Fewer younger seniors suggests the resident population skews older, likely requiring higher acuity care and more hands-on support.

19%

Residents Age 75–84 — State Benchmarked 19% of residents are 75–84, compared to the Maryland average of 31%. Below the state norm — the resident mix may skew either younger or older than this typical middle bracket.

59%

Residents Age 85–94 — State Benchmarked 59% of residents are 85–94, compared to the Maryland average of 44%. A high concentration of very elderly residents signals a higher-acuity facility with experience caring for advanced age-related needs.

15%

Residents Age 95+ — State Benchmarked 15% of residents are 95 or older, compared to the Maryland average of 16%. In line with the statewide profile for the oldest resident bracket.

Sunrise of Frederick
IL
AL
MC
Frederick
88 Yes 62 Studio / Suite / 2 Bed 45 A-
31%

Male Residents — State Benchmarked 31% of residents are male, compared to the Maryland average of 31%. This facility caters to a majority female resident pool (69% female), consistent with the broader assisted living trend where women significantly outnumber men.

69%

Female Residents — State Benchmarked 69% of residents are female, compared to the Maryland average of 69%. Women comprise the large majority, consistent with national assisted living demographics where women live longer and enter care facilities at higher rates.

97%

White Residents — State Benchmarked 97% of residents are reported as White, compared to the Maryland average of 81%. A higher White share than is typical for assisted living in Maryland in this dataset — compare with peer facilities for local context.

2%

African American Residents — State Benchmarked 2% of residents are reported as African American or Black, compared to the Maryland average of 13%. A lower African American share than is typical in Maryland; local markets still vary widely.

2%

Other Ethnicity Residents — State Benchmarked 2% of residents fall into categories other than White or African American (combined), compared to the Maryland average of 6%. This column aggregates Hispanic, Asian, multiracial, and any other labeled groups that are not classified as White or African American. Reported subgroups in this total: Hispanic (2%).

10%

Residents Age 65–74 — State Benchmarked 10% of residents are 65–74, compared to the Maryland average of 13%. Fewer younger seniors suggests the resident population skews older, likely requiring higher acuity care and more hands-on support.

34%

Residents Age 75–84 — State Benchmarked 34% of residents are 75–84, compared to the Maryland average of 31%. This is the second most common age bracket in assisted living, representing residents with moderate care needs.

48%

Residents Age 85–94 — State Benchmarked 48% of residents are 85–94, compared to the Maryland average of 44%. This is typically the most common age bracket in assisted living — this facility is in line with the statewide norm.

6%

Residents Age 95+ — State Benchmarked 6% of residents are 95 or older, compared to the Maryland average of 16%. Most residents here have not yet reached the oldest-old bracket, suggesting a younger overall community.

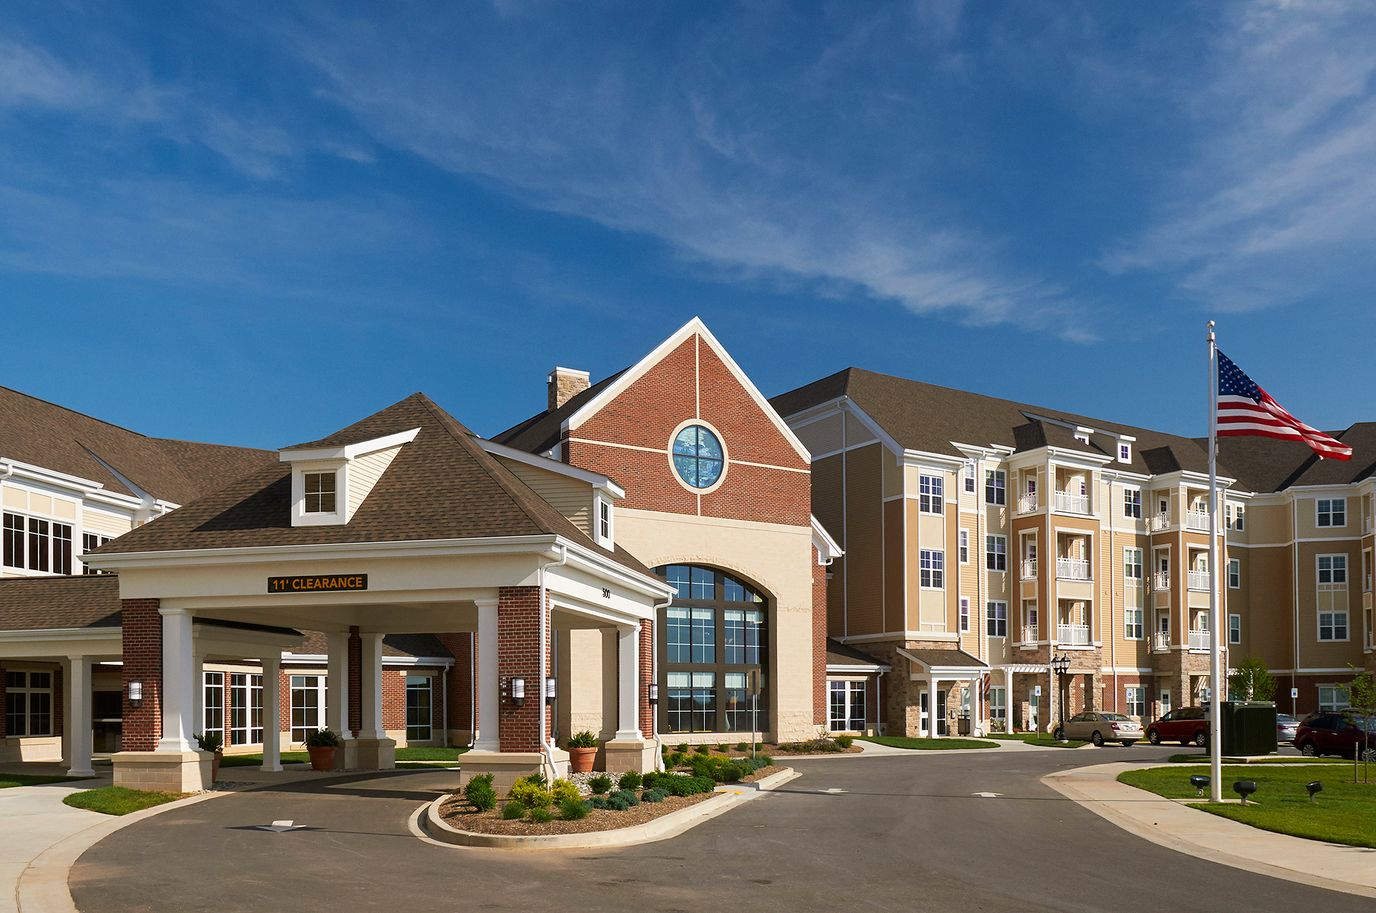
Tranquillity at Fredericktowne
IL
AL
MC
Frederick
114 Yes 38 Studio / 1 Bed / 2 Bed 26 -
25%

Male Residents — State Benchmarked 25% of residents are male, compared to the Maryland average of 31%. This facility caters to a majority female resident pool (75% female), consistent with the broader assisted living trend where women significantly outnumber men.

75%

Female Residents — State Benchmarked 75% of residents are female, compared to the Maryland average of 69%. Women comprise the large majority, consistent with national assisted living demographics where women live longer and enter care facilities at higher rates.

98%

White Residents — State Benchmarked 98% of residents are reported as White, compared to the Maryland average of 81%. A higher White share than is typical for assisted living in Maryland in this dataset — compare with peer facilities for local context.

0%

African American Residents — State Benchmarked 0% of residents are reported as African American or Black, compared to the Maryland average of 13%. A lower African American share than is typical in Maryland; local markets still vary widely.

2%

Other Ethnicity Residents — State Benchmarked 2% of residents fall into categories other than White or African American (combined), compared to the Maryland average of 6%. This column aggregates Hispanic, Asian, multiracial, and any other labeled groups that are not classified as White or African American. Reported subgroups in this total: Hispanic (1%), Mixed Race (1%).

6%

Residents Age 65–74 — State Benchmarked 6% of residents are 65–74, compared to the Maryland average of 13%. Fewer younger seniors suggests the resident population skews older, likely requiring higher acuity care and more hands-on support.

54%

Residents Age 75–84 — State Benchmarked 54% of residents are 75–84, compared to the Maryland average of 31%. A high concentration in this mid-range bracket, where residents typically need moderate support with daily activities.

16%

Residents Age 85–94 — State Benchmarked 16% of residents are 85–94, compared to the Maryland average of 44%. The population here skews younger than the statewide norm, which may indicate a more active, lower-acuity community.

24%

Residents Age 95+ — State Benchmarked 24% of residents are 95 or older, compared to the Maryland average of 16%. A high proportion of the oldest-old suggests strong end-of-life care experience and very-high-acuity capabilities.

Spring Arbor of Frederick
IL
AL
MC
Frederick (Ballenger Creek)
115 Yes 25 Studio / 1 Bed / 2 Bed 7 -
31%

Male Residents — State Benchmarked 31% of residents are male, compared to the Maryland average of 31%. This facility caters to a majority female resident pool (69% female), consistent with the broader assisted living trend where women significantly outnumber men.

69%

Female Residents — State Benchmarked 69% of residents are female, compared to the Maryland average of 69%. Women comprise the large majority, consistent with national assisted living demographics where women live longer and enter care facilities at higher rates.

96%

White Residents — State Benchmarked 96% of residents are reported as White, compared to the Maryland average of 81%. A higher White share than is typical for assisted living in Maryland in this dataset — compare with peer facilities for local context.

0%

African American Residents — State Benchmarked 0% of residents are reported as African American or Black, compared to the Maryland average of 13%. A lower African American share than is typical in Maryland; local markets still vary widely.

4%

Other Ethnicity Residents — State Benchmarked 4% of residents fall into categories other than White or African American (combined), compared to the Maryland average of 6%. This column aggregates Hispanic, Asian, multiracial, and any other labeled groups that are not classified as White or African American. Reported subgroups in this total: Asian (4%).

3%

Residents Age 65–74 — State Benchmarked 3% of residents are 65–74, compared to the Maryland average of 13%. Fewer younger seniors suggests the resident population skews older, likely requiring higher acuity care and more hands-on support.

39%

Residents Age 75–84 — State Benchmarked 39% of residents are 75–84, compared to the Maryland average of 31%. A high concentration in this mid-range bracket, where residents typically need moderate support with daily activities.

34%

Residents Age 85–94 — State Benchmarked 34% of residents are 85–94, compared to the Maryland average of 44%. The population here skews younger than the statewide norm, which may indicate a more active, lower-acuity community.

25%

Residents Age 95+ — State Benchmarked 25% of residents are 95 or older, compared to the Maryland average of 16%. A high proportion of the oldest-old suggests strong end-of-life care experience and very-high-acuity capabilities.

Somerford House & Place Frederick
IL
AL
MC
Frederick
52 Yes 40 Studio / 1 Bed 25 -
21%

Male Residents — State Benchmarked 21% of residents are male, compared to the Maryland average of 31%. This facility caters to a majority female resident pool (79% female), consistent with the broader assisted living trend where women significantly outnumber men.

79%

Female Residents — State Benchmarked 79% of residents are female, compared to the Maryland average of 69%. Women comprise the large majority, consistent with national assisted living demographics where women live longer and enter care facilities at higher rates.

90%

White Residents — State Benchmarked 90% of residents are reported as White, compared to the Maryland average of 81%. A higher White share than is typical for assisted living in Maryland in this dataset — compare with peer facilities for local context.

0%

African American Residents — State Benchmarked 0% of residents are reported as African American or Black, compared to the Maryland average of 13%. A lower African American share than is typical in Maryland; local markets still vary widely.

10%

Other Ethnicity Residents — State Benchmarked 10% of residents fall into categories other than White or African American (combined), compared to the Maryland average of 6%. This column aggregates Hispanic, Asian, multiracial, and any other labeled groups that are not classified as White or African American. Reported subgroups in this total: Mixed Race (4%), Other (4%), Hispanic (2%).

13%

Residents Age 65–74 — State Benchmarked 13% of residents are 65–74, compared to the Maryland average of 13%. In line with the statewide profile for this youngest senior bracket in assisted living.

44%

Residents Age 75–84 — State Benchmarked 44% of residents are 75–84, compared to the Maryland average of 31%. A high concentration in this mid-range bracket, where residents typically need moderate support with daily activities.

23%

Residents Age 85–94 — State Benchmarked 23% of residents are 85–94, compared to the Maryland average of 44%. The population here skews younger than the statewide norm, which may indicate a more active, lower-acuity community.

15%

Residents Age 95+ — State Benchmarked 15% of residents are 95 or older, compared to the Maryland average of 16%. In line with the statewide profile for the oldest resident bracket.

HeartFields Assisted Living at Frederick
IL
AL
MC
Frederick (Dearbought)
52 Yes 52 Studio / Suite 27 -
26%

Male Residents — State Benchmarked 26% of residents are male, compared to the Maryland average of 31%. This facility caters to a majority female resident pool (74% female), consistent with the broader assisted living trend where women significantly outnumber men.

74%

Female Residents — State Benchmarked 74% of residents are female, compared to the Maryland average of 69%. Women comprise the large majority, consistent with national assisted living demographics where women live longer and enter care facilities at higher rates.

93%

White Residents — State Benchmarked 93% of residents are reported as White, compared to the Maryland average of 81%. A higher White share than is typical for assisted living in Maryland in this dataset — compare with peer facilities for local context.

7%

African American Residents — State Benchmarked 7% of residents are reported as African American or Black, compared to the Maryland average of 13%. In line with the Maryland average for African American residents among facilities reporting this breakdown.

0%

Other Ethnicity Residents — State Benchmarked 0% of residents fall into categories other than White or African American (combined), compared to the Maryland average of 6%. This column aggregates Hispanic, Asian, multiracial, and any other labeled groups that are not classified as White or African American.

10%

Residents Age 65–74 — State Benchmarked 10% of residents are 65–74, compared to the Maryland average of 13%. Fewer younger seniors suggests the resident population skews older, likely requiring higher acuity care and more hands-on support.

26%

Residents Age 75–84 — State Benchmarked 26% of residents are 75–84, compared to the Maryland average of 31%. Below the state norm — the resident mix may skew either younger or older than this typical middle bracket.

48%

Residents Age 85–94 — State Benchmarked 48% of residents are 85–94, compared to the Maryland average of 44%. This is typically the most common age bracket in assisted living — this facility is in line with the statewide norm.

17%

Residents Age 95+ — State Benchmarked 17% of residents are 95 or older, compared to the Maryland average of 16%. In line with the statewide profile for the oldest resident bracket.

Homewood Living Frederick
IL
AL
MC
NH
SNF
Frederick
120
Facility 120
MD AVG 86
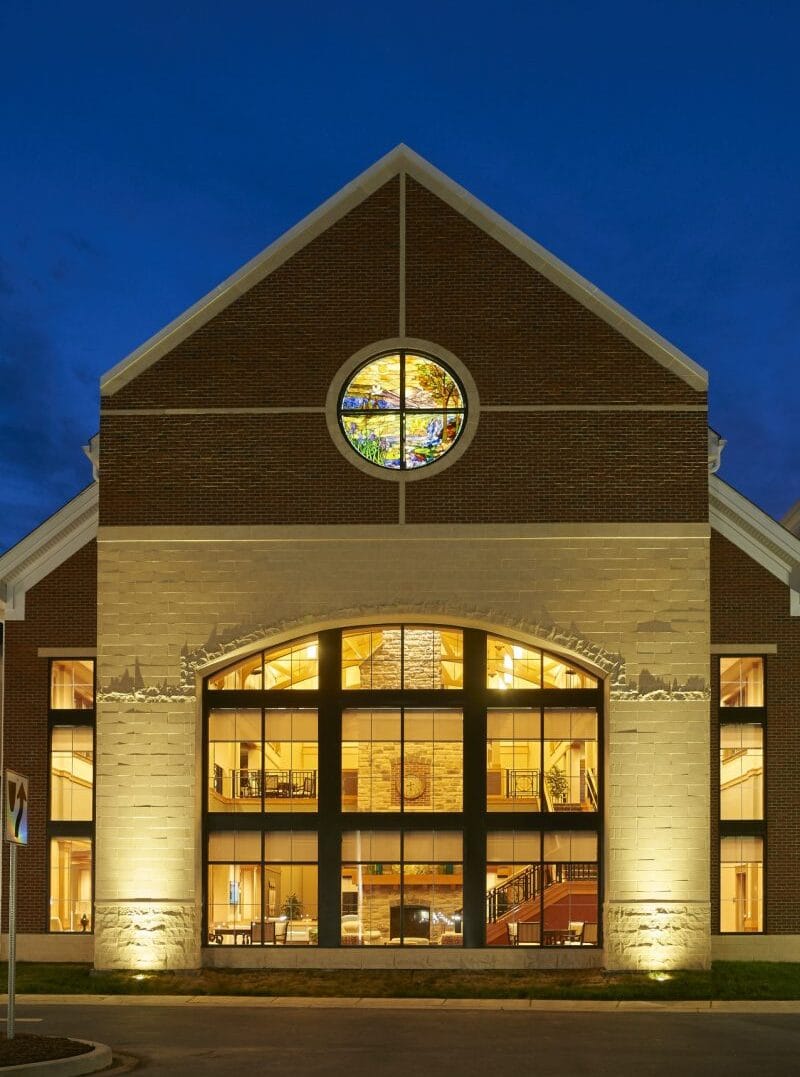
Rank #15 / 74
Yes
14
Facility 14
MD AVG 49
Rank #147 / 169
1 Bed / 2 Bed - - - - - - - - - - -
Creekside at Taskers Chance
IL
Frederick (Taskers Chance)
- Yes
32
Facility 32
MD AVG 49
Rank #123 / 169
1 Bed / 2 Bed
17
Facility 17
MD AVG 24
Rank #32 / 45
A+ - - - - - - - - -
The Lodge at Willow Ponds
IL
AL
MC
NH
SNF
Frederick
- Yes
93
Facility 93
MD AVG 49
Rank #9 / 169
1 Bed / 2 Bed - - - - - - - - - - -
Foundry Square
IL
Frederick
- Yes
91
Facility 91
MD AVG 49
Rank #12 / 169
1 Bed - - - - - - - - - - -

Rank badges are statewide and care-type specific: each independent living community is ranked against every other MD independent living community we track that reports that metric, not just the 18 analyzed for Frederick. See how we rank facilities

Rows per page:
View all Nearby Homes
12
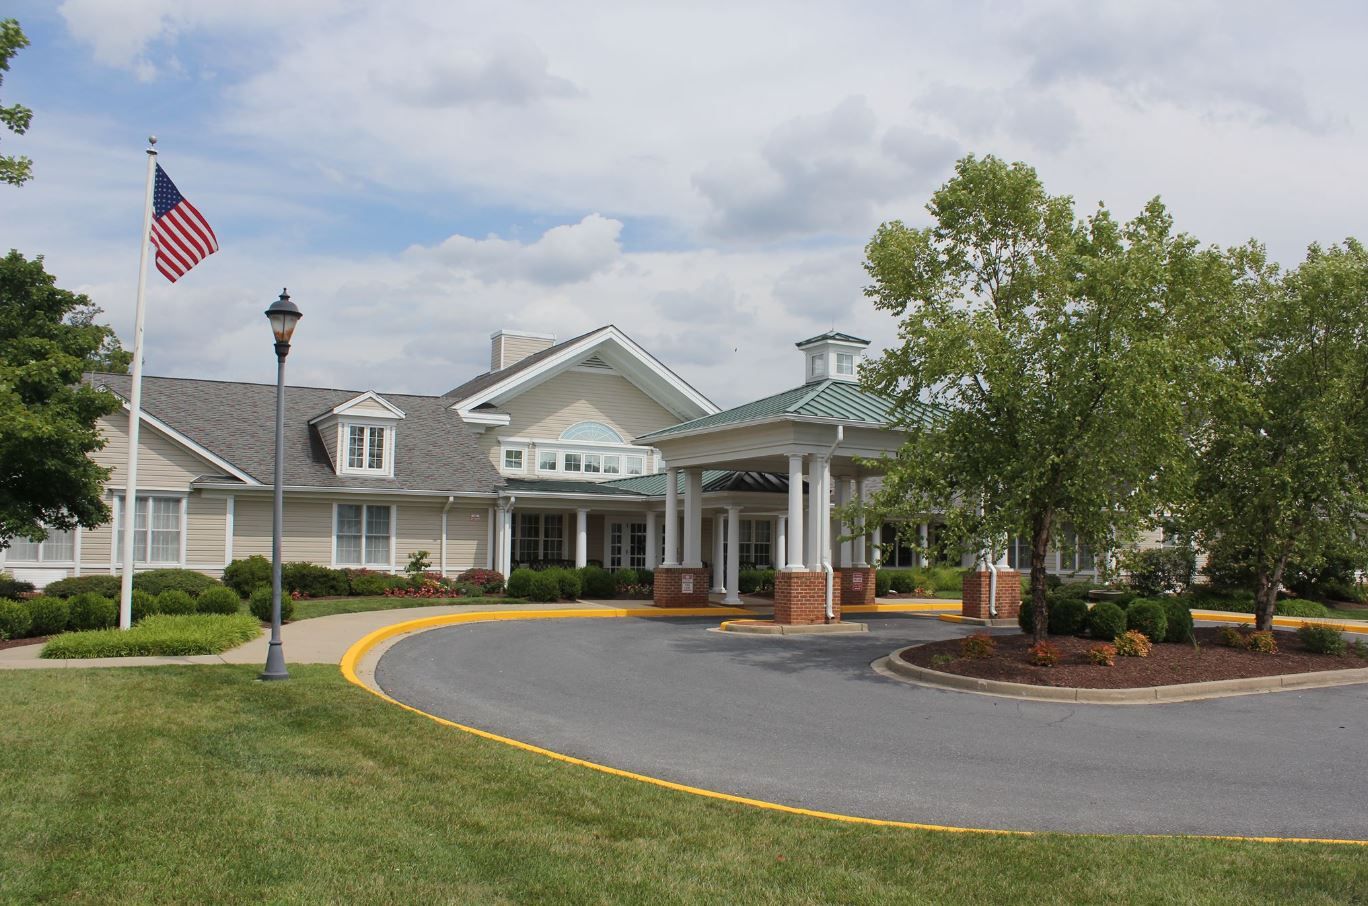
Overview of Country Meadows of Frederick

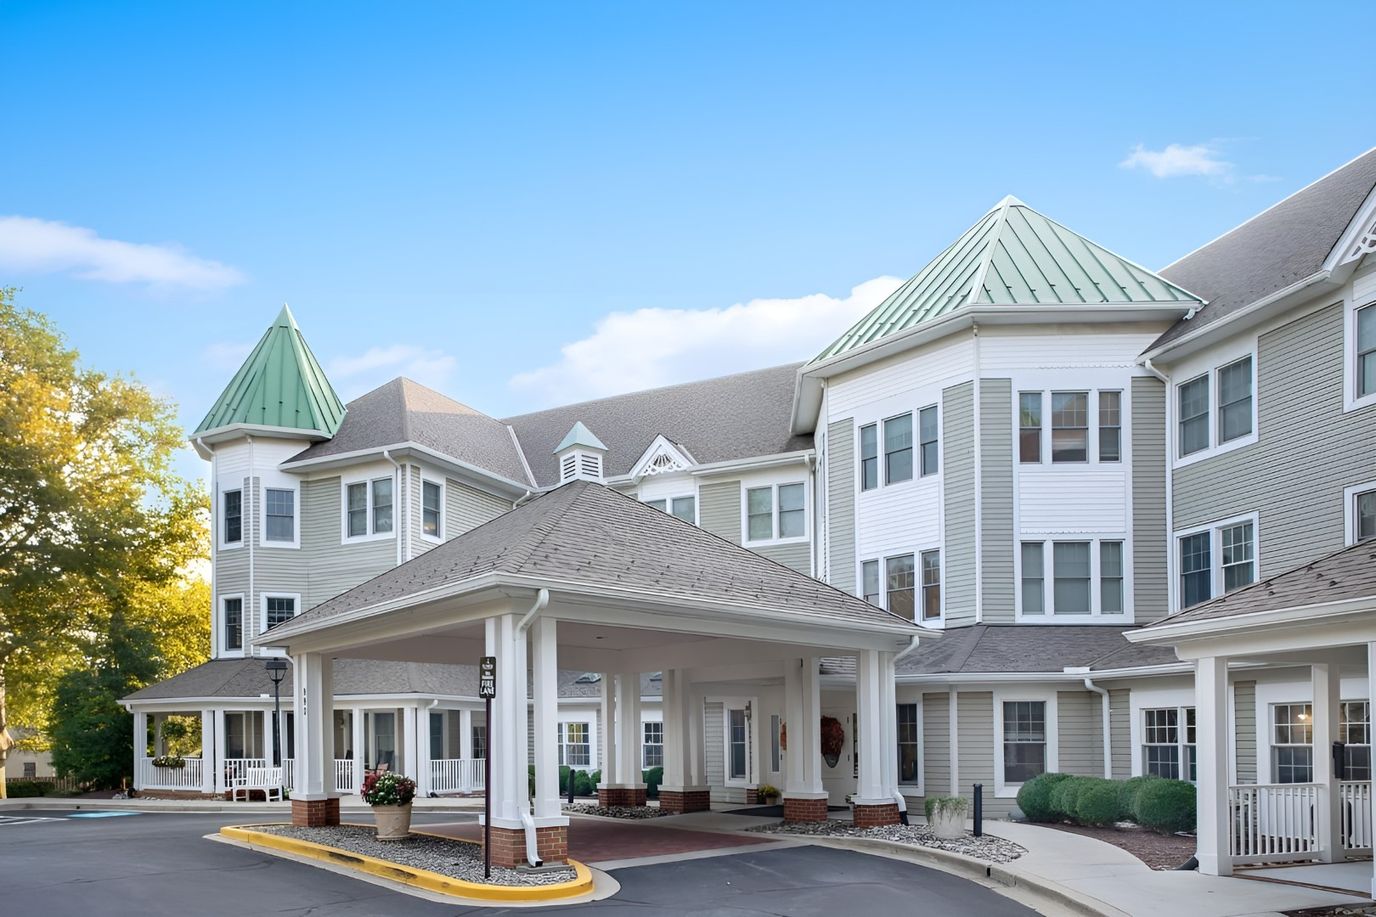
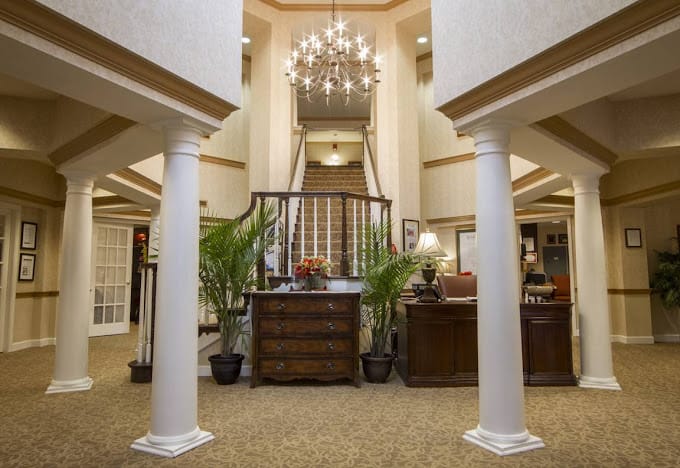
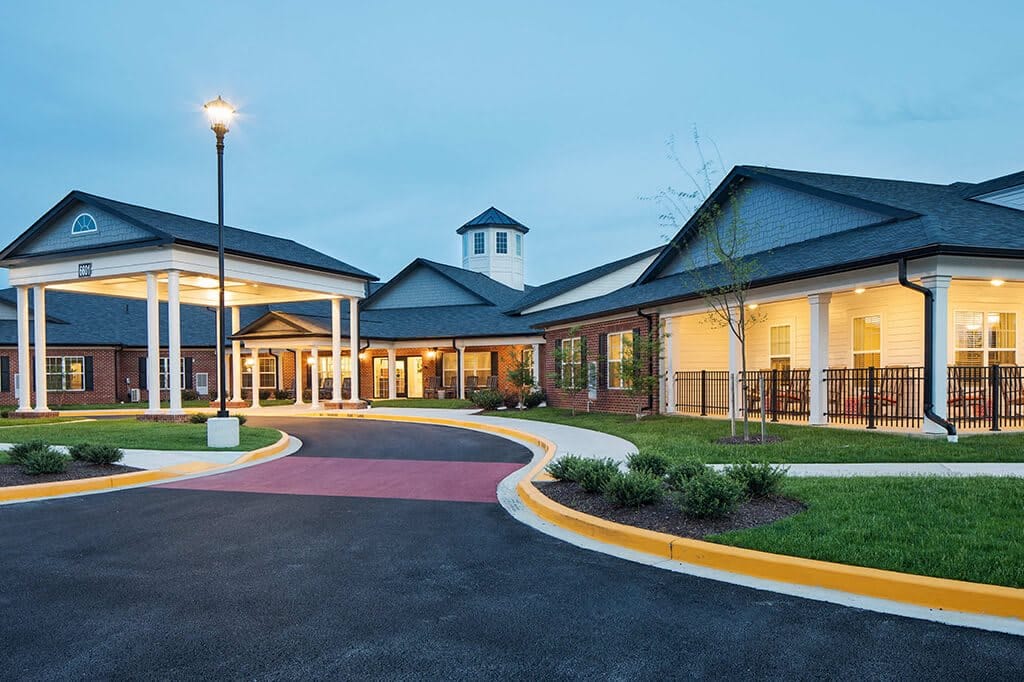
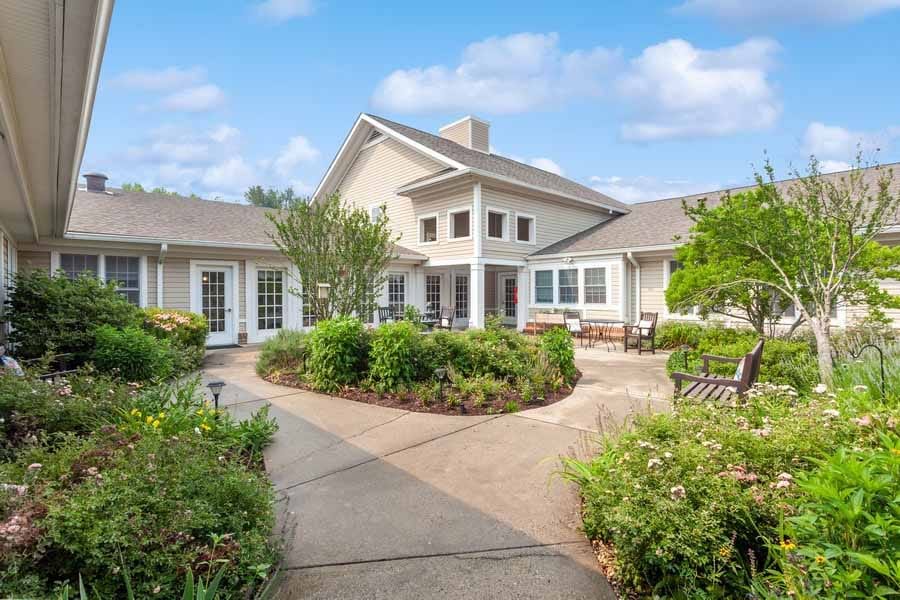
Country Meadows of Frederick offers independent living, assisted living, and memory care and stands as one of the trusted communities in the city. The elegant home presents a sprightly-filled ambiance– a sublime environment that matches your lifestyle. The professional staff delivers a heartfelt resident-centered approach to care; they strive to help seniors and adults thrive in the comfort of their own homes.

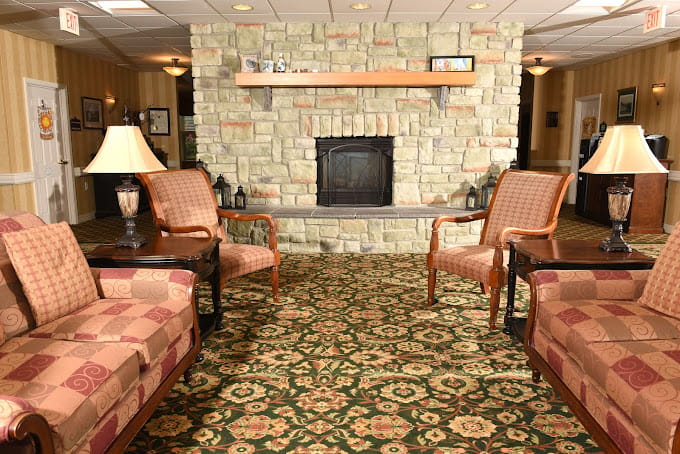
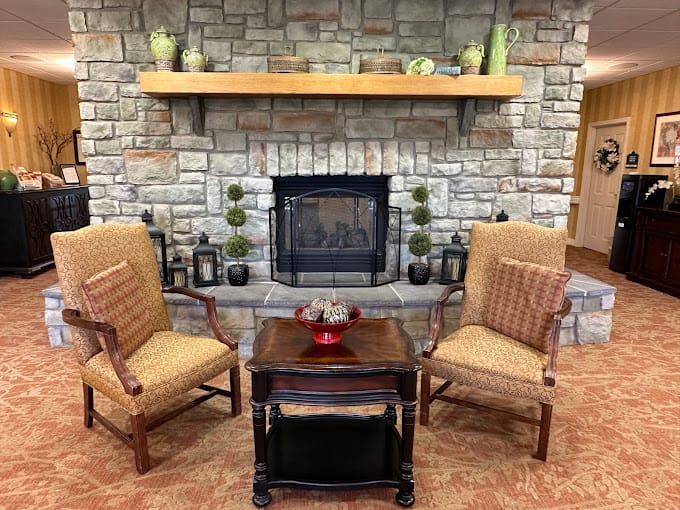
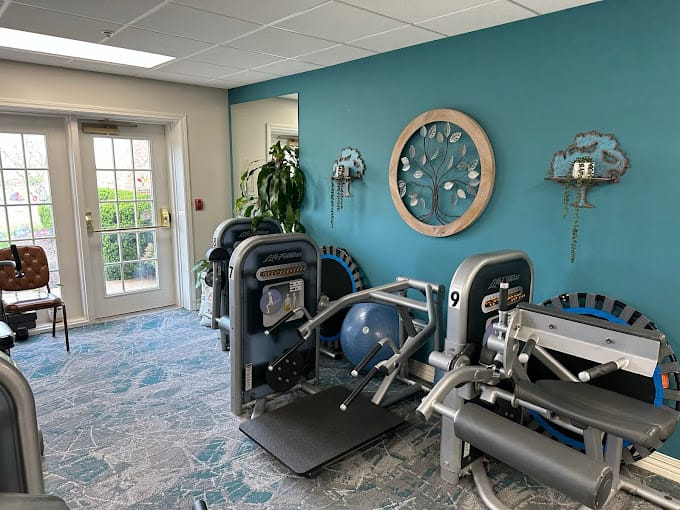
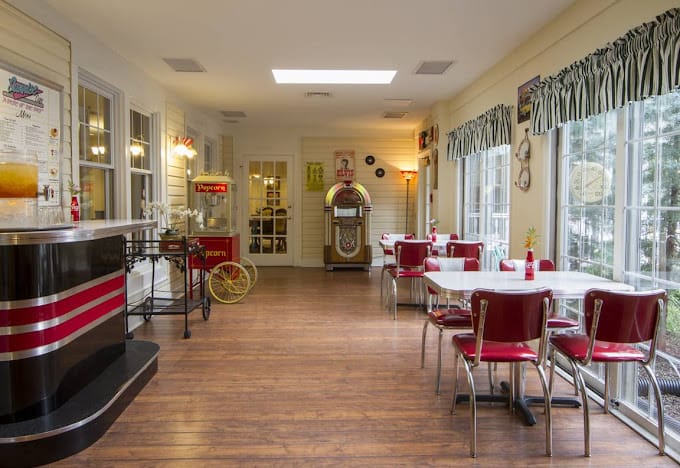
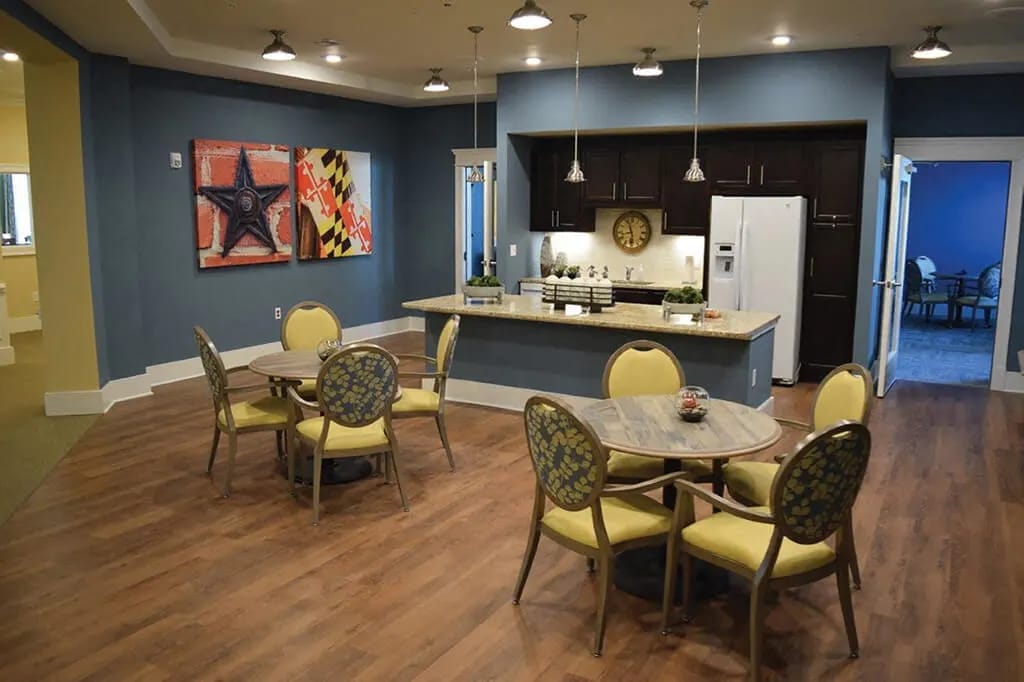
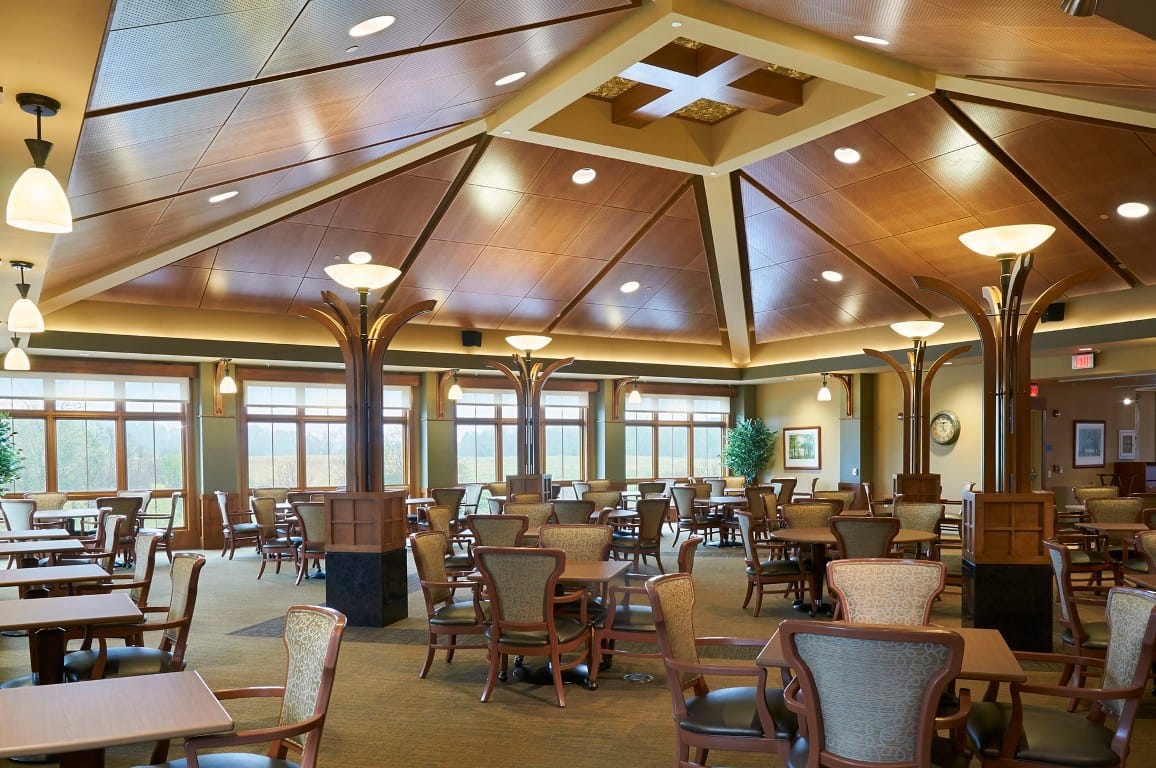
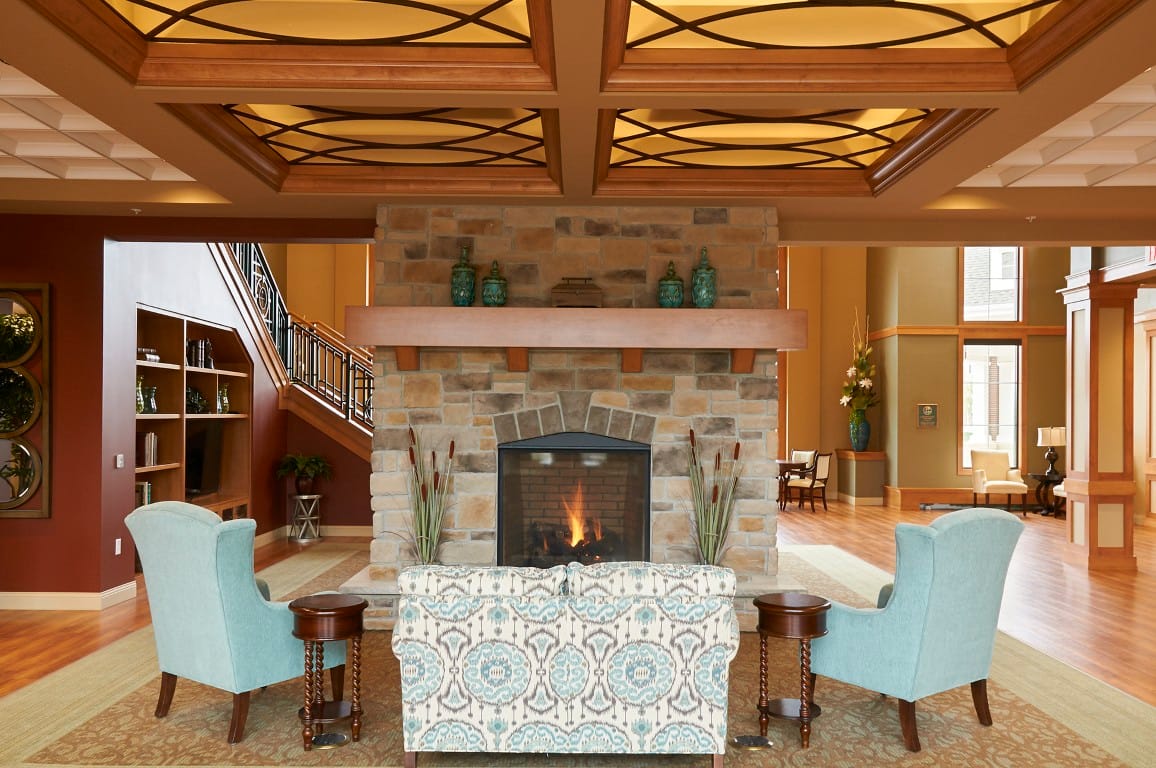
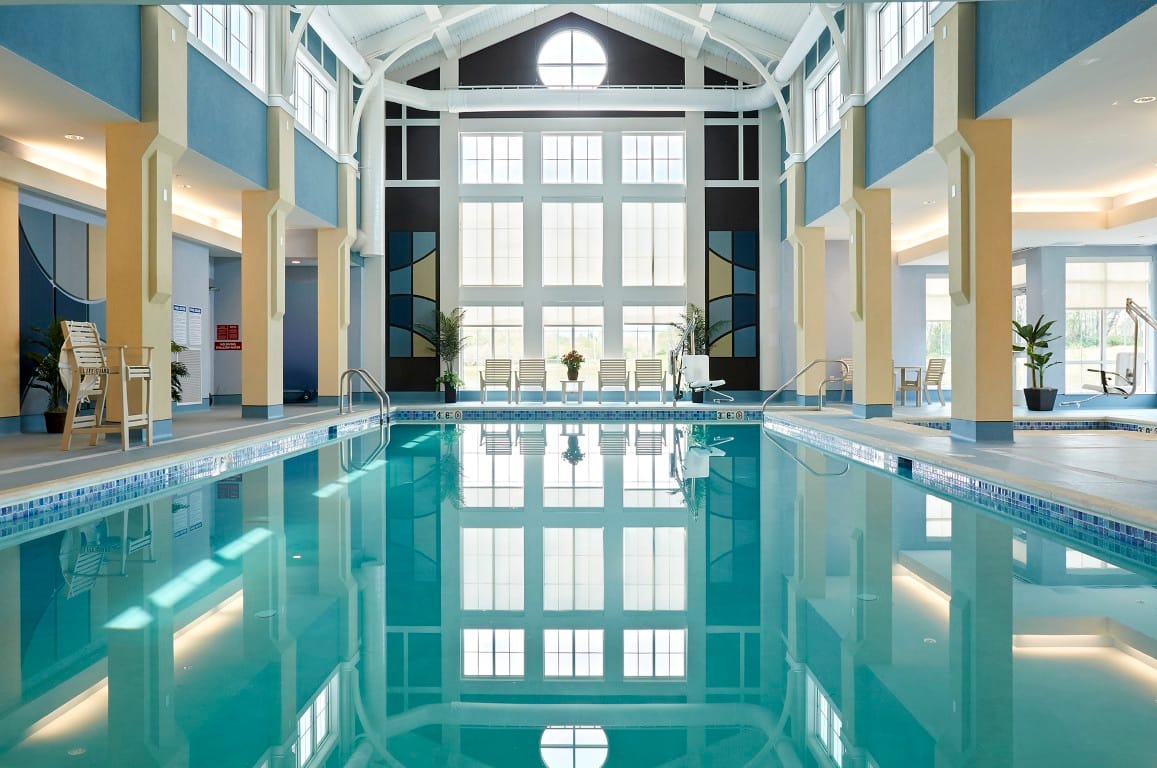
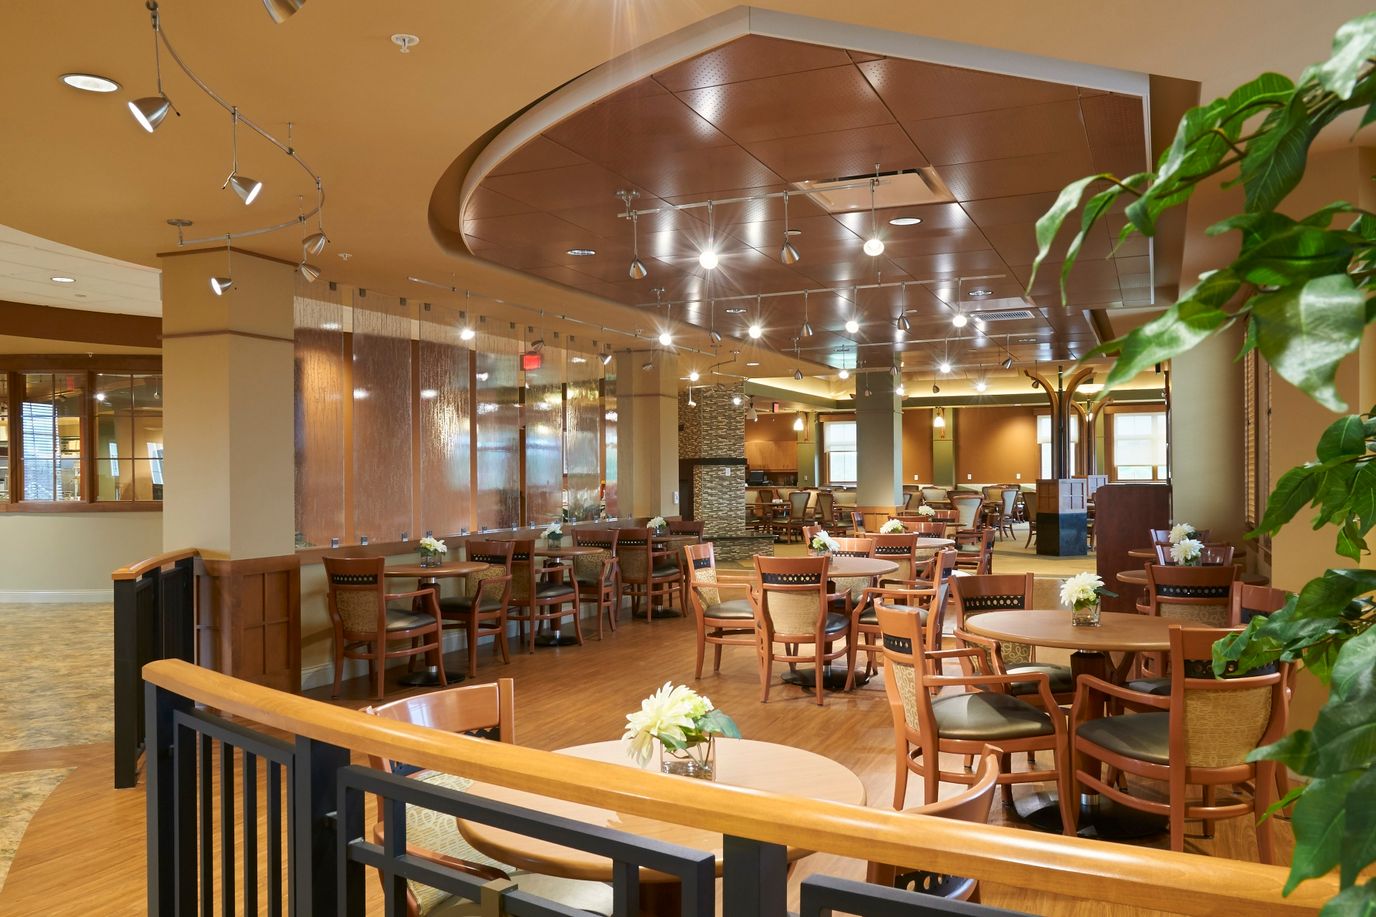
Country Meadows is an expansive community with fully equipped amenities to help the resident’s mental and physical stimulation to remain active– an art studio, library, walking paths, and outdoor spaces, to name a few of the community’s offerings.

Price range $177 - $322/Day

Contact Country Meadows of Frederick

Overview of Sunrise of Frederick

Sunrise of Frederick offers assisted living and memory care in Frederick, Maryland, in the Waterford neighborhood. Assisted living provides help with daily tasks while a resident maintains their own living space, while memory care provides a secured setting with supervision for someone at risk of wandering. These care options can suit a resident whose needs may grow over time without requiring a move to a different community.

The community has 88 beds, with studios, suites and rooms for two. A studio is a single private space, while a suite or room for two can suit someone moving with a companion. Starting rates range from $141 to $235 per day for a private room and from $85 to $154 per day for a semi-private room, giving families separate daily ranges based on the room arrangement. Sunrise of Frederick has a Walk Score of 62, described as somewhat walkable, so some errands can be completed on foot and a resident who no longer drives may be able to handle nearby tasks independently. Pets are allowed, so a resident may bring a pet. Sunrise Senior Living operates the community.

Price range $85 - $154/Day

Contact Sunrise of Frederick

Overview of Tranquillity at Fredericktowne

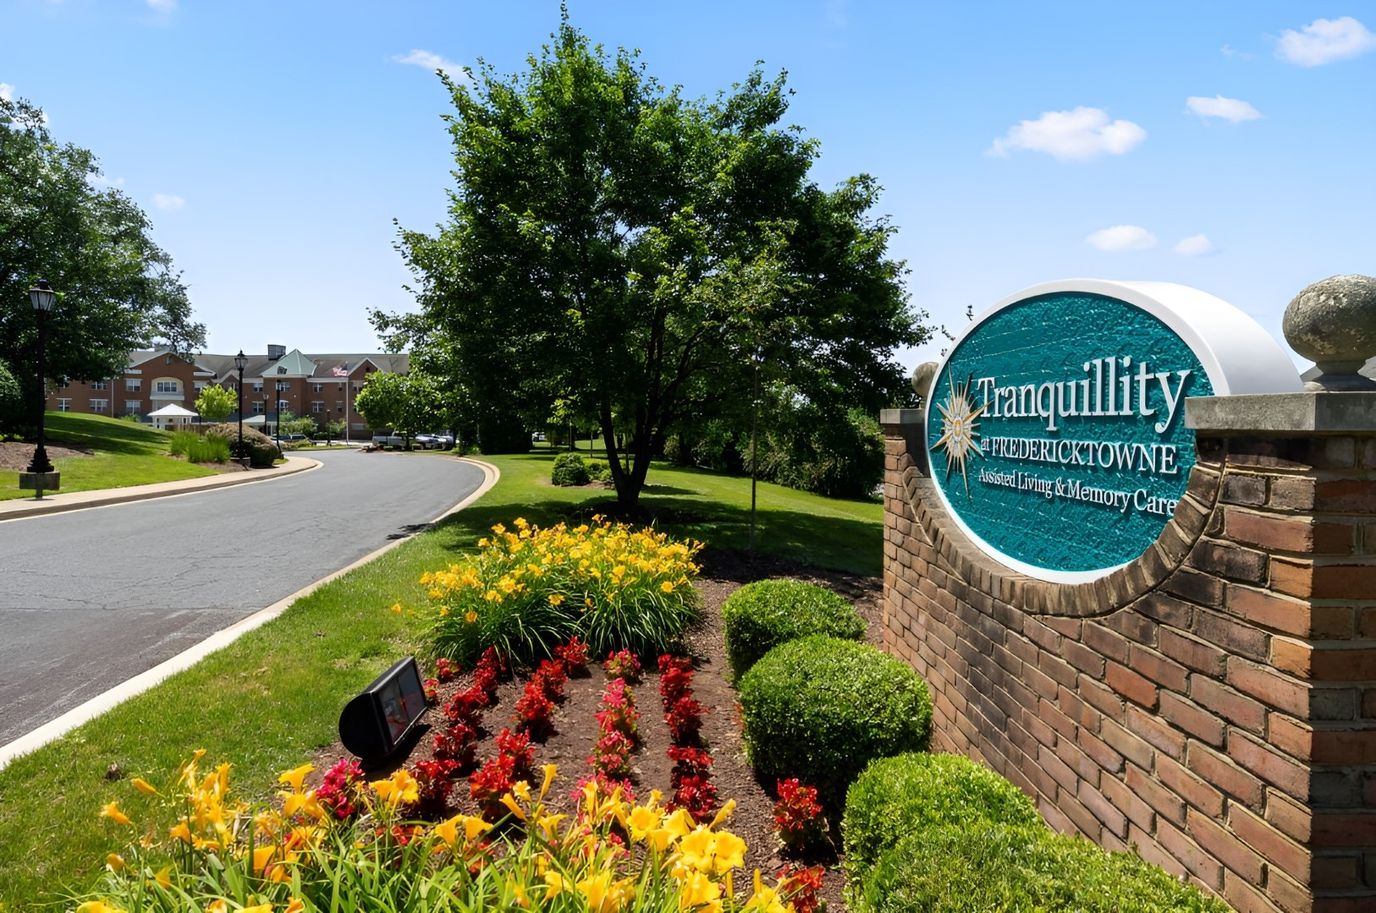
Tranquillity at Fredericktowne is one of the trusted memory care communities in the city; their services are only the best in its class, brought by their premier level of care entrusted to residents. The memory care community boasts its innovative and modern approach to senior care; they have ensured that they provide a spectrum of care as they understand the unique needs of each individual.

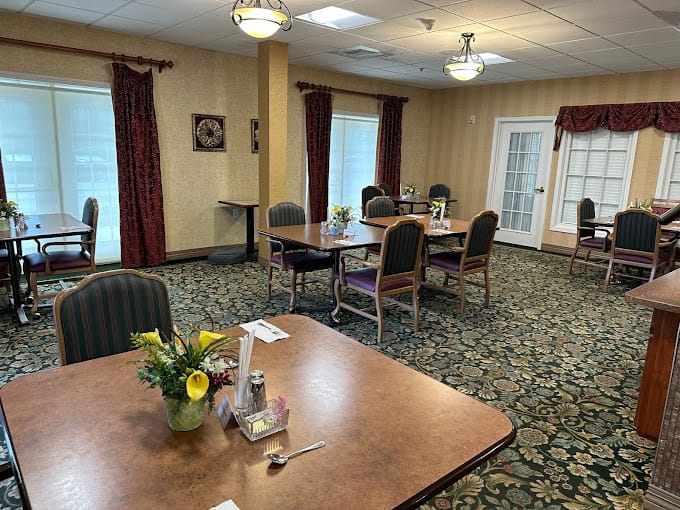
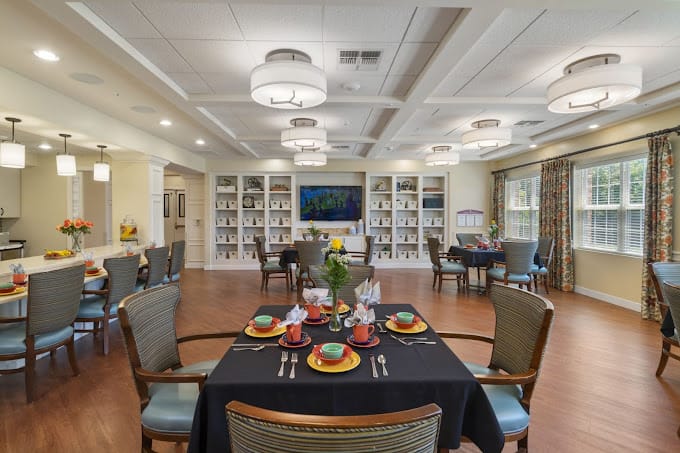
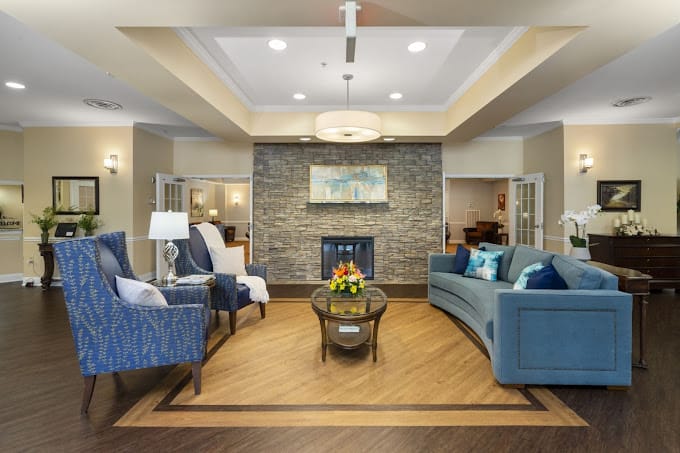
Tranquillity’s management and staff are well-trained professionals who ensure that residents are heard and provide a lifestyle that suits their requirements. All-inclusive amenities and services include spacious common areas, recreational rooms, housekeeping, and transportation services.

Price range $130 - $180/Day

Contact Tranquillity at Fredericktowne

Overview of Spring Arbor of Frederick

Spring Arbor of Frederick is an assisted living and memory care community that offers an inviting atmosphere so that residents can be comfortable and feel a sense of belonging in their new home; management ensures that everyone is treated with respect and compassion. Life in the assisted living community means a life of convenience and flexibility. Spring Arbor is an excellent community with a proven exemplary resident-centered community where seniors can thrive while living a lovely life.

A senior living community that aims to let its residents live a worry-free lifestyle, they ensure they can do many daily activities; services include medication management, bathing, dressing, and housekeeping. The goal of the professional care staff is to ensure that residents receive holistic wellness.

$146/Day

Contact Spring Arbor of Frederick

Overview of Somerford House & Place Frederick

Somerford House & Place Frederick provides assisted living and memory care in Frederick, MD. Assisted living includes help with daily tasks while a resident lives in a studio or one-bedroom apartment. Memory care offers a secured setting with supervision for someone who may be at risk of wandering. Having both care types can suit a resident whose needs grow over time, since care can change without a move to another community.

The community has 52 beds, giving families a clear sense of its licensed capacity. Private rooms range from $170 to $265 per day, so the daily amount a family budgets depends on the rate assigned to the room and care arrangement. Five Star Senior Living operates Somerford House & Place Frederick. A Walk Score of 40 places the area in a car-dependent setting, so most errands require a car or a ride rather than a short walk. Pets are allowed, letting a resident keep a pet while living at the community.

Price range $170 - $265/Day

Contact Somerford House & Place Frederick

Overview of HeartFields Assisted Living at Frederick

There are two levels of care listed at HeartFields Assisted Living at Frederick in Frederick, MD. Assisted living and memory care are the two of them, and the community is in the Dearbought neighborhood.

Under the first of those care types, bathing, dressing, and medication become the staff’s job, and the resident holds onto the privacy of their own studio or suite. Memory care adds supervision and keeps the residence secure, which is what a wandering risk needs. Either level is licensed here, so more needs later do not mean transferring to a new home.

The community has 52 beds, so it’s a smaller home compared to some, a quieter building where pets are allowed. A private room is priced at $235 to $245 per day, and semi-private rooms cost from $185 to $205 daily.

With a Walk Score of 52, the neighborhood is somewhat walkable, and some errands can be done on foot.

Price range $185 - $205/Day

Contact HeartFields Assisted Living at Frederick

Overview of Homewood Living Frederick

Enjoy your golden years at Homewood Living Frederick, a blissful retreat set in the vibrant neighborhood of Frederick, MD, offering independent living. With a variety of beautifully furnished and cozy accommodations, residents can rest assured of living comfortably in retirement. The community also promotes a hassle-free lifestyle, helping with chores and maintenance.

Residents will not run out of things to do, with plenty of recreation sites and unique local shops in the area. Delightful restaurants provide residents with a variety of dining options that satisfy their dietary needs and preferences. With its vibrant and welcoming environment, residents are guaranteed to flourish in retirement.

Contact Homewood Living Frederick

Overview of Creekside at Taskers Chance

Creekside at Taskers Chance offers independent living for adults aged 55 and older in the Taskers Chance area of Frederick, Maryland. Housing consists of one- and two-bedroom apartment units, giving residents private living space without daily care services included. Private patios provide dedicated outdoor areas, and pets are welcome in the community.

Amenities feature a fitness center, hair salon, clubhouse, and media room for social gatherings and entertainment. Wheelchair accessibility and supportive handrails assist movement throughout common areas, while scheduled weekly transportation supports local trips and errands. The area holds a walk score of 32, making most daily errands dependent on a vehicle or ride service.

Individuals exploring active adult housing options in Frederick can contact the management office to check apartment availability or plan a tour.

Contact Creekside at Taskers Chance

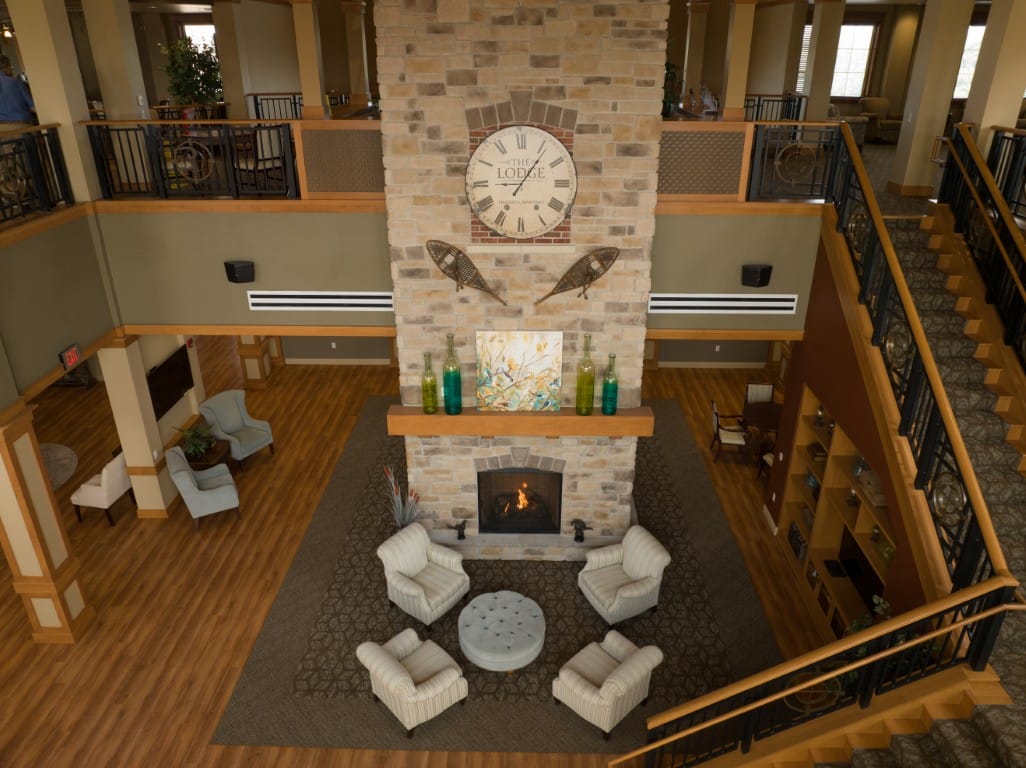
Overview of The Lodge at Willow Ponds

Ideally situated in the thriving neighborhood of Frederick, MD, The Lodge at Willow Ponds is an astounding community in Frederick, MD, offering independent living. With its dedication to enhancing older adults’ living experiences, the community provides cozy and thoughtfully furnished accommodations for their comfort. Residents also enjoy a hassle-free living with maintenance services and chores.

Residents can spend their days as they please with wellness opportunities and inviting gathering spaces. Multiple dining venues are also provided, so residents have the finest dining experience that caters to their dietary needs and preferences. The community is a great option for those seeking independence in retirement, especially with its warm and welcoming environment.

Contact The Lodge at Willow Ponds

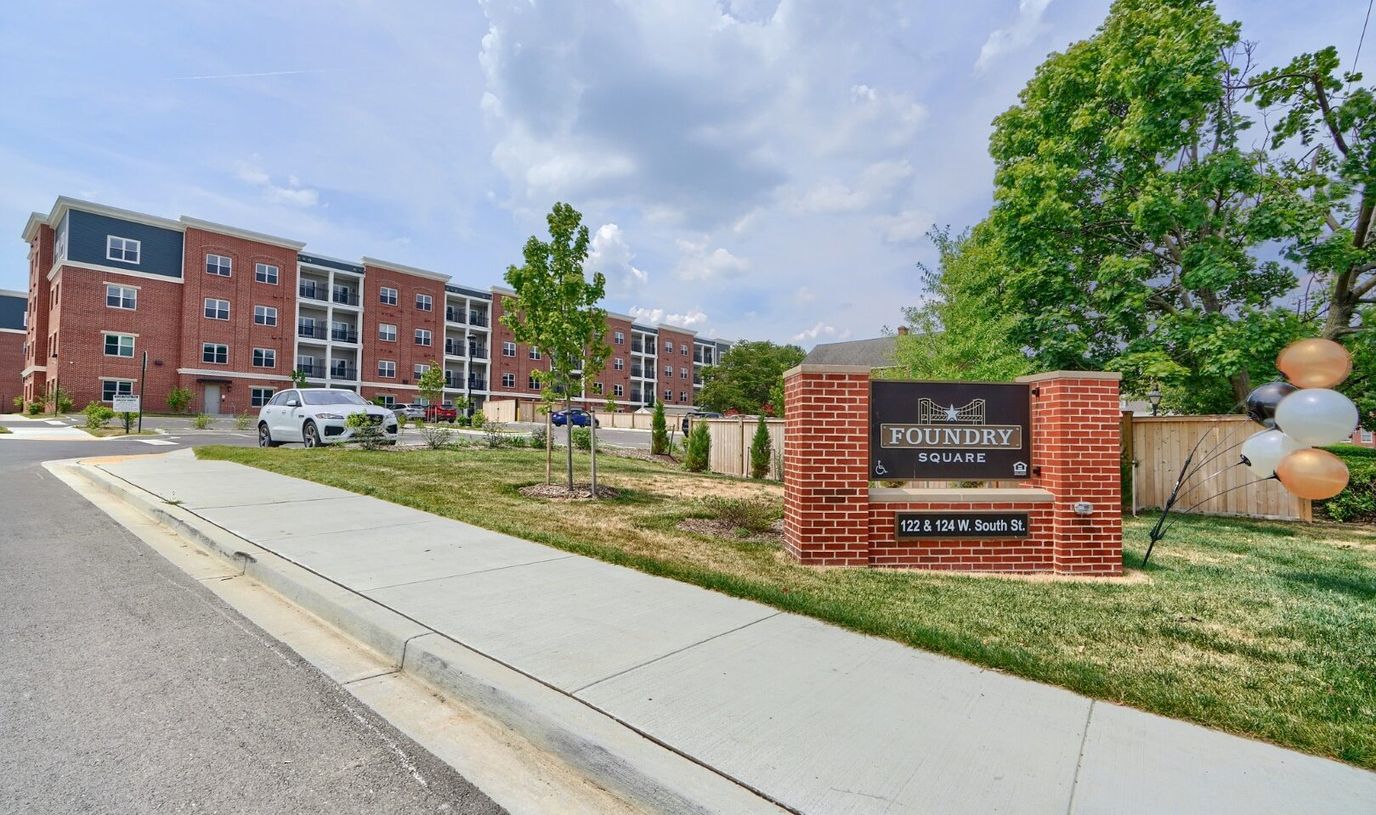
Overview of Foundry Square

Beautifully located in the harmonious neighborhood of Frederick, MD, Foundry Square is a purposely built community that offers independent living. The community has specially designed and sophisticated one- and two-bedroom floor plans, ensuring residents are comfortable and safe. With on-site maintenance and management, residents have a hassle-free living.

Fun recreational activities and engaging programs are conducted to keep residents active and socially connected. With easy access to delightful restaurants and shops in the area, residents enjoy meals that best match their dietary needs and preferences. The community promotes a vibrant and welcoming environment, striving to help residents thrive in their golden years.

Starting Price $1,625/Month

Contact Foundry Square

Weighting overview

  • 35%
    Resident Experience
  • 25%
    Regulatory
  • 15%
    Visual Media
  • 10%
    Website
  • 10%
    Stability
  • 5%
    Environment
01

Resident & Family Experience 35%

The single largest share of every ranking. Aggregated review sentiment and volume from major platforms — the closest signal to real resident experience.

  • Includes
  • Review Sentiment
  • Review Volume
02

Regulatory & Safety Record 25%

State inspection records, citations, and complaint visits. We weight per-inspection rates more heavily than raw counts.

  • Includes
  • State Inspections
  • Citations/Inspection
  • % Inspections w/ Citations
  • Complaint Visits
  • Accreditations
  • BBB Rating
03

Visual Media & Transparency 15%

Communities that publish high-quality visuals give families a real preview. No photos or tours = a negative transparency signal.

  • Includes
  • Video Tours
  • Virtual Walkthroughs
  • Photo Quantity
  • Photo Quality
04

Website & Operator Transparency 10%

Site quality and whether the operator publishes basic accountability information — staff names, contact details, ownership.

  • Includes
  • Website Content
  • Mobile Usability
  • Staff Info Available
  • Owner Info Available
05

Community Stability 10%

Operational signals indicating whether a community is well-run and meeting demand.

  • Includes
  • Occupancy Rate
  • Bed Options
06

Environment & Pricing 5%

Walkability and pricing transparency. Walk Score is weighted higher for Independent Living than for Memory Care, where most residents do not leave unaccompanied.

  • Includes
  • Walk Score
  • Pricing Transparency
No paid rankings Communities cannot pay to influence placement.
How we're paid: If we help you find a community and you move in, that community may pay us a referral fee. This never affects where they rank or what you pay. Learn more
Submit a correction

Senior Living in Frederick at a glance

Avg Walk Score: 47/ 100The average Walk Score across facilities in Frederick, MD. A third-party neighborhood walkability score (0–100) measuring convenience and context, not healthcare quality. Individual facilities can vary widely from this average.
National Average: 50/ 100
Avg No. of Beds: 94The average licensed bed capacity across facilities in Frederick, MD. Individual facilities can vary widely from this average.
National Average: 90
Who we are

Your Senior Care Partner, Every Step of the Way

We help families find affordable senior communities and unlock same day discounts, Medicaid, and Medicare options tailored to your needs.

Contact us Today

Frequently Asked Questions about Senior Living in Frederick, MD

What is senior living?

Senior living is an umbrella term covering independent living, assisted living, memory care, and nursing homes — communities and services designed for adults aged 55 or older.

How many senior living communities are listed on this page?

This page features 18 senior living communities in Frederick, MD. Use the filters and comparison tools above to compare ratings, amenities, and pricing.

How do I choose the right senior living community in Frederick, MD?

Start by matching the level of care offered to the resident's current and anticipated needs, then compare licensing status, staff-to-resident ratios, recent inspection results, and pricing. Tour at least two or three communities in Frederick, MD, talk to current residents and families, and confirm what is included in the base rate versus billed as add-on services.

What should I look for when visiting senior living communities in Frederick, MD?

Pay attention to staff interactions with residents, cleanliness and odor, food quality at meal times, the activity calendar, and how questions about pricing and care plans are answered. Ask to see the most recent state inspection report, the move-out / level-of-care-change policy, and a sample monthly bill that lists every fee.