


Total staff
75
Employees
48
Contractors
27
Illini Heritage Rehab & Health Care, situated in the serene neighborhood of Champaign, Illinois, proudly stands as a Medicaid and Medicare-certified, for-profit nursing home. The compassionate staff at Illini Heritage Rehab & Health Care is committed to ensuring that residents receive personalized care, creating a supportive community that fosters well-being. With a capacity of 60 beds, this facility specializes in delivering skilled nursing services to patients in a post-acute care setting.
Illini Heritage Rehab & Health Care remains unwavering in its dedication to enhancing the lives of its senior residents. It is a haven where comfort and healing intersect, providing a nurturing environment for those needing skilled nursing services. While operating independently, it actively participates in both Medicare and Medicaid programs.
| Staff type | Hours / Day / Resident | vs state avg |
|---|---|---|
|
Registered Nurse (RN)
| 19m per day | ▼ 57% State avg: 44m per day · National avg: 41m per day |
|
LPN / LVN
| 47m per day | ▲ 24% State avg: 38m per day · National avg: 52m per day |
|
Nurse Aide
| 2h 7m per day | ■ Avg State avg: 2h 8m per day · National avg: 2h 21m per day |
|
Weekend Total Nursing
| 2h 42m per day | ▼ 13% State avg: 3h 5m per day · National avg: 3h 26m per day |
|
Physical Therapist
| 1m per day | ▼ 67% State avg: 3m per day · National avg: 4m per day |
|
Weekend RN
| 13m per day | ▼ 61% State avg: 34m per day · National avg: 29m per day |
Reporting period: October 1 – December 31, 2025 (Q4 2025). Source: CMS Payroll-Based Journal report.
Manages medical care and health needs.
Assists with medical care and medications.
Helps with daily care and mobility.
Total hours from contractors
1,194 contractor hours this quarter
| Certified Nursing Assistant | 29 | 1 | 30 | 10,112 | 92 | 100% | 7 |
| Licensed Practical Nurse | 9 | 5 | 14 | 3,348 | 92 | 100% | 9.9 |
| Registered Nurse | 5 | 3 | 8 | 928 | 64 | 70% | 10.3 |
| Administrator | 1 | 0 | 1 | 488 | 61 | 66% | 8 |
| Nurse Practitioner | 1 | 0 | 1 | 480 | 60 | 65% | 8 |
| Dietitian | 1 | 0 | 1 | 468 | 59 | 64% | 7.9 |
| RN Director of Nursing | 1 | 0 | 1 | 416 | 52 | 57% | 8 |
| Mental Health Service Worker | 1 | 0 | 1 | 339 | 46 | 50% | 7.4 |
| Physical Therapy Aide | 0 | 2 | 2 | 280 | 64 | 70% | 4.4 |
| Speech Language Pathologist | 0 | 5 | 5 | 273 | 49 | 53% | 5.1 |
| Qualified Social Worker | 0 | 2 | 2 | 116 | 49 | 53% | 2.4 |
| Clinical Nurse Specialist | 0 | 2 | 2 | 91 | 13 | 14% | 7 |
| Occupational Therapy Aide | 0 | 1 | 1 | 88 | 12 | 13% | 7.3 |
| Respiratory Therapy Technician | 0 | 2 | 2 | 79 | 31 | 34% | 2.4 |
| Physical Therapy Assistant | 0 | 3 | 3 | 62 | 27 | 29% | 2.2 |
| Occupational Therapy Assistant | 0 | 1 | 1 | 10 | 3 | 3% | 3.3 |
Includes penalties issued in 2025
Federal penalties imposed by CMS for regulatory violations, including civil money penalties (fines) and denials of payment for new Medicare/Medicaid admissions.
Source: CMS Penalties Database (Data as of Jan 2026)
Illinois average: $143K
Illinois average: 3.0
Illinois average: 1.1
Penalties are imposed by CMS for violations of federal nursing home regulations.
2 penalties in the past 3 years
Multiple penalties were reported in the last 3 years.
Last updated: Jan 2026
These measures show how residents usually do over time at this home, based on health outcomes and preventive care.
Illinois average: 9.7
Illinois average: 18.6
Illinois average: 15.5%
Illinois average: 18.4%
Illinois average: 21.6%
Illinois average: 3.4%
Illinois average: 5.3%
Illinois average: 1.8%
Illinois average: 6.5%
Illinois average: 48.1%
Illinois average: 20.2%
Illinois average: 89.2%
Illinois average: 91.6%
Illinois average: 68.3%
Illinois average: 2.3%
Illinois average: 63.0%
Quality measures are calculated from Minimum Data Set (MDS) assessments. For most measures, lower percentages indicate better care quality.
28% of new residents, usually for short-term rehab.
50% of new residents, often for short stays.
23% of new residents, often for long-term daily care.
Source: CMS Long-Term Care Facility Characteristics (Data as of Jan 2026)
Residents meet regularly to discuss policies, care quality, and activities
Organized group of residents that meets regularly to discuss facility policies, quality of life, and activities.
Data sourced from CMS Long-Term Care Facility Characteristics quarterly report. Payer mix reflects the current resident census by primary payment source.
Historical financial and operational data for Illini Heritage Rehab & Health Care from 2012–2023, based on CMS SNF Cost Reports.
Key figures below are for fiscal year ending in 12/2023.
Based on CMS SNF Cost Report for fiscal year ending in 12/2023.
This home supports both short-term rehab and long-term care, with residents staying for a wide range of durations.
Most new residents arrive under private pay (50% of admissions), and a typical private pay stay runs around 1 - 2 months.
Coverage residents most often arrive under.
Coverage residents most often leave under.
![]() 3.0 miles from city center
3.0 miles from city center
![]() Estimated distance in miles from Champaign's city center to Illini Heritage Rehab & Health Care's address, calculated via Google Maps.
Estimated distance in miles from Champaign's city center to Illini Heritage Rehab & Health Care's address, calculated via Google Maps.
Add your location
Info below is compiled from CMS reports & the IL Dept. of Public Health (IDPH), senior community websites & trusted data sources such as Walk Score & BBB.
Communities are listed from highest to lowest based on our ranking methodology.
| Illini Heritage Rehab & Health Care | NH SNF | Champaign (Dobbins Downs) | 60
Facility
60
IL AVG
85
Rank
#249 / 419 |
86.5%
Facility
86.5%
IL AVG
73
Rank
#44 / 157 | +18% | 3.29
Facility
3.29
IL AVG
3.10
Rank
#59 / 155 | -25% | +6% | $12.4k
Facility
$12.4k
IL AVG
$151.3k
Rank
#74 / 155 | 97
Facility
97
IL AVG
36.8
Rank
#154 / 155 | 6.9
Facility
6.9
IL AVG
3.7
Rank
#154 / 155 | 10 | 52 | - |
31
Facility
31
IL AVG
51
Rank
#487 / 648 | Jason Stewart | $4.3MFiscal year ending 12/2023
Facility
$4.3MFiscal year ending 12/2023
IL AVG
$12.2M
Rank
#150 / 154 | $2.6MFiscal year ending 12/2023
Facility
$2.6MFiscal year ending 12/2023
IL AVG
$4.8M
Rank
#152 / 154 | 60.8%Fiscal year ending 12/2023
Facility
60.8%Fiscal year ending 12/2023
IL AVG
44.3%
Rank
#30 / 154 | 146017 | ||||
| Accolade Healthcare of Savoy | NH HOS MC RC SNF | Savoy | 213
Facility
213
IL AVG
85
Rank
#22 / 419 |
84.4%
Facility
84.4%
IL AVG
73
Rank
#55 / 157 | +16% | 2.56
Facility
2.56
IL AVG
3.10
Rank
#109 / 155 | +3% | -17% | $257.3k
Facility
$257.3k
IL AVG
$151.3k
Rank
#147 / 155 | 113
Facility
113
IL AVG
36.8
Rank
#155 / 155 | 3.9
Facility
3.9
IL AVG
3.7
Rank
#103 / 155 | 13 | 180 | - |
70
Facility
70
IL AVG
51
Rank
#153 / 648 | Jonas Hoedebecke | $11.3M*Fiscal year ending 12/2022These figures are from this home's most recent complete cost report — an older period than most facilities report. Compare with that in mind.
Facility
$11.3M*Fiscal year ending 12/2022These figures are from this home's most recent complete cost report — an older period than most facilities report. Compare with that in mind.
IL AVG
$12.2M
Rank
#108 / 154 | $6.9M*Fiscal year ending 12/2022These figures are from this home's most recent complete cost report — an older period than most facilities report. Compare with that in mind.
Facility
$6.9M*Fiscal year ending 12/2022These figures are from this home's most recent complete cost report — an older period than most facilities report. Compare with that in mind.
IL AVG
$4.8M
Rank
#87 / 154 | 61%*Fiscal year ending 12/2022These figures are from this home's most recent complete cost report — an older period than most facilities report. Compare with that in mind.
Facility
61%*Fiscal year ending 12/2022These figures are from this home's most recent complete cost report — an older period than most facilities report. Compare with that in mind.
IL AVG
44.3%
Rank
#35 / 154 | 145439 |
Illini Heritage Rehab & Health Care is located in Champaign, Illinois.
Here are the financial assistance programs available to residents in Illinois.
Illini Heritage Rehab & Health Care is in the Dobbins Downs neighborhood.
Illini Heritage Rehab & Health Care has a walk score of 31. Somewhat walkable. A few nearby services may be reachable on foot, but most trips require transportation.
Illini Heritage Rehab & Health Care's occupancy is 85.0%.
No, Illini Heritage Rehab & Health Care has a no-pet policy.
Illini Heritage Rehab & Health Care is registered as a for-profit.
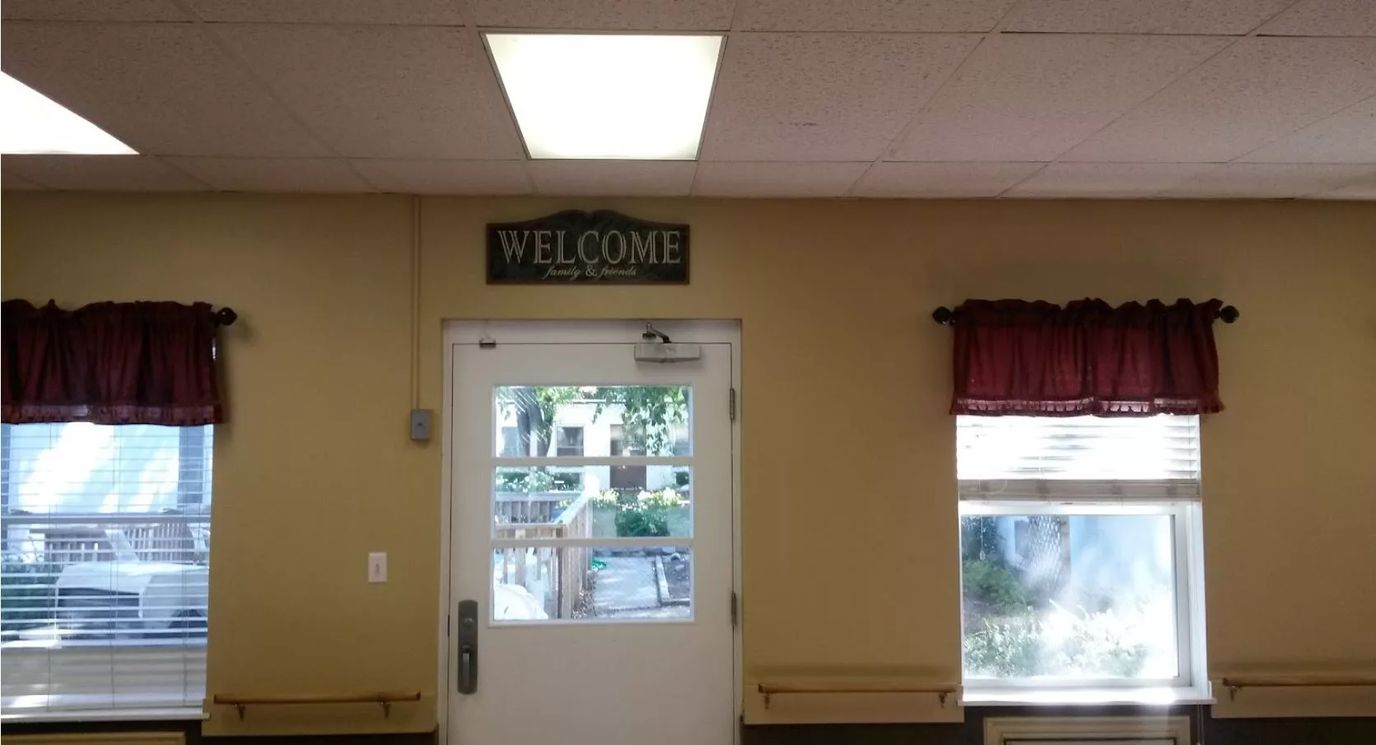
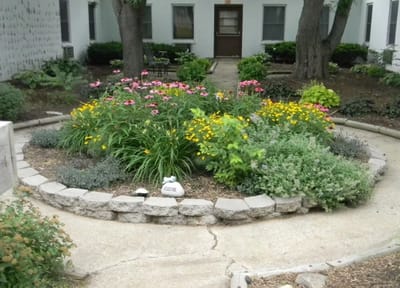
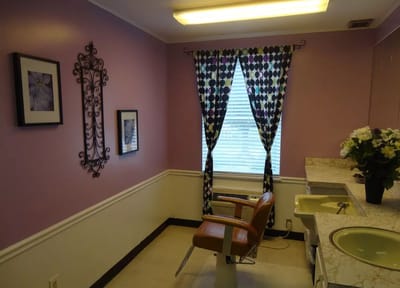
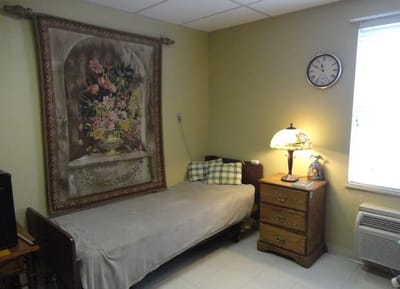
Yes — there are 4 photos of Illini Heritage Rehab & Health Care in the photo gallery on this page.
Illini Heritage Rehab & Health Care is located at 1315 Curt Dr, Champaign, IL 61821.
Care Cost Calculator: See Prices in Your Area
Nursing Home Data Explorer
Don’t Wait Too Long: 7 Red Flag Signs Your Parent Needs Assisted Living Now
The True Cost of Assisted Living in 2025 – And How Families Are Paying For It
Understanding Senior Living Costs: Pricing Models, Discounts & Financial Assistance


