Nursing Home

Jourdanton Nursing and Rehab

Nursing Home

Jourdanton Nursing and Rehab

1504 TX-97, Jourdanton, TX 78026 View map
Overview of Jourdanton Nursing and Rehab

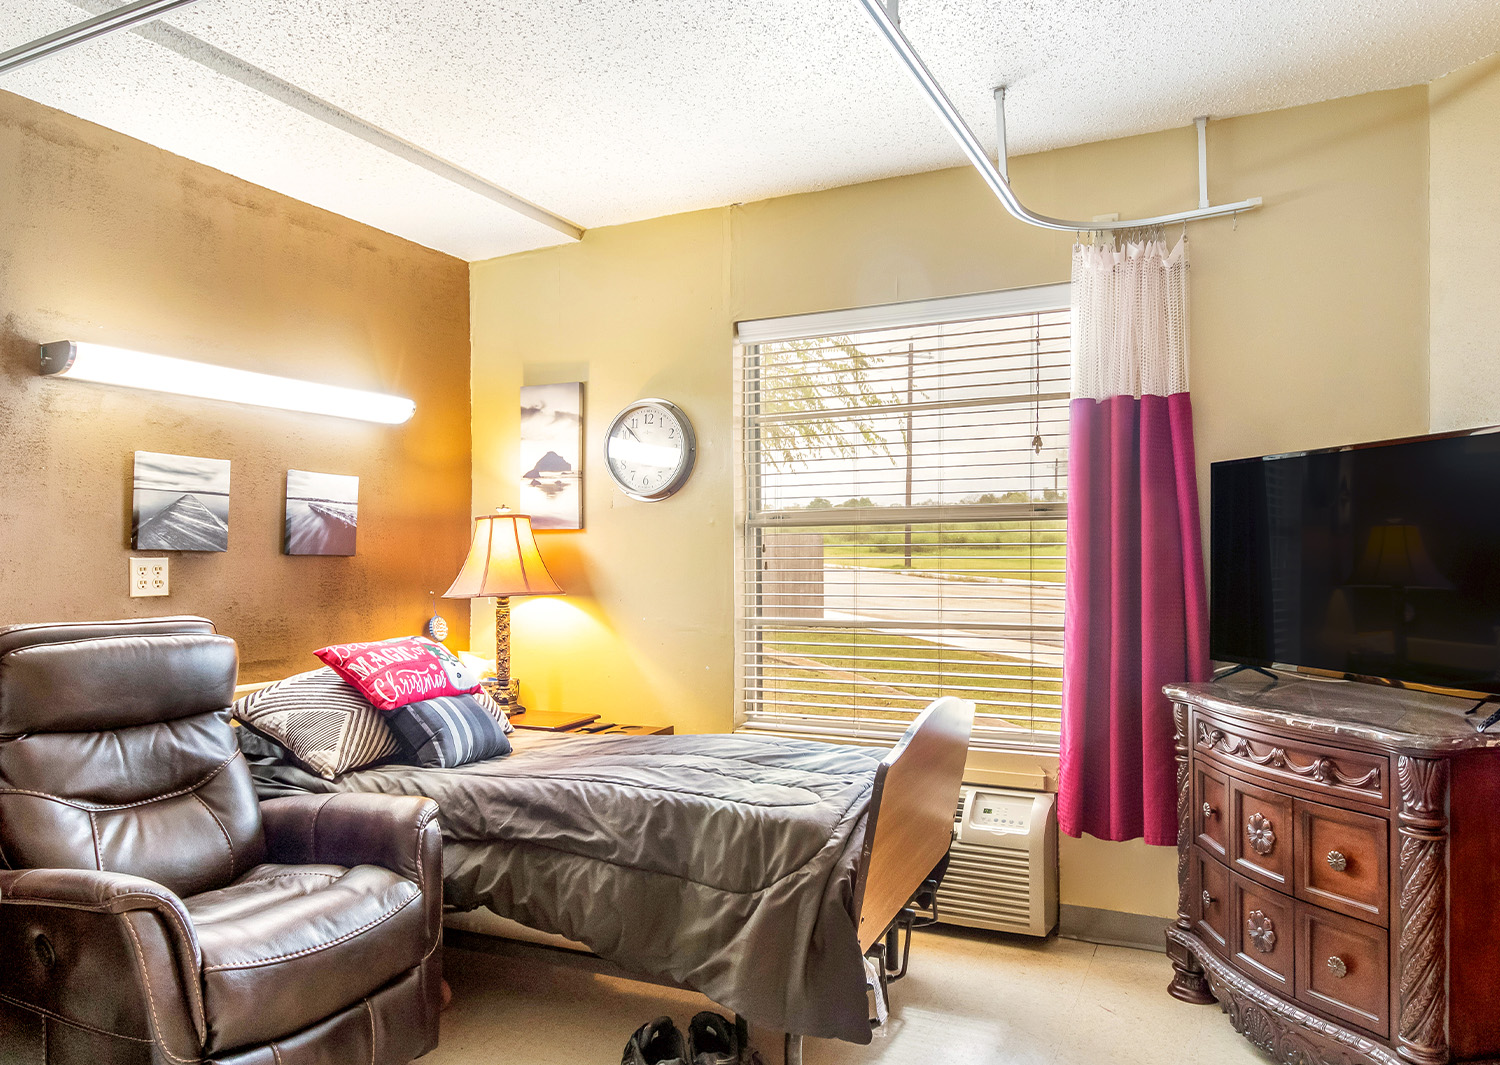
Jourdanton Nursing and Rehab based in Jourdanton, TX, prioritizes seniors’ wellness and provides diverse care options including skilled nursing, rehabilitation therapy, and long- and short-term care. The community also offers physical, occupational, and speech therapy and other care services to ensure seniors are well-taken care of. Keep worries at bay and experience exceptional care and support from a kind, reliable, and well-trained team.

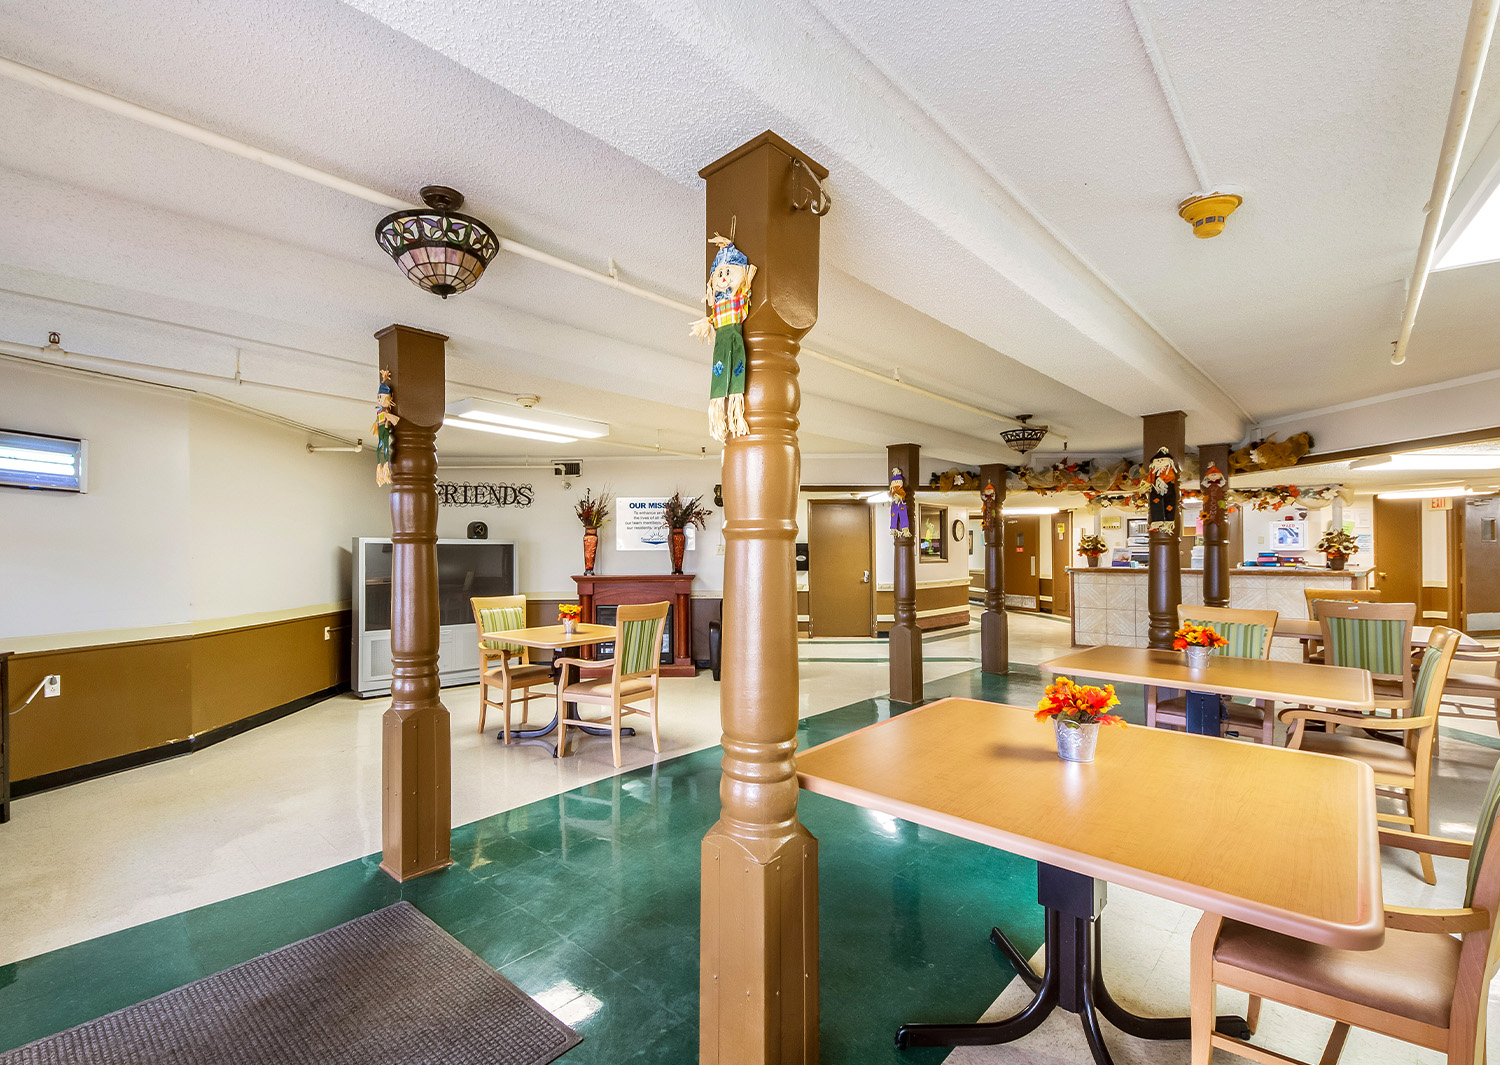
The community aims to improve seniors’ quality of life by collaborating to create care plans that perfectly suit their specific needs. Social activities are conducted to encourage residents to interact and meet people with the same interests. Jourdanton Nursing and Rehab goes above and beyond in helping seniors achieve optimal wellness to live their golden years wholly.

(830) 769-3531

Quality ratings

Measured by Centers for Medicare & Medicaid Services (CMS)

Overall rating Info Official CMS rating based on health inspections, staffing and quality measures.
3/5
Texas average: 2.8/5
Health Inspection Info Official CMS rating based on deficiencies found during state health inspections.
4/5
Texas average: 2.8/5
Staffing Info Official CMS rating based on nurse staffing hours per resident per day.
1/5
Texas average: 2.1/5
Quality Measures Info Official CMS rating based on clinical outcomes for residents.
2/5
Texas average: 3.8/5

Nursing care per resident

Info Average daily nursing hours per resident (adjusted for acuity). Higher values indicate more nursing time per resident.
3h 4m per day

This home provides 16% less nursing time per resident than the Texas average.

Texas average: 3h 38m per day

Staffing hours breakdown

Info Hours of care per resident per day, broken down by staff type. Data from CMS Medicare.
Staff type Facility State avg National avg
Registered Nurse (RN) Info Registered nurse hours per resident per day. 13m per day 21m per day 29m per day

Capacity and availability

Smaller home

May offer a more intimate, personalized care environment.

Total beds 60

This home usually has availability

Lower occupancy suggests more openings may be available.

Lower demand than the Texas average
Occupancy rate 69.6%
Residents per day (avg) 44
Occupancy rate
69.6%
Residents per day (avg)
44

Who this home usually serves

TYPE OF STAY

Mostly short-term rehab stays

Most residents typically stay for a few weeks or months before returning home or moving on.

Might be optimal for
Short stays Recovery Medicare-covered care

Breakdown by payment type

Medicare

40% of new residents, usually for short-term rehab.

Typical stay 29 days

Private pay

31% of new residents, often for short stays.

Typical stay 1 - 2 months

Medicaid

29% of new residents, often for long-term daily care.

Typical stay 2 - 3 years

Finances and operations

Governmental community
Operated by state authorities.
Home revenue
$3.3M
Operating deficit
-$2
Governmental community Operated by state authorities.
Home revenue
$3,332,558.00
Operating deficit
$-2.00
Payroll costs Info The portion of the home's budget spent on staff, including nurses, caregivers, and other employees who support care and operations.
$1
0% of revenue
Other operating costs Info All remaining costs needed to run the home, such as food, utilities, building maintenance, supplies and administrative expenses.
$3.3M
Total costs $3.3M

What does this home offer?

Building type icon
Building type icon

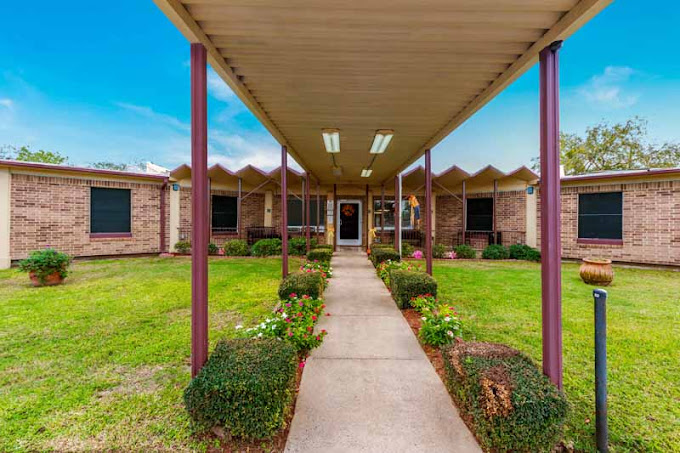
Building Type: Single-story

Fitness and recreation icon

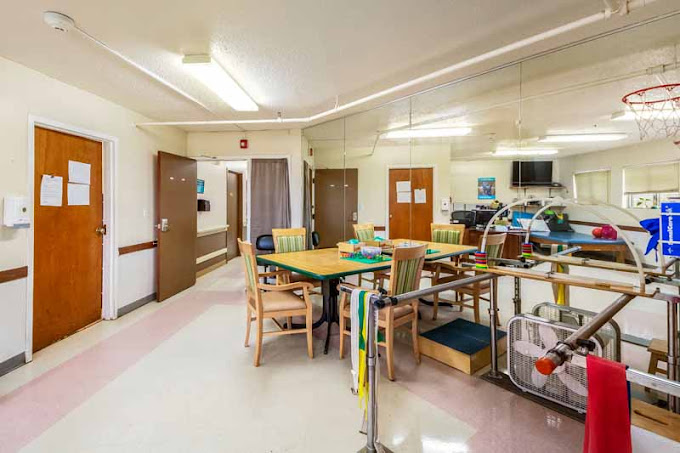
Fitness and Recreation

Types of Care at Jourdanton Nursing and Rehab

Skilled Nursing Hospice Care

Health Inspection History

Inspections
Total health inspections 7

Texas average 7.4


Last Health inspection on Jul 2025

Total health citations 21
Citations per inspection
3

Health citations are formal notices following inspections when they fail to comply with safety and care standards.

13 of 21 citations resulted from standard inspections; 6 of 21 resulted from complaint investigations; and 2 of 21 came from combined inspections (standard and complaint).

Breakdown of citation severity (last 3 years)
Critical Health citations More info 2
In line with Texas average

Texas average: 2


Serious Health citations More info 0
100% better than Texas average

Texas average: 0.4

2 critical citations More info Texas average: 2

0 serious citations More info Texas average: 0.4

17 moderate citations More info Texas average: 23

2 minor citations More info Texas average: 0.4
Citations history (last 3 years)
Abuse/Neglect moderate citation Jul 10, 2025
Corrected

Pharmacy moderate citation Jul 10, 2025
Corrected

Care Planning moderate citation Jul 10, 2025
Corrected

Care Planning moderate citation Mar 24, 2025
Corrected

Compare Nursing Homes around Jourdanton

The information below is reported by the Texas Health and Human Services Commission.
Jourdanton Nursing and Rehab
HC

Hospice Care

SNF

Nursing Homes 24/7 care needed

Jourdanton
60
38
MAVERICK COUNTY HOSPITAL DISTRICT
69.6%
$3,083,087.00
$1.00
0%
43.80
3/5
3.0678
4/5
1/5
2/5
2
21
2
-13%
-16%
+10%

Places of interest near Jourdanton Nursing and Rehab

Address 0.8 miles from city center — 0.36 miles to nearest hospital (Camino Real Community Services)

Address 1504 TX-97, Jourdanton, TX 78026

Calculate Travel Distance to Jourdanton Nursing and Rehab

Add your location

Address

Staffing Data

Source: CMS Payroll-Based Journal (Q2 2025)

62
Total Staff
57
Employees
5
Contractors
13,872
Total Hours (Quarter)
18
Avg Staff/Day
8.5
Avg Shift (hrs)
Nursing Staff Breakdown
Role Count Avg Shift (hrs) Uses Contractors?
Registered Nurse47.2 Yes
Licensed Practical Nurse109.4 No
Certified Nursing Assistant228.8 No
Staff by Category
Administration
3 staff
6hs shift avg
Nursing Staff
40 staff
9.1hs shift avg
Physicians & Practitioners
3 staff
7.9hs shift avg
Therapy Services
10 staff
7.2hs shift avg
Activities & Recreation
0 staff
0hs shift avg
Social Services
4 staff
7.6hs shift avg
Dietary Services
1 staff
8.4hs shift avg
Other Services
1 staff
7.7hs shift avg
Contractor Analysis
0.8%
of total hours from contractors
108 contractor hours this quarter
Occupational Therapy Aide: 1 Medical Director: 1 Registered Nurse: 1 Occupational Therapy Assistant: 1 Physical Therapy Assistant: 1
Role Employees Contractors Total Staff Total Hours Days Worked % of Days Avg Shift (hrs)
Certified Nursing Assistant220224,71991100%8.8
Licensed Practical Nurse100103,11191100%9.4
Qualified Social Worker4041,1967582%7.6
Clinical Nurse Specialist2029706470%7.9
Medication Aide/Technician1017827077%11.2
Other Dietary Services Staff1015366470%8.4
Speech Language Pathologist2024986571%6.7
Respiratory Therapy Technician2024835662%8.6
Administrator2024165257%8
Mental Health Service Worker1012923842%7.7
Registered Nurse3142733741%7.2
Nurse Practitioner1012162730%8
Physical Therapy Aide3031832527%6.3
Nurse Aide in Training30397910%9.7
Occupational Therapy Aide0115289%6.5
Medical Director011242123%1.1
Occupational Therapy Assistant0111833%6
Physical Therapy Assistant011822%4

Facility Characteristics

Source: CMS Long-Term Care Facility Characteristics (Data as of Jan 2026)

Total census
45 residents
Residents by payment source
Medicare
3 residents (6.7%)
Medicaid
42 residents (93.3%)
Programs & Services
Residents' Group

Residents meet regularly to discuss policies, care quality, and activities

Active Resident Council

Organized group of residents that meets regularly to discuss facility policies, quality of life, and activities.

Quality of care over time

These measures show how residents usually do over time at this home, based on health outcomes and preventive care.

High-risk clinical events score Info A composite score based on pressure ulcers, falls with injury, weight loss, walking ability decline, and activities of daily living decline. 8.8
In line with Texas average

Texas average: 8.6

Functional decline score Info A composite score based on activities of daily living decline, walking ability decline, and incontinence. 13.0
19% better than Texas average

Texas average: 16.0

Long-stay resident measures
Average Texas avg: 4.2 Info CMS star rating based on long-stay quality measure performance. 5 stars = significantly above average, 1 star = significantly below average.
Need for Help with Daily Activities Increased Info Percent of long-stay residents whose need for help with daily activities has increased 14.2%
12% better than Texas average

Texas average: 16.2%

Walking Ability Worsened Info Percent of long-stay residents whose ability to move independently worsened 10.1%
38% better than Texas average

Texas average: 16.2%

Low Risk Residents with Bowel/Bladder Incontinence Info Percent of low risk long-stay residents who lose control of their bowels or bladder 14.7%
6% better than Texas average

Texas average: 15.7%

Falls with Major Injury Info Percent of long-stay residents experiencing one or more falls with major injury 5.5%
69% worse than Texas average

Texas average: 3.2%

High Risk Residents with Pressure Ulcers Info Percent of long-stay high risk residents with pressure ulcers 6.9%
55% worse than Texas average

Texas average: 4.4%

Urinary Tract Infection Info Percent of long-stay residents with a urinary tract infection 1.9%
134% worse than Texas average

Texas average: 0.8%

Lost Too Much Weight Info Percent of long-stay residents who lose too much weight 7.4%
114% worse than Texas average

Texas average: 3.5%

Depressive Symptoms Info Percent of long-stay residents who have depressive symptoms 6.4%
123% worse than Texas average

Texas average: 2.9%

Antipsychotic Use Info Percent of long-stay residents who received an antipsychotic medication 16.3%
107% worse than Texas average

Texas average: 7.9%

Pneumococcal Vaccine Info Percent of long-stay residents assessed and appropriately given the pneumococcal vaccine 100.0%
In line with Texas average

Texas average: 97.3%

Influenza Vaccine Info Percent of long-stay residents assessed and appropriately given the seasonal influenza vaccine 100.0%
In line with Texas average

Texas average: 97.9%

Hospitalizations per 1,000 days Info Number of hospitalizations per 1,000 long-stay resident days. 1.82
15% better than Texas average

Texas average: 2.13

ED visits per 1,000 days Info Number of outpatient emergency department visits per 1,000 long-stay resident days. 3.48
68% worse than Texas average

Texas average: 2.07

Short-stay resident measures
Significantly below average Texas avg: 2.9 Info CMS star rating based on short-stay quality measure performance. 5 stars = much above average, 1 star = much below average.
Pneumococcal Vaccine Info Percent of short-stay residents assessed and appropriately given the pneumococcal vaccine 100.0%
11% better than Texas average

Texas average: 90.4%

Antipsychotic medication increase Info Percent of short-stay residents who newly received an antipsychotic medication 0.0%
100% better than Texas average

Texas average: 1.4%

Re-hospitalized after SNF stay Info Percentage of short-stay residents who were re-hospitalized after their nursing home admission. 42.3%
63% worse than Texas average

Texas average: 25.9%

Emergency department visits Info Percentage of short-stay residents who had an outpatient emergency department visit. 21.2%
77% worse than Texas average

Texas average: 12.0%

Falls with major injury Info Percentage of SNF residents who experience falls with major injury during their stay. 4.2%
442% worse than Texas average

Texas average: 0.8%

Penalties and fines

Federal penalties imposed by CMS for regulatory violations, including civil money penalties (fines) and denials of payment for new Medicare/Medicaid admissions.

Source: CMS Penalties Database (Data as of Jan 2026)

Total fines amount $28K
65% lower than Texas average

Texas average: $80K

Number of fines 2
20% fewer fines than Texas average

Texas average: 2.5

Payment Denials Info Serious action where Medicare and/or Medicaid temporarily stops payments for new residents until issues are fixed. 0
100% fewer payment denials than Texas average

Texas average: 0.2

Fines amount comparison
This facility $28K
Texas average $80K
Penalty History

Penalties are imposed by CMS for violations of federal nursing home regulations.

Civil Money Penalty Info Fines imposed for noncompliance, which can be assessed per day or per instance of violation. Oct 4, 2024
$15K
Civil Money Penalty Info Fines imposed for noncompliance, which can be assessed per day or per instance of violation. Jun 19, 2024
$14K

Last updated: Jan 2026

Guides for Better Senior Living

Care Cost Calculator: See Prices in Your Area

Nursing Home Data Explorer

Don’t Wait Too Long: 7 Red Flag Signs Your Parent Needs Assisted Living Now

The True Cost of Assisted Living in 2025 – And How Families Are Paying For It

Understanding Senior Living Costs: Pricing Models, Discounts & Financial Assistance

Financial Aid for Texas Seniors

Get financial aid guidance

Community Care for the Aged and Disabled (CCAD)

TX Medicaid CCAD

Age 65+ or disabled, Texas resident, Medicaid-eligible, care need (not always nursing home level).

~$2,829/month (300% FBR, individual).

$2,000 (individual), $3,000 (couple).

Large state; rural access challenges.

Texas Community Care Services

TX CCS

Age 60+, Texas resident, at risk of decline.

~$2,000/month (individual, varies).

$5,000 (individual).

Limited funding; high demand in urban areas.

Area Agency on Aging (AAA) Services

Texas AAA Services

Age 60+, TX resident; no income/asset limits.

None; donations encouraged.

Not assessed.

28 AAAs; includes Meals on Wheels in some areas.

Medicare Savings Program (MSP)

Texas Medicare Savings Program

Age 65+ or disabled, TX resident, Medicare Part A/B.

~$2,510/month (QMB), ~$3,380/month (SLMB), ~$3,598/month (QI)—individual.

$9,430 (individual), $14,130 (couple).

Includes Extra Help for Part D; no waitlist.

Low-Income Home Energy Assistance Program (LIHEAP)

Texas Comprehensive Energy Assistance Program (CEAP)

Age 60+ prioritized, TX resident, low-income.

~$3,970/month (185% FPL).

Not assessed.

Priority for elderly/disabled; covers gas, electric, propane.

Family Caregiver Support Program (FCSP)

Texas Family Caregiver Support Program

Caregivers of 60+ needing care or 55+ caregivers of others; TX resident; 2+ ADLs.

No strict cap; prioritizes low-income (~$24,980/year).

Not assessed.

High rural demand; includes grandparent caregivers.

Senior Community Service Employment Program (SCSEP)

Texas SCSEP

Age 55+, unemployed, low-income, TX resident.

~$1,983/month (125% FPL).

Not specified.

Priority for veterans, rural residents; AARP partnership.

VA Aid and Attendance (A&A) and Housebound Benefits

Texas VA Aid and Attendance/Housebound

Age 65+ or disabled veteran/spouse, TX resident, wartime service, ADL help (A&A) or homebound.

Net income < ~$1,984/month (veteran with dependent, A&A); pension offsets income.

~$155,356 (net worth).

High veteran population; supports rural/urban needs.

Property Tax Exemption for Seniors

Texas Senior Property Tax Exemption

Age 65+, TX resident, homeowner (homestead).

None; tax-based eligibility.

Not assessed.

$25,000+ exemption; optional freeze in some counties; saves ~$500-$1,000/year.

Senior Farmers’ Market Nutrition Program (SFMNP)

Texas SFMNP

Age 60+, TX resident, low-income.

~$2,322/month (185% FPL).

Not assessed.

Vouchers (~$50/season); serves ~20,000 via 28 AAAs.

Tour Icon
Planning a tour? Check our touring checklist.
Chat Icon
Thinking of living here? We can help you speak to a current resident