Jourdanton Nursing and Rehab
Nursing Home, Skilled Nursing & Hospice Care · Jourdanton, TX
CMS overall rating Info The Overall CMS Rating is scored from 1 to 5 stars and combines results from health inspections, staffing levels, and quality measures. Health inspections carry the most weight. Staffing and quality scores can increase or decrease the final rating based on performance compared to state and national standards.

Jourdanton Nursing and Rehab

Nursing Home, Skilled Nursing & Hospice Care · Jourdanton, TX
CMS overall rating Info The Overall CMS Rating is scored from 1 to 5 stars and combines results from health inspections, staffing levels, and quality measures. Health inspections carry the most weight. Staffing and quality scores can increase or decrease the final rating based on performance compared to state and national standards.
Calculator: See prices in your area
Jourdanton Nursing and Rehab accepts Medicare, Medicaid, and private pay.

Overview of Jourdanton Nursing and Rehab

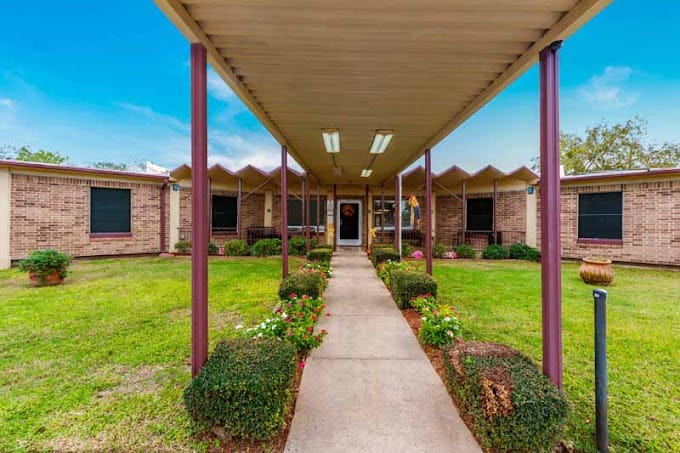
Jourdanton Nursing and Rehab based in Jourdanton, TX, prioritizes seniors’ wellness and provides diverse care options including skilled nursing, rehabilitation therapy, and long- and short-term care. The community also offers physical, occupational, and speech therapy and other care services to ensure seniors are well-taken care of. Keep worries at bay and experience exceptional care and support from a kind, reliable, and well-trained team.

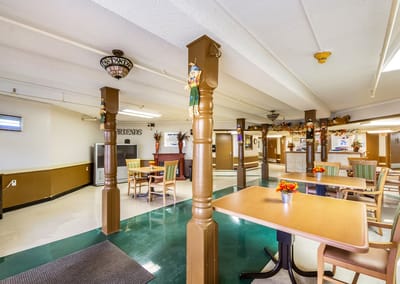
The community aims to improve seniors’ quality of life by collaborating to create care plans that perfectly suit their specific needs. Social activities are conducted to encourage residents to interact and meet people with the same interests. Jourdanton Nursing and Rehab goes above and beyond in helping seniors achieve optimal wellness to live their golden years wholly.

(830) 769-3531

Quality ratings

Measured by Centers for Medicare & Medicaid Services (CMS)

Overall rating Info The Overall CMS Rating combines results from health inspections, staffing levels and quality measures. Health inspections carry the most weight. Staffing and quality scores can increase or decrease the final rating based on performance compared to state and national standards.
▲ 7.4% Above TX avg. ▲ 7.4% Above TX avg.Click the badge to see the full State ranking.Click here to see the full State ranking.
Health Inspection Info Based on the results of the facility's three most recent standard inspections and any complaint investigations. CMS reviews the number, scope, and severity of deficiencies, with more recent findings weighted more heavily.
▲ 44.7% Above TX avg. ▲ 44.7% Above TX avg.Click the badge to see the full State ranking.Click here to see the full State ranking.
Staffing Info Measures average nursing staff hours per resident per day, including Registered Nurses (RNs) and total nursing staff. Ratings are adjusted based on the level of care residents require and are compared to state and national benchmarks.
▼ 52.9% Below TX avg. ▼ 52.9% Below TX avg.Click the badge to see the full State ranking.Click here to see the full State ranking.
Quality Measures Info Based on clinical and physical health indicators reported to CMS, such as hospital readmissions, falls, pressure ulcers, and improvements in mobility. These measures reflect how well residents' health needs are being managed.
▼ 46.7% Below TX avg. ▼ 46.7% Below TX avg.Click the badge to see the full State ranking.Click here to see the full State ranking.

Staffing hours breakdown

Info Daily nursing hours per resident by staff type, reported to CMS. Higher is generally better — compare this facility to state and national averages to see where staffing stands.

Hours per resident per day — compared to Texas state averages

Total nursing care / resident Info This home is ranked 186th out of 237 homes in Texas.

Total adjusted nursing hours per resident per day, combining RN, LPN, and aide time. CMS adjusts this for case-mix so facilities can be fairly compared.
3h 4m per day
Rank #186 / 237Nurse hours — State benchmarkedThis home is ranked 186th out of 237 homes in Texas.Shows adjusted nurse hours per resident per day benchmarked to the Texas average, with a ranking across 237 Texas SNFs. More hours mean more direct care. The national average is about 3.5 hrs; below 3.0 is a red flag.Click the rank badge to see the full State ranking.Click here to see the full State ranking.
This facility Texas avg (3h 38m per day)
vs Texas avg
-16%

4 of 6 metrics below state avg

Standout metric Physical Therapist is +75% above state avg
Staff typeHours / Day / Residentvs state avg
Registered Nurse (RN) Info RNs hold the highest nursing license and can assess residents, interpret test results, and direct care plans. More RN hours per day often signals stronger clinical oversight and faster response to health changes. 24m per day ▼ 8% State avg: 26m per day · National avg: 41m per day
LPN / LVN Info Licensed Practical Nurses (LPNs) or Licensed Vocational Nurses (LVNs) deliver routine hands-on care — medication administration, wound dressing, and monitoring vital signs. They work under RN supervision and make up a large share of daily bedside care. 57m per day ■ Avg State avg: 57m per day · National avg: 52m per day
Nurse Aide Info Certified Nurse Aides (CNAs) provide the most direct day-to-day assistance: bathing, dressing, feeding, and mobility. Nurse aide hours are typically the largest staffing category and directly affect residents' quality of life. 1h 40m per day ▼ 17% State avg: 2h 1m per day · National avg: 2h 21m per day
Total Nursing (Weekend) Info Combined nursing hours (RN + LPN + Nurse Aide) per resident per day on weekends. Staffing often drops on weekends — this figure reveals whether the facility maintains adequate coverage outside of weekday hours. 2h 4m per day ▼ 31% State avg: 2h 59m per day · National avg: 3h 26m per day
Physical Therapist Info Hours per resident per day provided by licensed Physical Therapists (PTs) or PT Assistants. PT services help residents recover mobility after injury or illness and are especially important for post-acute (short-stay) rehabilitation. 7m per day ▲ 75% State avg: 4m per day · National avg: 4m per day
RN (Weekend) Info Registered nurse hours specifically on weekends. Facilities sometimes reduce RN presence on Saturdays and Sundays — a low weekend RN figure compared to weekday hours can indicate reduced clinical oversight when most administrative staff are absent. 13m per day ▼ 38% State avg: 21m per day · National avg: 29m per day

Capacity and availability

This home usually has availability

Occupancy lower than 85% suggests more openings may be available.

Higher occupancy than the Texas average: 63.5%
Occupancy rate 69.6% Rank #115 / 248Occupancy rate — State benchmarkedThis home is ranked 115th out of 248 homes in Texas.Shows this facility's occupancy rate versus the Texas average, with its Statewide rank out of 248. Higher occupancy signals strong local demand and financial stability.Click the rank badge to see the full State ranking.Click here to see the full State ranking.
Avg. Length of Stay 341 days
Occupancy rate
69.6% Rank #115 / 248Occupancy rate — State benchmarkedThis home is ranked 115th out of 248 homes in Texas.Shows this facility's occupancy rate versus the Texas average, with its Statewide rank out of 248. Higher occupancy signals strong local demand and financial stability.Click the rank badge to see the full State ranking.Click here to see the full State ranking.
Avg. Length of Stay
341 days

Who this home usually serves

TYPE OF STAY

Mostly short-term rehab stays

Most residents typically stay for a few weeks or months before returning home or moving on.

Breakdown by payment type

Medicare

40% of new residents, usually for short-term rehab.

Typical stay 29 days

Private pay

31% of new residents, often for short stays.

Typical stay 1 - 2 months

Medicaid

29% of new residents, often for long-term daily care.

Typical stay 2 - 3 years

Finances and operations

Governmental community
Operated by state authorities.
Home revenue
$3.3M
Operating deficit
-$2
Governmental community Operated by state authorities.
Home revenue
$3.3M Rank #245 / 248Revenue — State benchmarkedThis home is ranked 245th out of 248 homes in Texas.Shows this facility's annual revenue compared to the Texas SNF average. Higher revenue generally means more resources for staffing and capital — read alongside Payroll %.Click the rank badge to see the full State ranking.Click here to see the full State ranking.
Operating deficit
-$2
Payroll costs Info The portion of the home's budget spent on staff, including nurses, caregivers, and other employees who support care and operations. Rank #246 / 248Payroll — State benchmarkedThis home is ranked 246th out of 248 homes in Texas.Shows total annual staff payroll benchmarked to the Texas average. Higher payroll investment relative to peers often signals better staffing and less reliance on cheaper contract labor.Click the rank badge to see the full State ranking.Click here to see the full State ranking.
$1.6M
47.3% of revenue Rank #108 / 248Payroll % — State benchmarkedThis home is ranked 108th out of 248 homes in Texas.Shows payroll as a percentage of revenue versus the Texas average. Well-run Texas SNFs typically land around 51–63% — the top third Statewide. Below 25% may signal understaffing or heavy agency use — read with Staffing ratings.Click the rank badge to see the full State ranking.Click here to see the full State ranking.
Other operating costs Info All remaining costs needed to run the home, such as food, utilities, building maintenance, supplies and administrative expenses.
$1.8M
Total costs $3.3M
Walk Score
Walk Score: 38 / 100 Rank #155 / 246Walk Score — State benchmarkedThis home is ranked 155th out of 246 homes in Texas.Shows how walkable this facility's neighborhood is compared to the average Walk Score across Texas SNFs. Higher scores benefit residents, families, and staff.Click the rank badge to see the full State ranking.Click here to see the full State ranking.
Somewhat walkable. A few nearby services may be reachable on foot, but most trips require transportation.

What does this home offer?

Building type icon
Building type icon

Building Type: Single-story

Fitness and recreation icon

Fitness and Recreation

Types of Care at Jourdanton Nursing and Rehab

Skilled Nursing Hospice Care

Contact Jourdanton Nursing and Rehab

Health Inspection History

Inspections Since 2022
Total health inspections 7

Texas average 7.4


Last Health inspection on Jul 2025

Total health citations
21 Rank #124 / 240Health citations — State benchmarkedThis home is ranked 124th out of 240 homes in Texas.Shows this facility's total health deficiency citations benchmarked to the Texas State average, with a ranking across all 240 TX SNFs. Lower citation counts earn a better rank.Click the rank badge to see the full State ranking.Click here to see the full State ranking.

Texas average 25.9

Citations per inspection
3 Rank #104 / 240Citations per inspection — State benchmarkedThis home is ranked 104th out of 240 homes in Texas.Shows average deficiency citations per CMS inspection for this facility versus the Texas mean across 240 SNFs with citation data. Lower is better.Click the rank badge to see the full State ranking.Click here to see the full State ranking.

Texas average 3.67


Health citations are formal notices following inspections when they fail to comply with safety and care standards.

13 of 21 citations resulted from standard inspections; 6 of 21 resulted from complaint investigations; and 2 of 21 came from combined inspections (standard and complaint).

Breakdown of citation severity (last 4 years)
Critical Health citations
2
In line with Texas average

Texas average: 2


Serious Health citations
0
100% better than Texas average

Texas average: 0.4

2 critical citations Texas average: 2

0 serious citations Texas average: 0.4

17 moderate citations Texas average: 23

2 minor citations Texas average: 0.4
Citations history (last 4 years)
Abuse/Neglect moderate citation Jul 10, 2025
Corrected

Pharmacy moderate citation Jul 10, 2025
Corrected

Care Planning moderate citation Jul 10, 2025
Corrected

Care Planning moderate citation Mar 24, 2025
Corrected

Financial Assistance for
Nursing Home in Texas

Jourdanton Nursing and Rehab is located in Jourdanton, Texas.
Here are the financial assistance programs available to residents in Texas.

Get Financial aid guidance

Community Care for the Aged and Disabled (CCAD)

TX Medicaid CCAD

Age 65+ or disabled
General Texas resident, Medicaid-eligible, care need (not always nursing home level).
Income Limits (2025) ~$2,829/month 300% FBR, individual
Asset Limits $2,000 (individual), $3,000 (couple).
TX

Large state; rural access challenges.

Benefits
Personal care (5-7 hours/day) Respite (240 hours/year) Adult day care (~$60/day) Home aides

Texas Community Care Services

TX CCS

Age 60+
General Texas resident, at risk of decline.
Income Limits ~$2,000/month individual, varies
Asset Limits $5,000 individual
TX

Limited funding; high demand in urban areas.

Benefits
In-home care (3-5 hours/week) Respite (up to 10 days/year) Transportation (~5 trips/month)

Area Agency on Aging (AAA) Services

Texas AAA Services

Age 60+
General TX resident; no income/asset limits.
Income Limits (2025) None; donations encouraged.
Asset Limits Not assessed.
TX

28 AAAs; includes Meals on Wheels in some areas.

Benefits
Meals (~$5-$7/meal) Transportation Homemaker services (~4 hours/week) Respite (~5 days/year) Legal aid

Medicare Savings Program (MSP)

Texas Medicare Savings Program

Age 65+ or disabled
General TX resident, Medicare Part A/B.
Income Limits (2025) ~$2,510/month (QMB), ~$3,380/month (SLMB), ~$3,598/month (QI)—individual.
Asset Limits $9,430 (individual), $14,130 (couple).
TX

Includes Extra Help for Part D; no waitlist.

Benefits
Covers Part B premiums ($174.70/month) Deductibles ($240/year) Copays (~20%)

Family Caregiver Support Program (FCSP)

Texas Family Caregiver Support Program

Age
General Caregivers of 60+ needing care or 55+ caregivers of others; TX resident; 2+ ADLs.
Income Limits (2025) No strict cap; prioritizes low-income ~$24,980/year
Asset Limits Not assessed.
TX

High rural demand; includes grandparent caregivers.

Benefits
Respite (4-6 hours/week or 5 days/year) Adult day care ($60/day) Training Supplies (~$500/year)

VA Aid and Attendance (A&A) and Housebound Benefits

Texas VA Aid and Attendance/Housebound

Age 65+ or disabled veteran/spouse
General TX resident, wartime service, ADL help (A&A) or homebound.
Income Limits (2025) Net income < ~$1,984/month (veteran with dependent, A&A); pension offsets income.
Asset Limits ~$155,356 net worth
TX

High veteran population; supports rural/urban needs.

Benefits
Cash (~$1,433-$2,642/month veteran, ~$951-$1,318 spouse) for care costs

Property Tax Exemption for Seniors

Texas Senior Property Tax Exemption

Age 65+
General TX resident, homeowner (homestead).
Income Limits (2025) None; tax-based eligibility.
Asset Limits Not assessed.
TX

$25,000+ exemption; optional freeze in some counties; saves ~$500-$1,000/year.

Benefits
Tax exemption or freeze (~$500-$1,000/year savings)

Senior Farmers’ Market Nutrition Program (SFMNP)

Texas SFMNP

Age 60+
General TX resident, low-income.
Income Limits (2025) ~$2,322/month 185% FPL
Asset Limits Not assessed.
TX

Vouchers (~$50/season); serves ~20,000 via 28 AAAs.

Benefits
Vouchers (~$50/season) for produce at farmers’ markets

Places of interest near Jourdanton Nursing and Rehab

Address 0.8 miles from city center Info Estimated distance in miles from Jourdanton's city center to Jourdanton Nursing and Rehab's address, calculated via Google Maps. — 0.36 miles to nearest hospital (Camino Real Community Services)

Calculate Travel Distance to Jourdanton Nursing and Rehab

Add your location

Address

Staffing Data

Reporting period: April 1 – June 30, 2025 (Q2 2025). Source: CMS Payroll-Based Journal report.

Total staff 62
Employees 57
Contractors 5
Staff to resident ratio 1.38:1
8% worse than Texas average
Texas average ratio: 1.51:1 Texas average ratio: 1.51:1See full Texas ranking
Avg staff/day 18
Average shift 8.5 hours
5% better than Texas average
Texas average: 8.1 hours Texas average shift: 8.1 hoursSee full Texas ranking
Total staff hours (quarter) 13,872

Nursing staff breakdown

Q2 2025 · Apr 1 – Jun 30 More info This data comes from the CMS Payroll-Based Journal report covering April 1 – June 30, 2025.
Registered Nurse

Manages medical care and health needs.

Total count 4
Average shift length Info Average shift length. Calculated as total hours divided by days worked and average staff per day. 7.2 hours

This role is partially covered by contractors.

Licensed Practical Nurse

Assists with medical care and medications.

Total count 10
Average shift length Info Average shift length. Calculated as total hours divided by days worked and average staff per day. 9.4 hours

No contractors work on this role.

Certified Nursing Assistant

Helps with daily care and mobility.

Total count 22
Average shift length Info Average shift length. Calculated as total hours divided by days worked and average staff per day. 8.8 hours

No contractors work on this role.

Contractor staffing

Q2 2025 · Apr 1 – Jun 30 More info This data comes from the CMS Payroll-Based Journal report covering April 1 – June 30, 2025.

Total hours from contractors

0.8%

108 contractor hours this quarter

Occupational Therapy Aide: 1 Medical Director: 1 Registered Nurse: 1 Occupational Therapy Assistant: 1 Physical Therapy Assistant: 1

Staff by category

Q2 2025 · Apr 1 – Jun 30 More info This data comes from the CMS Payroll-Based Journal report covering April 1 – June 30, 2025.
Certified Nursing Assistant220224,71991100%8.8
Licensed Practical Nurse100103,11191100%9.4
Qualified Social Worker4041,1967582%7.6
Clinical Nurse Specialist2029706470%7.9
Medication Aide/Technician1017827077%11.2
Other Dietary Services Staff1015366470%8.4
Speech Language Pathologist2024986571%6.7
Respiratory Therapy Technician2024835662%8.6
Administrator2024165257%8
Mental Health Service Worker1012923842%7.7
Registered Nurse3142733741%7.2
Nurse Practitioner1012162730%8
Physical Therapy Aide3031832527%6.3
Nurse Aide in Training30397910%9.7
Occupational Therapy Aide0115289%6.5
Medical Director011242123%1.1
Occupational Therapy Assistant0111833%6
Physical Therapy Assistant011822%4
22 Certified Nursing Assistant
% of Days 100%
10 Licensed Practical Nurse
% of Days 100%
4 Qualified Social Worker
% of Days 82%
2 Clinical Nurse Specialist
% of Days 70%
1 Medication Aide/Technician
% of Days 77%
1 Other Dietary Services Staff
% of Days 70%
2 Speech Language Pathologist
% of Days 71%
2 Respiratory Therapy Technician
% of Days 62%
2 Administrator
% of Days 57%
1 Mental Health Service Worker
% of Days 42%
4 Registered Nurse
% of Days 41%
1 Nurse Practitioner
% of Days 30%
3 Physical Therapy Aide
% of Days 27%
3 Nurse Aide in Training
% of Days 10%
1 Occupational Therapy Aide
% of Days 9%
1 Medical Director
% of Days 23%
1 Occupational Therapy Assistant
% of Days 3%
1 Physical Therapy Assistant
% of Days 2%

Facility Characteristics

Source: CMS Long-Term Care Facility Characteristics (Data as of Jan 2026)

Total residents 45
Medicare
3
6.7% of residents
Medicaid
42
93.3% of residents
Programs & Services
Residents Group

Residents meet regularly to discuss policies, care quality, and activities

Active Resident Council

Organized group of residents that meets regularly to discuss facility policies, quality of life, and activities.

Quality of care over time

These measures show how residents usually do over time at this home, based on health outcomes and preventive care.

High-risk clinical events score Info A composite score based on pressure ulcers, falls with injury, weight loss, walking ability decline, and activities of daily living decline. 8.8
In line with Texas average

Texas average: 8.6

Functional decline score Info A composite score based on activities of daily living decline, walking ability decline, and incontinence. 13.0
19% better than Texas average

Texas average: 16.0

Long-stay resident measures
Average Texas avg: 4.1 Info CMS star rating based on long-stay quality measure performance. 5 stars = significantly above average, 1 star = significantly below average.
Need for Help with Daily Activities Increased Info Percent of long-stay residents whose need for help with daily activities has increased 14.2%
12% better than Texas average

Texas average: 16.2%

Walking Ability Worsened Info Percent of long-stay residents whose ability to move independently worsened 10.1%
38% better than Texas average

Texas average: 16.2%

Low Risk Residents with Bowel/Bladder Incontinence Info Percent of low risk long-stay residents who lose control of their bowels or bladder 14.7%
6% better than Texas average

Texas average: 15.7%

Falls with Major Injury Info Percent of long-stay residents experiencing one or more falls with major injury 5.5%
69% worse than Texas average

Texas average: 3.2%

High Risk Residents with Pressure Ulcers Info Percent of long-stay high risk residents with pressure ulcers 6.9%
55% worse than Texas average

Texas average: 4.4%

Urinary Tract Infection Info Percent of long-stay residents with a urinary tract infection 1.9%
134% worse than Texas average

Texas average: 0.8%

Lost Too Much Weight Info Percent of long-stay residents who lose too much weight 7.4%
114% worse than Texas average

Texas average: 3.5%

Depressive Symptoms Info Percent of long-stay residents who have depressive symptoms 6.4%
123% worse than Texas average

Texas average: 2.9%

Antipsychotic Use Info Percent of long-stay residents who received an antipsychotic medication 16.3%
107% worse than Texas average

Texas average: 7.9%

Pneumococcal Vaccine Info Percent of long-stay residents assessed and appropriately given the pneumococcal vaccine 100.0%
In line with Texas average

Texas average: 97.3%

Influenza Vaccine Info Percent of long-stay residents assessed and appropriately given the seasonal influenza vaccine 100.0%
In line with Texas average

Texas average: 97.9%

Hospitalizations per 1,000 days Info Number of hospitalizations per 1,000 long-stay resident days. 1.82
15% better than Texas average

Texas average: 2.13

ED visits per 1,000 days Info Number of outpatient emergency department visits per 1,000 long-stay resident days. 3.48
68% worse than Texas average

Texas average: 2.07

Short-stay resident measures
Significantly below average Texas avg: 3.1 Info CMS star rating based on short-stay quality measure performance. 5 stars = much above average, 1 star = much below average.
Pneumococcal Vaccine Info Percent of short-stay residents assessed and appropriately given the pneumococcal vaccine 100.0%
11% better than Texas average

Texas average: 90.4%

Antipsychotic medication increase Info Percent of short-stay residents who newly received an antipsychotic medication 0.0%
100% better than Texas average

Texas average: 1.4%

Re-hospitalized after SNF stay Info Percentage of short-stay residents who were re-hospitalized after their nursing home admission. 42.3%
63% worse than Texas average

Texas average: 25.9%

Emergency department visits Info Percentage of short-stay residents who had an outpatient emergency department visit. 21.2%
77% worse than Texas average

Texas average: 12.0%

Falls with major injury Info Percentage of SNF residents who experience falls with major injury during their stay. 4.2%
442% worse than Texas average

Texas average: 0.8%

Penalties and fines

Federal penalties imposed by CMS for regulatory violations, including civil money penalties (fines) and denials of payment for new Medicare/Medicaid admissions.

Source: CMS Penalties Database (Data as of Jan 2026)

Total fines amount $28K Rank #135 / 242Federal fines — State benchmarkedThis home is ranked 135th out of 242 homes in Texas.Shows this facility's cumulative CMS federal fine dollars versus the Texas average among facilities with fines, and where it ranks among 242 skilled nursing facilities in the pool. Lower total dollars mean a better rank.Click the rank badge to see the full State ranking.Click here to see the full State ranking.
65% lower than Texas average

Texas average: $80K

Number of fines 2
20% fewer fines than Texas average

Texas average: 2.5

Payment Denials Info Serious action where Medicare and/or Medicaid temporarily stops payments for new residents until issues are fixed. 0
100% fewer payment denials than Texas average

Texas average: 0.2

Fines amount comparison
This facility $28K
Texas average $80K
Penalty History

Penalties are imposed by CMS for violations of federal nursing home regulations.

2 penalties in the past 3 years

Multiple penalties were reported in the last 3 years.

Civil Money Penalty Info Fines imposed for noncompliance, which can be assessed per day or per instance of violation. Oct 4, 2024
$15K
Civil Money Penalty Info Fines imposed for noncompliance, which can be assessed per day or per instance of violation. Jun 19, 2024
$14K

Last updated: Jan 2026

Guides for Better Senior Living

Care Cost Calculator: See Prices in Your Area

Nursing Home Data Explorer

Don’t Wait Too Long: 7 Red Flag Signs Your Parent Needs Assisted Living Now

The True Cost of Assisted Living in 2025 – And How Families Are Paying For It

Understanding Senior Living Costs: Pricing Models, Discounts & Financial Assistance

Frequently Asked Questions about Jourdanton Nursing and Rehab

Is Jourdanton Nursing and Rehab in a walkable area?

Jourdanton Nursing and Rehab has a walk score of 38. Somewhat walkable. A few nearby services may be reachable on foot, but most trips require transportation.

What is the phone number of Jourdanton Nursing and Rehab?

(830) 769-3531 will put you in contact with the team at Jourdanton Nursing and Rehab.

Is Jourdanton Nursing and Rehab Medicare or Medicaid certified?

Yes — Jourdanton Nursing and Rehab is a CMS-certified provider of Medicare and Medicaid.

Explore Open Rooms
1 Contact details
2 What type of senior care service are you looking for?
3 What budget do you have in mind for senior care?
4 How soon do you need to find care?
5 Additional details

Thank you for your interest!

Our team will be in touch shortly to help with next steps.