Judson Park
Nursing Home, Assisted Living, Hospice Care, Independent Living & Memory Care · Cleveland, OH
CMS overall rating Info CMS (the Centers for Medicare & Medicaid Services) is the federal agency that rates nursing home quality. Its Overall Rating runs from 1 to 5 stars, combining health inspections, staffing, and quality measures, with inspections weighted most heavily.

Judson Park

Nursing Home, Assisted Living, Hospice Care, Independent Living & Memory Care · Cleveland, OH
CMS overall rating Info CMS (the Centers for Medicare & Medicaid Services) is the federal agency that rates nursing home quality. Its Overall Rating runs from 1 to 5 stars, combining health inspections, staffing, and quality measures, with inspections weighted most heavily.
Calculator: See prices in your area
Judson Park accepts Medicare and private pay.

Overview of Judson Park

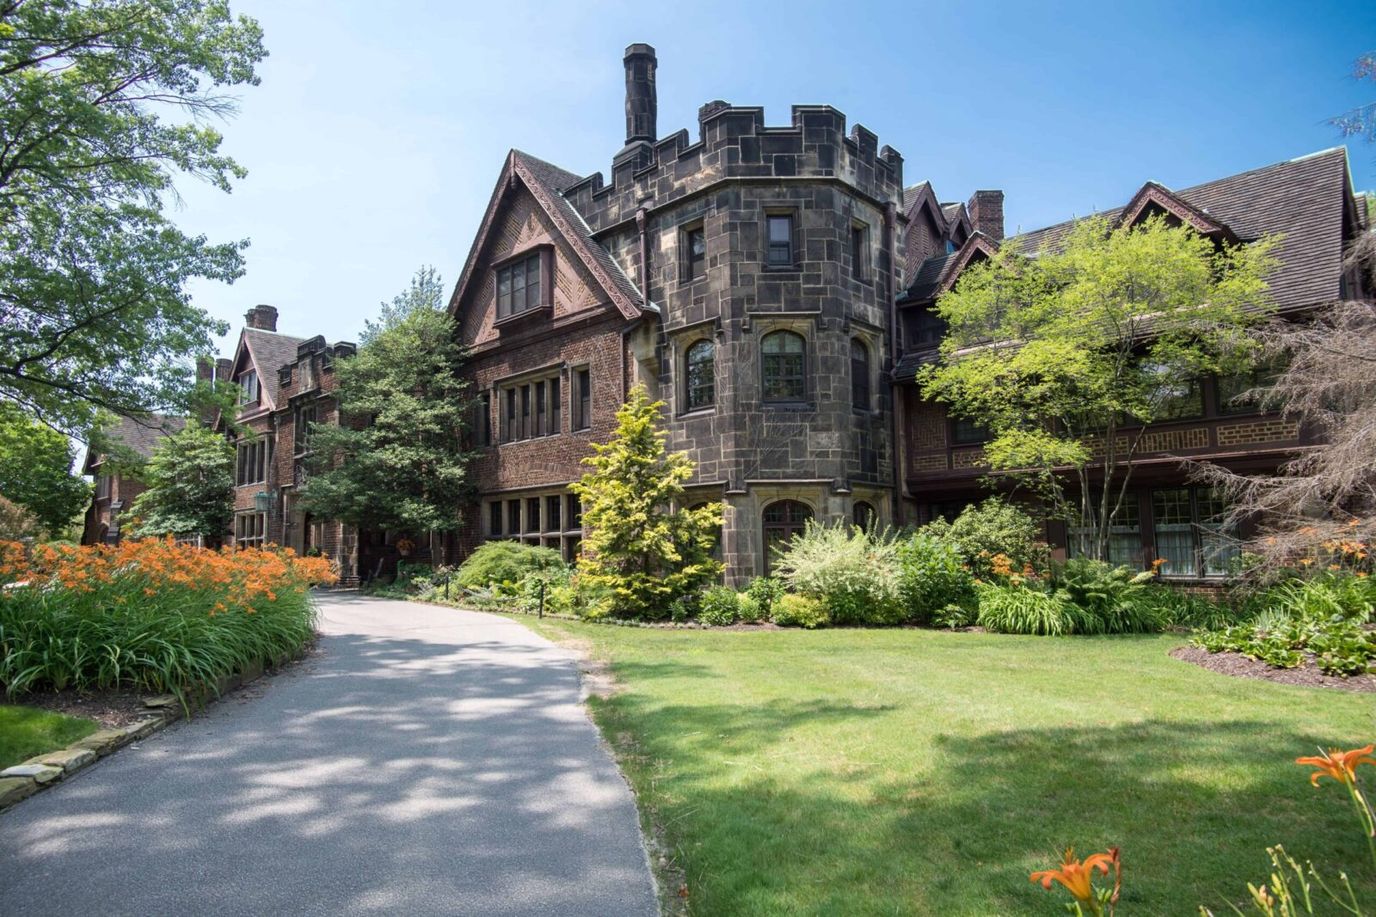
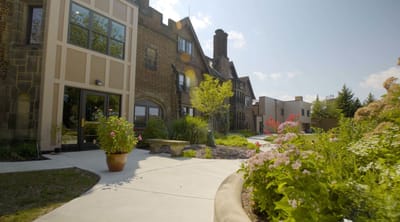
Nestled in the serene, tree-lined streets of Cleveland Heights, Ohio, Judson Park is a vibrant and inviting retirement community embodying tranquility and warmth. Offering a diverse range of senior care services tailored to individual lifestyles, Judson Park is a haven for those seeking a fulfilling and engaging retirement experience, with living options including Independent Living, Assisted Living, and Memory Care. The amenities and services at Judson Park are thoughtfully curated to enhance residents’ lives, offering a picturesque blend of tranquility and cultural energy as the community overlooks Cleveland’s skyline.

Residents at Judson Park relish the freedom to shape their way of living while also benefiting from comprehensive healthcare services when needed. The community facilitates independent living with personalized care and support, ensuring residents maintain their autonomy while receiving the necessary assisted living services. For individuals grappling with Alzheimer’s or other forms of dementia, Judson Park establishes a secure memory care community, enveloping residents in a warm and welcoming atmosphere that encourages engagement and provides tailored support. Located just minutes away from University Circle, residents enjoy access to a rich tapestry of art, music, education, and philanthropic attractions. The quiet residential neighborhood of Chestnut Hills serves as a serene backdrop for this senior living oasis, allowing residents to experience a genuinely engaging lifestyle in the historic community of Cleveland Heights.

Quality ratings

Measured by Centers for Medicare & Medicaid Services (CMS)

Overall rating Info The Overall CMS Rating combines results from health inspections, staffing levels and quality measures. Health inspections carry the most weight. Staffing and quality scores can increase or decrease the final rating based on performance compared to state and national standards.
▲ 57.1% Above OH avg. ▲ 57.1% Above OH avg.OH average: 3.2Click the badge to see the full State ranking.Click here to see the full State ranking.
Health Inspection Info Based on the results of the facility's three most recent standard inspections and any complaint investigations. CMS reviews the number, scope, and severity of deficiencies, with more recent findings weighted more heavily.
▲ 42.8% Above OH avg. ▲ 42.8% Above OH avg.OH average: 2.8Click the badge to see the full State ranking.Click here to see the full State ranking.
Staffing Info Measures average nursing staff hours per resident per day, including Registered Nurses (RNs) and total nursing staff. Ratings are adjusted based on the level of care residents require and are compared to state and national benchmarks.
▲ 63.8% Above OH avg. ▲ 63.8% Above OH avg.OH average: 2.4Click the badge to see the full State ranking.Click here to see the full State ranking.
Quality Measures Info Based on clinical and physical health indicators reported to CMS, such as hospital readmissions, falls, pressure ulcers, and improvements in mobility. These measures reflect how well residents' health needs are being managed.
▲ 14.7% Above OH avg. ▲ 14.7% Above OH avg.OH average: 4.4Click the badge to see the full State ranking.Click here to see the full State ranking.

Staffing hours breakdown

Info Daily nursing hours per resident by staff type, reported to CMS. Higher is generally better — compare this facility to state and national averages to see where staffing stands.

Hours per resident per day — compared to Ohio state averages

Total nursing care / resident Info This home is ranked 2nd out of 210 homes in Ohio for nurse hours. Total adjusted nursing hours per resident per day, combining RN, LPN, and aide time. CMS adjusts this for case-mix so facilities can be fairly compared.
6h 32m per day
Rank #2 / 210Nurse hours — State benchmarkedThis home is ranked 2nd out of 210 homes in Ohio. Shows adjusted nurse hours per resident per day benchmarked to the Ohio average, with a ranking across 210 Ohio facilities. More hours mean more direct care. The national average is about 3.5 hrs; below 3.0 is a red flag.Rankings are based only on facilities in Ohio that report data for that category. Facilities without available data are excluded from the ranking.Click the rank badge to see the full State ranking.Click here to see the full State ranking.
This facility Ohio avg (3h 32m per day)
vs Ohio avg
+84%

2 of 6 metrics below state avg

Standout metric LPN / LVN is +322% above state avg
Staff typeHours / Day / Residentvs state avg
Registered Nurse (RN) Info RNs hold the highest nursing license and can assess residents, interpret test results, and direct care plans. More RN hours per day often signals stronger clinical oversight and faster response to health changes. 1h 15m per day ▲ 97% State avg: 38m per day · National avg: 41m per day
LPN / LVN Info Licensed Practical Nurses (LPNs) or Licensed Vocational Nurses (LVNs) deliver routine hands-on care — medication administration, wound dressing, and monitoring vital signs. They work under RN supervision and make up a large share of daily bedside care. 4h 4m per day ▲ 322% State avg: 58m per day · National avg: 52m per day
Nurse Aide Info Certified Nurse Aides (CNAs) provide the most direct day-to-day assistance: bathing, dressing, feeding, and mobility. Nurse aide hours are typically the largest staffing category and directly affect residents' quality of life. 2h 25m per day ▲ 14% State avg: 2h 7m per day · National avg: 2h 20m per day
Weekend Total Nursing Info Combined nursing hours (RN + LPN + Nurse Aide) per resident per day on weekends. Staffing often drops on weekends — this figure reveals whether the facility maintains adequate coverage outside of weekday hours. 6h 7m per day ▲ 84% State avg: 3h 20m per day · National avg: 3h 27m per day
Physical Therapist Info Hours per resident per day provided by licensed Physical Therapists (PTs) or PT Assistants. PT services help residents recover mobility after injury or illness and are especially important for post-acute (short-stay) rehabilitation. 0m per day ▼ 100% State avg: 3m per day · National avg: 4m per day
Weekend RN Info Registered nurse hours specifically on weekends. Facilities sometimes reduce RN presence on Saturdays and Sundays — a low weekend RN figure compared to weekday hours can indicate reduced clinical oversight when most administrative staff are absent. 24m per day ▼ 7% State avg: 25m per day · National avg: 29m per day

Capacity and availability

This home usually has availability

Lower occupancy than the Ohio average: 78.7%
Occupancy rate
61.7% Rank #188 / 211Occupancy rate — State benchmarkedThis home is ranked 188th out of 211 homes in Ohio. Shows this facility's occupancy rate versus the Ohio average, with its Statewide rank out of 211. Higher occupancy signals strong local demand and financial stability.Rankings are based only on facilities in Ohio that report data for that category. Facilities without available data are excluded from the ranking.Click the rank badge to see the full State ranking.Click here to see the full State ranking.
Avg. Length of Stay
35 days
Bed community size
36-bed community Rank #273 / 323Bed count — State benchmarkedThis home is ranked 273rd out of 323 homes in Ohio. Shows this facility's certified or reported bed count compared to other Ohio facilities. Larger communities may offer more amenities, programs, and on-site services for residents and families.Rankings are based only on facilities in Ohio that report data for that category. Facilities without available data are excluded from the ranking.Click the rank badge to see the full State ranking.Click here to see the full State ranking.
A moderately sized community that may balance personal attention with shared amenities and social activities.
Walk Score
Walk Score: 65 / 100 Rank #107 / 705Walk Score — State benchmarkedThis home is ranked 107th out of 705 homes in Ohio. Shows how walkable this facility's neighborhood is compared to the average Walk Score across Ohio facilities. Higher scores benefit residents, families, and staff.Rankings are based only on facilities in Ohio that report data for that category. Facilities without available data are excluded from the ranking.Click the rank badge to see the full State ranking.Click here to see the full State ranking.
Moderately walkable. Some errands can be accomplished on foot, with a mix of nearby amenities.

Contact Judson Park

Staffing Data

Reporting period: October 1 – December 31, 2025 (Q4 2025). Source: CMS Payroll-Based Journal report.

Total staff 212
Employees 59
Contractors 153
Staff to resident ratio 8.83 : 1
334% more staff per resident than Ohio average
Ohio average ratio: 2.04 : 1 Ohio average ratio: 2.04 : 1See full Ohio ranking
Avg staff/day 31
Average shift 7.6 hours
6% worse than Ohio average
Ohio average: 8.1 hours Ohio average shift: 8.1 hoursSee full Ohio ranking
Total staff hours (quarter) 21,675

Nursing staff breakdown

Q4 2025 · Oct 1 – Dec 31 More info This data comes from the CMS Payroll-Based Journal report covering October 1 – December 31, 2025.
Registered Nurse

Manages medical care and health needs.

RN Staff Info 7 total: 5 full-time employees and 2 contractors. 7
Average shift length Info Average shift length. Calculated as total hours divided by days worked and average staff per day. 8.7 hours
Licensed Practical Nurse

Assists with medical care and medications.

LPN Staff Info 73 total: 33 full-time employees and 40 contractors. 73
Average shift length Info Average shift length. Calculated as total hours divided by days worked and average staff per day. 9.9 hours
Certified Nursing Assistant

Helps with daily care and mobility.

CNA Staff Info 119 total: 8 full-time employees and 111 contractors. 119
Average shift length Info Average shift length. Calculated as total hours divided by days worked and average staff per day. 7.1 hours

Contractor staffing

Q4 2025 · Oct 1 – Dec 31 More info This data comes from the CMS Payroll-Based Journal report covering October 1 – December 31, 2025.

Total hours from contractors

14.2%

3,076 contractor hours this quarter

Certified Nursing Assistant: 111 Licensed Practical Nurse: 40 Registered Nurse: 2

Staff by category

Q4 2025 · Oct 1 – Dec 31 More info This data comes from the CMS Payroll-Based Journal report covering October 1 – December 31, 2025.
Licensed Practical Nurse33407310,74992100%9.9
Certified Nursing Assistant81111195,88892100%7.1
Registered Nurse5271,9129098%8.7
Dietitian4041,2547784%8.3
Clinical Nurse Specialist2029046470%8
Nurse Practitioner1014886166%8
Nurse Aide in Training1014806065%8
Administrator50506672%
73 Licensed Practical Nurse
% of Days 100%
119 Certified Nursing Assistant
% of Days 100%
7 Registered Nurse
% of Days 98%
4 Dietitian
% of Days 84%
2 Clinical Nurse Specialist
% of Days 70%
1 Nurse Practitioner
% of Days 66%
1 Nurse Aide in Training
% of Days 65%
5 Administrator
% of Days 72%

Penalties and fines

Includes penalties issued in 2024

Federal penalties imposed by CMS for regulatory violations, including civil money penalties (fines) and denials of payment for new Medicare/Medicaid admissions.

Source: CMS Penalties Database (Data as of Jan 2026)

Total fines amount $26K Rank #169 / 211Federal fines — State benchmarkedThis home is ranked 169th out of 211 homes in Ohio. Shows this facility's cumulative CMS federal fine dollars versus the Ohio average among facilities with fines, and where it ranks among 211 facilities in the pool. Lower total dollars mean a better rank.Rankings are based only on facilities in Ohio that report data for that category. Facilities without available data are excluded from the ranking.Click the rank badge to see the full State ranking.Click here to see the full State ranking.
62% lower than Ohio average

Ohio average: $69K

Number of fines 1
46% fewer fines than Ohio average

Ohio average: 1.9

Payment Denials Info Serious action where Medicare and/or Medicaid temporarily stops payments for new residents until issues are fixed. 0
100% fewer payment denials than Ohio average

Ohio average: 0.5

Fines amount comparison
This facility $26K
Ohio average $69K
Penalty History

Penalties are imposed by CMS for violations of federal nursing home regulations.

1 penalty in the past 3 years

Oct 1, 2024 · $26K

Civil Money Penalty Info Fines imposed for noncompliance, which can be assessed per day or per instance of violation. Oct 1, 2024
$26K

Last updated: Jan 2026

Quality of care over time

These measures show how residents usually do over time at this home, based on health outcomes and preventive care.

High-risk clinical events score Info A composite score based on pressure ulcers, falls with injury, weight loss, walking ability decline, and activities of daily living decline. 6.7
15% worse than Ohio average

Ohio average: 5.8

Functional decline score Info A composite score based on activities of daily living decline, walking ability decline, and incontinence. 12.1
In line with Ohio average

Ohio average: 12.7

Long-stay resident measures
Need for Help with Daily Activities Increased Info Percent of long-stay residents whose need for help with daily activities has increased 5.4%
21% better than Ohio average

Ohio average: 6.8%

Low Risk Residents with Bowel/Bladder Incontinence Info Percent of low risk long-stay residents who lose control of their bowels or bladder 18.8%
15% better than Ohio average

Ohio average: 22.0%

Falls with Major Injury Info Percent of long-stay residents experiencing one or more falls with major injury 0.0%
100% better than Ohio average

Ohio average: 3.4%

High Risk Residents with Pressure Ulcers Info Percent of long-stay high risk residents with pressure ulcers 3.9%
In line with Ohio average

Ohio average: 3.9%

Urinary Tract Infection Info Percent of long-stay residents with a urinary tract infection 4.2%
676% worse than Ohio average

Ohio average: 0.5%

Lost Too Much Weight Info Percent of long-stay residents who lose too much weight 17.5%
183% worse than Ohio average

Ohio average: 6.2%

Depressive Symptoms Info Percent of long-stay residents who have depressive symptoms 2.9%
88% better than Ohio average

Ohio average: 24.0%

Antipsychotic Use Info Percent of long-stay residents who received an antipsychotic medication 16.0%
90% worse than Ohio average

Ohio average: 8.4%

Pneumococcal Vaccine Info Percent of long-stay residents assessed and appropriately given the pneumococcal vaccine 93.3%
In line with Ohio average

Ohio average: 92.4%

Influenza Vaccine Info Percent of long-stay residents assessed and appropriately given the seasonal influenza vaccine 95.5%
In line with Ohio average

Ohio average: 94.5%

Short-stay resident measures
Pneumococcal Vaccine Info Percent of short-stay residents assessed and appropriately given the pneumococcal vaccine 85.5%
10% better than Ohio average

Ohio average: 78.0%

Antipsychotic medication increase Info Percent of short-stay residents who newly received an antipsychotic medication 0.5%
59% better than Ohio average

Ohio average: 1.3%

Influenza Vaccine Info Percent of short-stay residents assessed and appropriately given the seasonal influenza vaccine 66.2%
12% worse than Ohio average

Ohio average: 75.6%

Breakdown by payment type

Medicare

44% of new residents, usually for short-term rehab.

Typical stay 18 days

Private pay

56% of new residents, often for short stays.

Typical stay 1 - 2 months

Facility Characteristics

Source: CMS Long-Term Care Facility Characteristics (Data as of Jan 2026)

Total residents 24
Medicare
5
20.8% of residents
Medicaid
3
12.5% of residents
Private pay or other
16
66.7% of residents
Programs & Services
Residents Group

Residents meet regularly to discuss policies, care quality, and activities

CCRC

Part of a Continuing Care Retirement Community offering multiple care levels

Active Resident Council

Organized group of residents that meets regularly to discuss facility policies, quality of life, and activities.

Finances and operations

Based on CMS SNF Cost Report for fiscal year ending in 12/2023.

Nonprofit
Nonprofit Corporation
Net patient revenue Info Net patient revenue — what the home actually collects for resident care, after contractual allowances, bad debt and discounts are subtracted from its gross charges (CMS cost report, Worksheet G-3). It covers resident care only; money the home earns from other sources is shown separately as "Other income."
$22.8M
Net patient income Info Net patient income: net patient revenue minus the home's total operating expenses. A positive figure means it earns more from resident care than it spends to deliver it; a negative figure means the opposite. It excludes non-operating "other income."
-$9.2M
Nonprofit Nonprofit Corporation
Net patient revenue Info Net patient revenue — what the home actually collects for resident care, after contractual allowances, bad debt and discounts are subtracted from its gross charges (CMS cost report, Worksheet G-3). It covers resident care only; money the home earns from other sources is shown separately as "Other income."
$22.8M Rank #7 / 210Revenue — State benchmarkedThis home is ranked 7th out of 210 homes in Ohio. Shows this facility's annual revenue compared to the Ohio average. Higher revenue generally means more resources for staffing and capital — read alongside Payroll %.Rankings are based only on facilities in Ohio that report data for that category. Facilities without available data are excluded from the ranking.Click the rank badge to see the full State ranking.Click here to see the full State ranking.
Net patient income Info Net patient income: net patient revenue minus the home's total operating expenses. A positive figure means it earns more from resident care than it spends to deliver it; a negative figure means the opposite. It excludes non-operating "other income."
-$9.2M
Other income Info Money the home earns outside of resident care — such as investments, grants, rentals and other non-operating sources (CMS cost report, Worksheet G-3). It is tracked separately from net patient revenue: it is not part of that figure, and it is not included in net patient income.
$7.3M
Payroll costs Info Staff salaries plus wage-related costs — benefits such as payroll taxes, health insurance and retirement — from the home's own accounting records (CMS cost report, Worksheet A). Contract or agency labor is counted separately, under other operating costs. Rank #5 / 210Payroll — State benchmarkedThis home is ranked 5th out of 210 homes in Ohio. Shows total annual staff payroll benchmarked to the Ohio average. Higher payroll investment relative to peers often signals better staffing and less reliance on cheaper contract labor.Rankings are based only on facilities in Ohio that report data for that category. Facilities without available data are excluded from the ranking.Click the rank badge to see the full State ranking.Click here to see the full State ranking.
$13.9M 60.7% of net patient revenue Info Payroll as a share of revenue: staff salaries and wage-related benefits divided by net patient revenue. A higher figure means more of each revenue dollar goes to staff pay. Rank #154 / 210Payroll % — State benchmarkedThis home is ranked 154th out of 210 homes in Ohio. Shows payroll as a percentage of revenue versus the Ohio average. Well-run Ohio facilities typically land around 54–64% — the top third Statewide. Below 25% may signal understaffing or heavy agency use — read with Staffing ratings.Rankings are based only on facilities in Ohio that report data for that category. Facilities without available data are excluded from the ranking.Click the rank badge to see the full State ranking.Click here to see the full State ranking.
Other operating costs Info Everything it costs to run the home apart from payroll — food, utilities, supplies, maintenance, contract labor and administration. Calculated as total operating expense minus payroll (staff salaries and wage-related benefits).
$18.1M
Total costs Info The home's total operating expense for the year — all the costs of running it, salaries included (CMS cost report, Worksheet G-3).
$32.0M

Who this home usually serves

TYPE OF STAY

Mix of rehab and long-term care

This home supports both short-term rehab and long-term care, with residents staying for a wide range of durations.

Most new residents arrive under private pay (56% of admissions), and a typical private pay stay runs around 1 - 2 months.

Admissions
234 total

Coverage residents most often arrive under.

Medicare 44%
Private pay 56%
Discharges
232 total

Coverage residents most often leave under.

Medicare 39%
Private pay 60%

Places of interest near Judson Park

Address 5.5 miles from city center Info Estimated distance in miles from Cleveland's city center to Judson Park's address, calculated via Google Maps.

Calculate Travel Distance to Judson Park

Add your location

Address

Compare Nursing Homes around Cleveland

The information below is reported by the Ohio Department of Health, Bureau of Survey and Certification.

5 facilities compared · CMS & OH Dept. of Health data

Algart Health Care
NH
AL
HC
MC
RC
Cleveland (Edgewater)
36
Facility 36
OH AVG 78
Rank #273 / 323
100.0%
Facility 100.0%
OH AVG 78.7%
Rank #1 / 211
+27%
4.17
Facility 4.17
OH AVG 3.54
Rank #35 / 210
-44%+18%
$0
Facility $0
OH AVG $74.0k
Rank #1 / 211
11
Facility 11
OH AVG 30.9
Rank #29 / 210
5.5
Facility 5.5
OH AVG 4.6
Rank #167 / 210
-67-
62
Facility 62
OH AVG 40
Rank #136 / 705
Garth Ireland
$7.0M
Facility $7.0M
OH AVG $10.1M
Rank #109 / 210
$3.1M
Facility $3.1M
OH AVG $3.9M
Rank #171 / 210
44.1%
Facility 44.1%
OH AVG 40.2%
Rank #205 / 210
366308
O‘Neill Healthcare Fairview Park
NH
HC
Fairview Park
118
Facility 118
OH AVG 78
Rank #54 / 323
77.1%
Facility 77.1%
OH AVG 78.7%
Rank #139 / 211
-2%
3.20
Facility 3.20
OH AVG 3.54
Rank #150 / 210
-22%-10%
$0
Facility $0
OH AVG $74.0k
Rank #1 / 211
11
Facility 11
OH AVG 30.9
Rank #29 / 210
1.8
Facility 1.8
OH AVG 4.6
Rank #9 / 210
-99A+
66
Facility 66
OH AVG 40
Rank #94 / 705
Jenna Elliott
$11.7M
Facility $11.7M
OH AVG $10.1M
Rank #58 / 210
$5.3M
Facility $5.3M
OH AVG $3.9M
Rank #109 / 210
45%
Facility 45%
OH AVG 40.2%
Rank #198 / 210
366428
Judson Park
NH
AL
HC
IL
MC
Cleveland (University Circle)
36
Facility 36
OH AVG 78
Rank #273 / 323
61.7%
Facility 61.7%
OH AVG 78.7%
Rank #188 / 211
-22%
6.53
Facility 6.53
OH AVG 3.54
Rank #2 / 210
-64%+84%
$25.8k
Facility $25.8k
OH AVG $74.0k
Rank #169 / 211
10
Facility 10
OH AVG 30.9
Rank #26 / 210
2.5
Facility 2.5
OH AVG 4.6
Rank #27 / 210
229-
65
Facility 65
OH AVG 40
Rank #107 / 705
Judson
$22.8M
Facility $22.8M
OH AVG $10.1M
Rank #7 / 210
$13.9M
Facility $13.9M
OH AVG $3.9M
Rank #5 / 210
60.7%
Facility 60.7%
OH AVG 40.2%
Rank #154 / 210
365870
The Slovene Home Skilled Care & Rehabilitation
NH
AL
Cleveland (North Collinwood)
104
Facility 104
OH AVG 78
Rank #68 / 323
45.2%
Facility 45.2%
OH AVG 78.7%
Rank #204 / 211
-43%
4.54
Facility 4.54
OH AVG 3.54
Rank #22 / 210
-36%+28%
$0
Facility $0
OH AVG $74.0k
Rank #1 / 211
31
Facility 31
OH AVG 30.9
Rank #117 / 210
4.4
Facility 4.4
OH AVG 4.6
Rank #124 / 210
-76A+
67
Facility 67
OH AVG 40
Rank #84 / 705
Anthony Hiti
$6.6M
Facility $6.6M
OH AVG $10.1M
Rank #148 / 210
$4.5M
Facility $4.5M
OH AVG $3.9M
Rank #117 / 210
68.9%
Facility 68.9%
OH AVG 40.2%
Rank #23 / 210
365567
Crawford Manor Health Care Center
NH
AL
Cleveland (Hough)
50
Facility 50
OH AVG 78
Rank #227 / 323
68.0%
Facility 68.0%
OH AVG 78.7%
Rank #170 / 211
-14%
3.72
Facility 3.72
OH AVG 3.54
Rank #72 / 210
-54%+5%
$25.4k
Facility $25.4k
OH AVG $74.0k
Rank #168 / 211
45
Facility 45
OH AVG 30.9
Rank #168 / 210
5.6
Facility 5.6
OH AVG 4.6
Rank #171 / 210
235F
70
Facility 70
OH AVG 40
Rank #67 / 705
Gregory Hall
$3.9M
Facility $3.9M
OH AVG $10.1M
Rank #198 / 210
$2.4M
Facility $2.4M
OH AVG $3.9M
Rank #193 / 210
60.1%
Facility 60.1%
OH AVG 40.2%
Rank #22 / 210
366110

Financial Assistance for
Nursing Home in Ohio

Judson Park is located in Cleveland, Ohio.
Here are the financial assistance programs available to residents in Ohio.

Get Financial aid guidance

PASSPORT Waiver

Ohio Medicaid PASSPORT

Age 60+
General Ohio resident, Medicaid-eligible, nursing home-level care need.
Income Limits (2025) ~$2,829/month 300% FBR, individual
Asset Limits $2,000 (individual), $3,000 (couple).
OH

Administered through regional agencies; waitlists possible.

Benefits
Personal care (5-7 hours/day) Respite (240 hours/year) Adult day care ($65/day) Home modifications ($1,500 avg.)

Ohio Home Care Program (non-Medicaid)

OH HCP

Age 60+
General Ohio resident, at risk of decline.
Income Limits ~$2,000/month individual, varies
Asset Limits $5,000 individual
OH

Limited funding; regional variation.

Benefits
In-home care (3-5 hours/week) Respite (up to 10 days/year) Transportation (~5 trips/month)

Assisted Living Waiver (ALW)

Ohio Assisted Living Waiver

Age 21+ (65+ prioritized)
General OH resident, Medicaid-eligible, NFLOC.
Income Limits (2025) ~$2,829/month (individual); QIT required.
Asset Limits $2,000 (individual), $3,000 (couple).
OH

Covers ~300 facilities; room/board not included (separate cost).

Benefits
Personal care Meals Medication management Transportation (~$3,000-$4,000/month value)

Program of All-Inclusive Care for the Elderly (PACE)

Ohio PACE (e.g., McGregor PACE)

Age 55+
General OH resident (specific counties), NFLOC, safe with PACE support.
Income Limits (2025) ~$2,829/month (Medicaid-eligible); private pay option available.
Asset Limits $2,000 (individual), $3,000 (couple) for Medicaid enrollees.
OH

Available in 9 counties (e.g., Cuyahoga, Franklin); expanding via Healthy Aging Grants.

Benefits
Personal care (5-7 hours/day) Medical care Meals Transportation Respite Therapies

Medicare Savings Program (MSP)

Ohio Medicare Savings Program

Age 65+ or disabled
General OH resident, Medicare Part A/B.
Income Limits (2025) ~$2,510/month (QMB), ~$3,380/month (SLMB), ~$3,598/month (QI)—individual.
Asset Limits $9,430 (individual), $14,130 (couple).
OH

Three tiers; includes Extra Help for Part D; no waitlist.

Benefits
Covers Part B premiums ($174.70/month) Deductibles ($240/year) Copays (~20%)

Home Energy Assistance Program (HEAP)

Ohio HEAP

Age 60+ prioritized
General OH resident, low-income household.
Income Limits (2025) ~$3,970/month individual, 185% FPL
Asset Limits Not assessed; income-focused.
OH

Covers gas, electric, oil; emergency aid via Winter/Summer Crisis Programs.

Benefits
Heating/cooling aid ($300-$1,000/season) Emergency aid ($500 max)

Family Caregiver Support Program (FCSP)

Ohio Family Caregiver Support Program

Age
General Caregivers of 60+ needing care or 55+ caregivers of others; OH resident; functional needs (2+ ADLs).
Income Limits (2025) Prioritizes ~$24,980/year (individual); no strict cap.
Asset Limits Not assessed; need-based.
OH

12 AAAs; rural/low-income priority; volunteer respite option.

Benefits
Respite (4-6 hours/week or 5 days/year) Adult day care ($60/day) Training Supplies (~$500/year)

VA Aid and Attendance (A&A) and Housebound Benefits

Ohio VA Aid and Attendance/Housebound

Age 65+ or disabled veteran/spouse
General OH resident, wartime service, need for ADL help (A&A) or homebound.
Income Limits (2025) Net income < ~$1,984/month (veteran with dependent, A&A); pension offsets income.
Asset Limits ~$155,356 net worth limit
OH

High veteran demand; supports care in multiple settings.

Benefits
Cash (~$1,433-$2,642/month veteran, ~$951-$1,318 spouse) for care costs (e.g., in-home, assisted living)

Homestead Exemption

Ohio Homestead Exemption

Age 65+ (or disabled)
General OH resident, homeowner, low-income.
Income Limits (2025) ~$38,500/year individual, adjusted annually
Asset Limits Not assessed; home ownership required.
OH

Reduces taxable value by $25,000; applies to primary residence.

Benefits
Tax reduction (~$400-$800/year avg., varies by county)

Save the Dream Ohio (Homeowner Assistance Fund)

Ohio Save the Dream

Age 60+ prioritized
General OH resident, homeowner, hardship post-Jan 21, 2020.
Income Limits (2025) ~$147,600/year family of 4, 150% AMI; varies by county
Asset Limits Not assessed; hardship-focused.
OH

Covers delinquent mortgages, utilities, taxes; max $25,000 mortgage aid.

Benefits
Mortgage aid ($25,000 max) Utility/property tax aid ($5,000 avg.)

Frequently Asked Questions about Judson Park

What neighborhood is Judson Park in?

Judson Park is in the University Circle neighborhood.

Is Judson Park in a walkable area?

Judson Park has a walk score of 65. Moderately walkable. Some errands can be accomplished on foot, with a mix of nearby amenities.

What is the occupancy rate at Judson Park?

Judson Park's occupancy is 61.7%.

Does Judson Park operate as a for-profit or non-profit?

Judson Park is registered as a non-profit.

Are there photos of Judson Park?

Yes — there are 7 photos of Judson Park in the photo gallery on this page.

What is the address of Judson Park?

Judson Park is located at 2181 Ambleside Dr, Cleveland, OH 44106.

What is the phone number of Judson Park?

(216) 532-1350 will put you in contact with the team at Judson Park.

Guides for Better Senior Living

Care Cost Calculator: See Prices in Your Area

Nursing Home Data Explorer

Don’t Wait Too Long: 7 Red Flag Signs Your Parent Needs Assisted Living Now

The True Cost of Assisted Living in 2025 – And How Families Are Paying For It

Understanding Senior Living Costs: Pricing Models, Discounts & Financial Assistance