Kennedy Care Center

Nursing Home
Overview of Kennedy Care Center

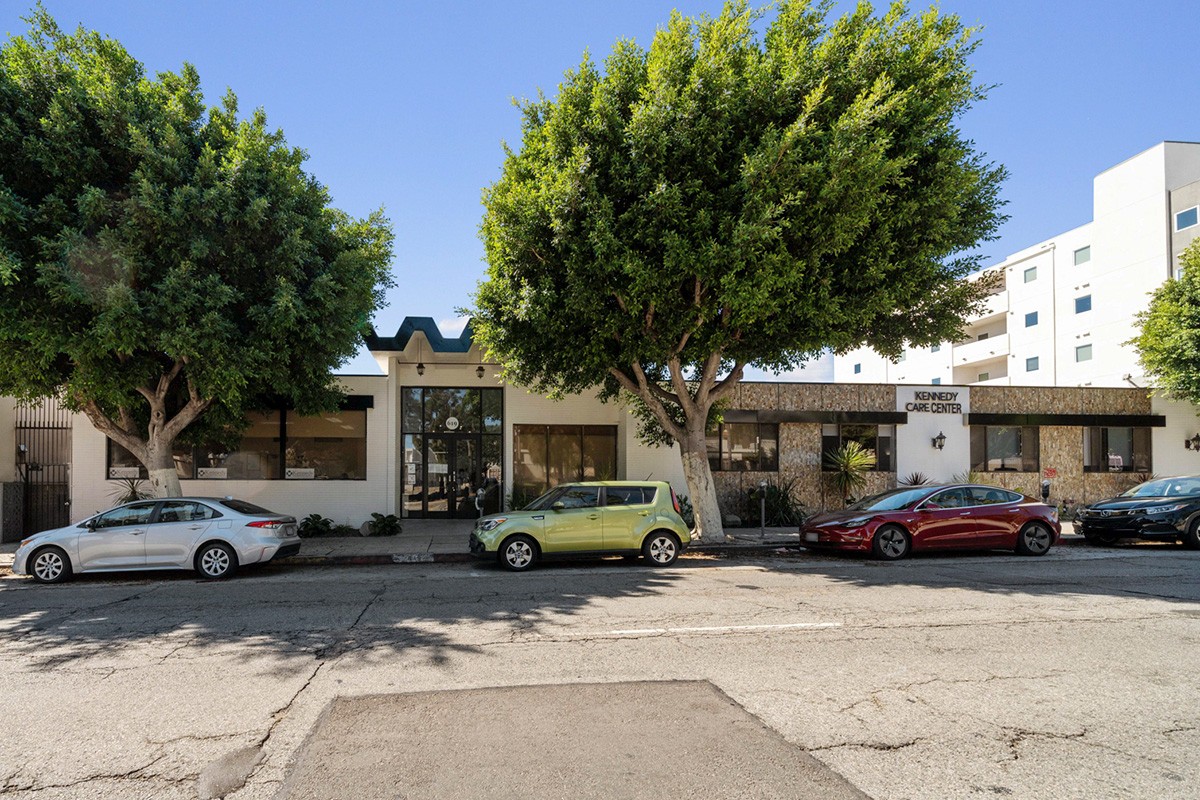
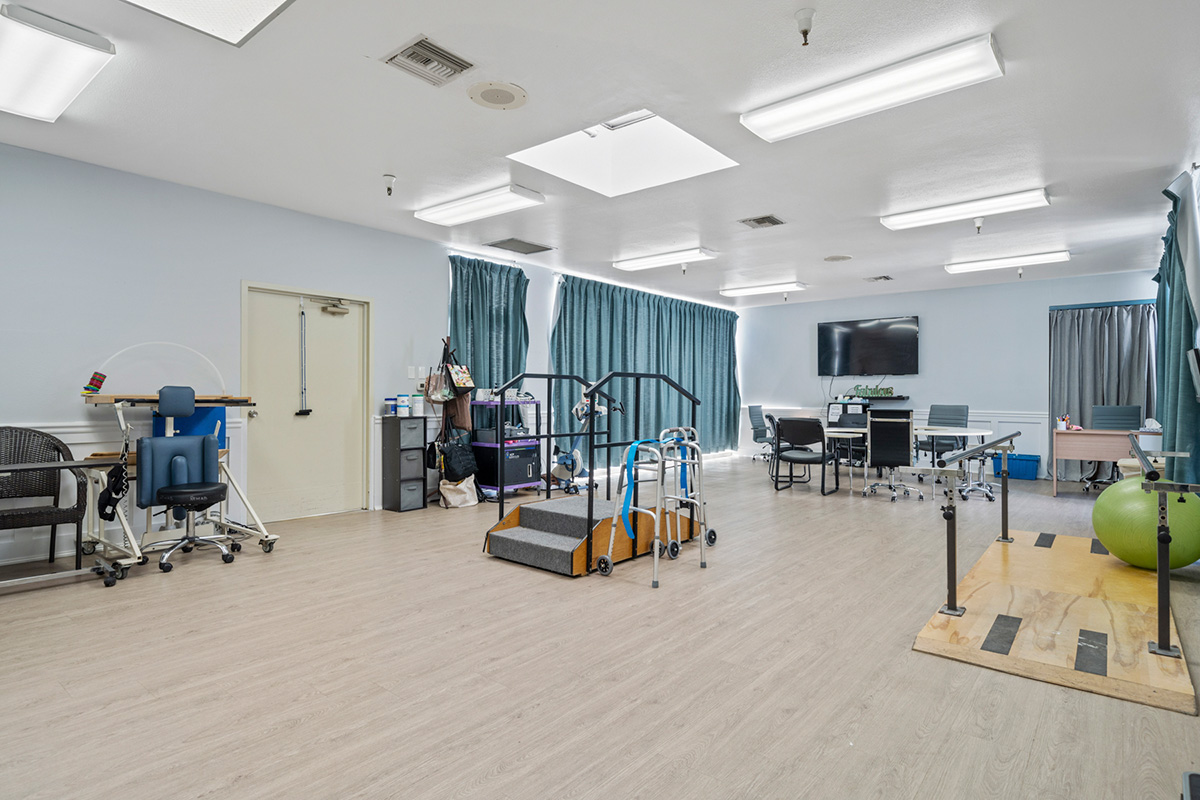
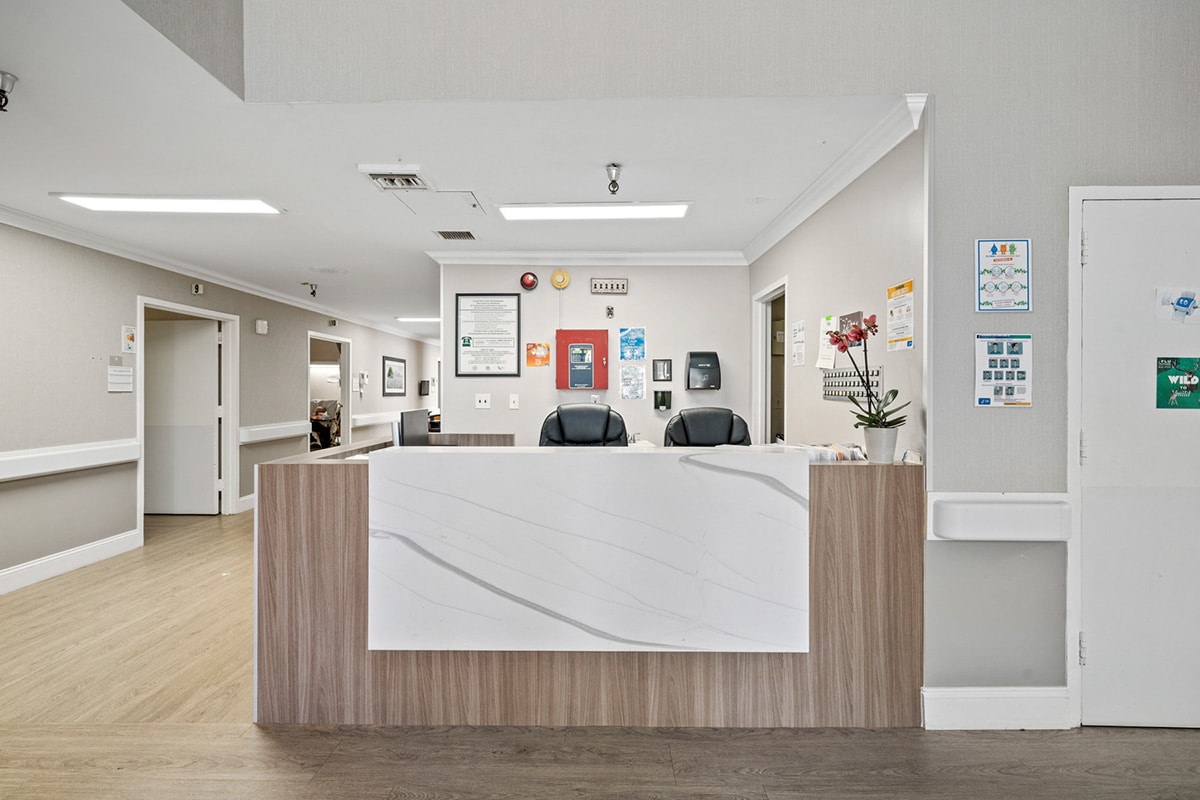
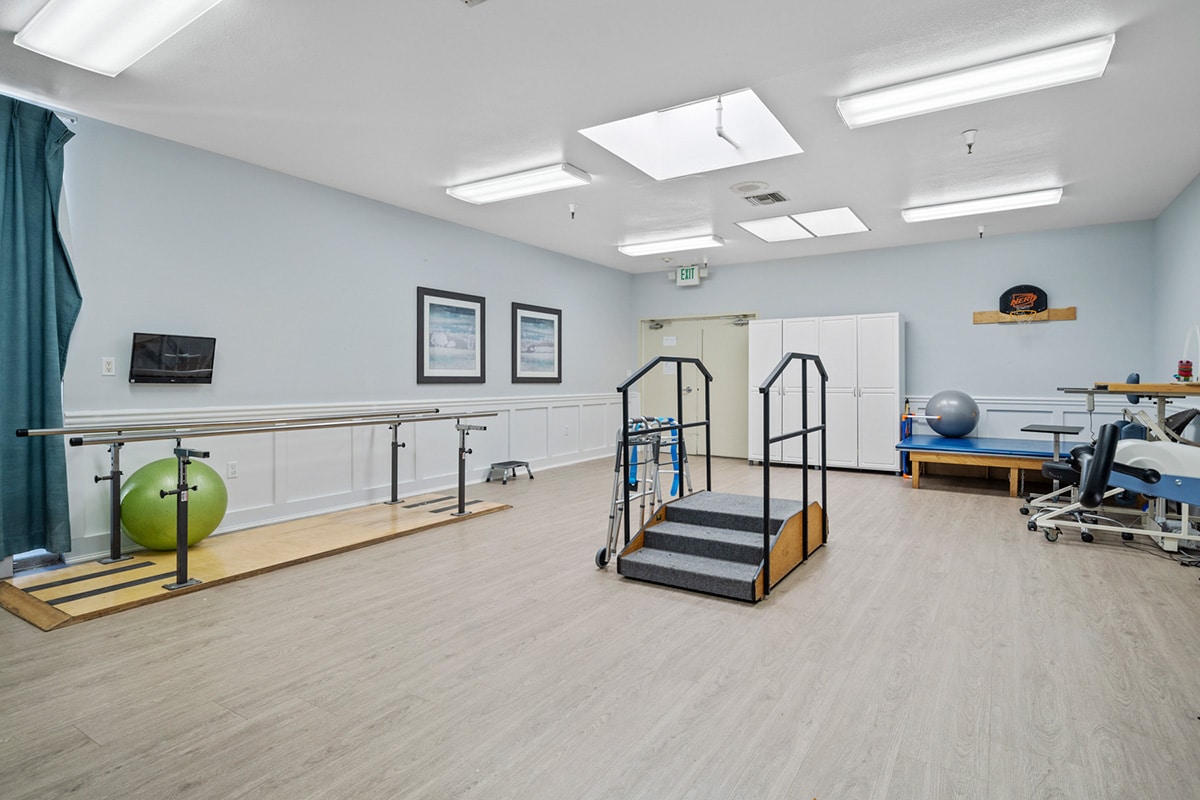
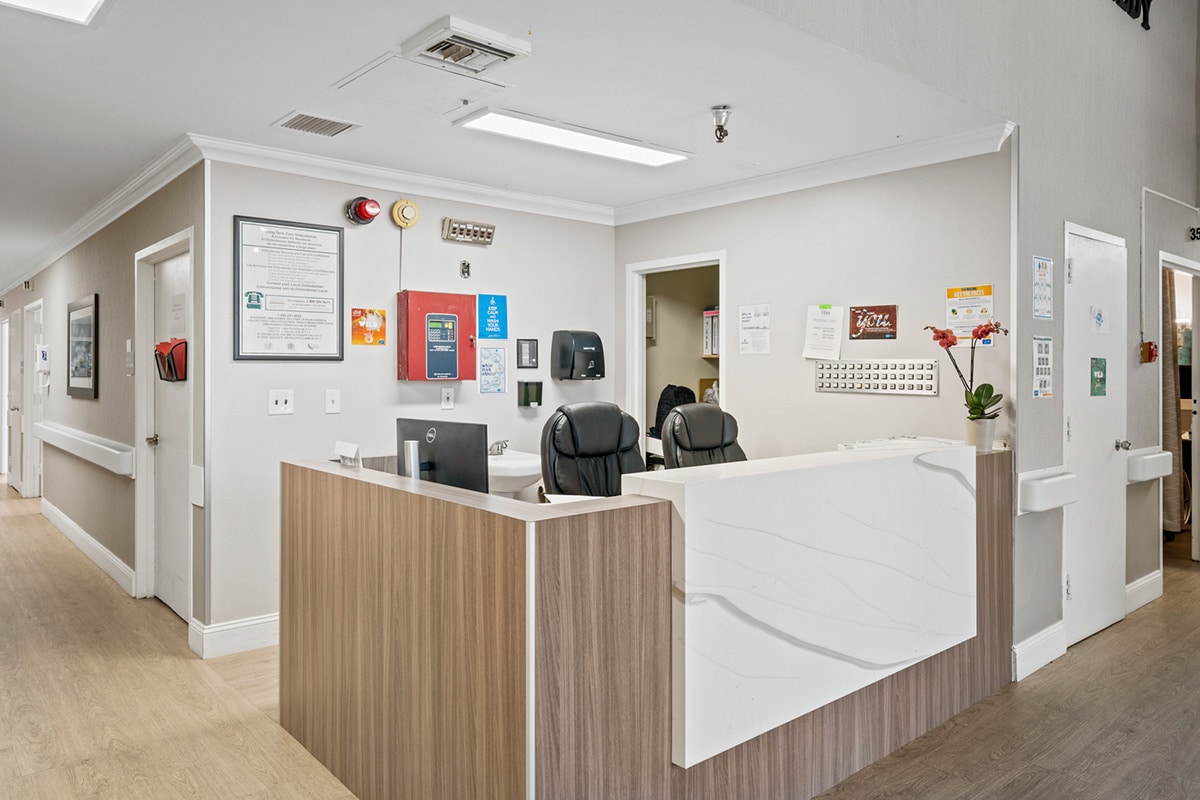
Enjoy a worry-free retirement at Kennedy Care Center, an exceptional community in Los Angeles, CA, offering nursing care and rehabilitation. The community strives to meet residents’ health care needs, providing top-notch care around the clock. Residents enjoy a hassle-free living with a kind and highly trained team helping with their chores and maintenance.

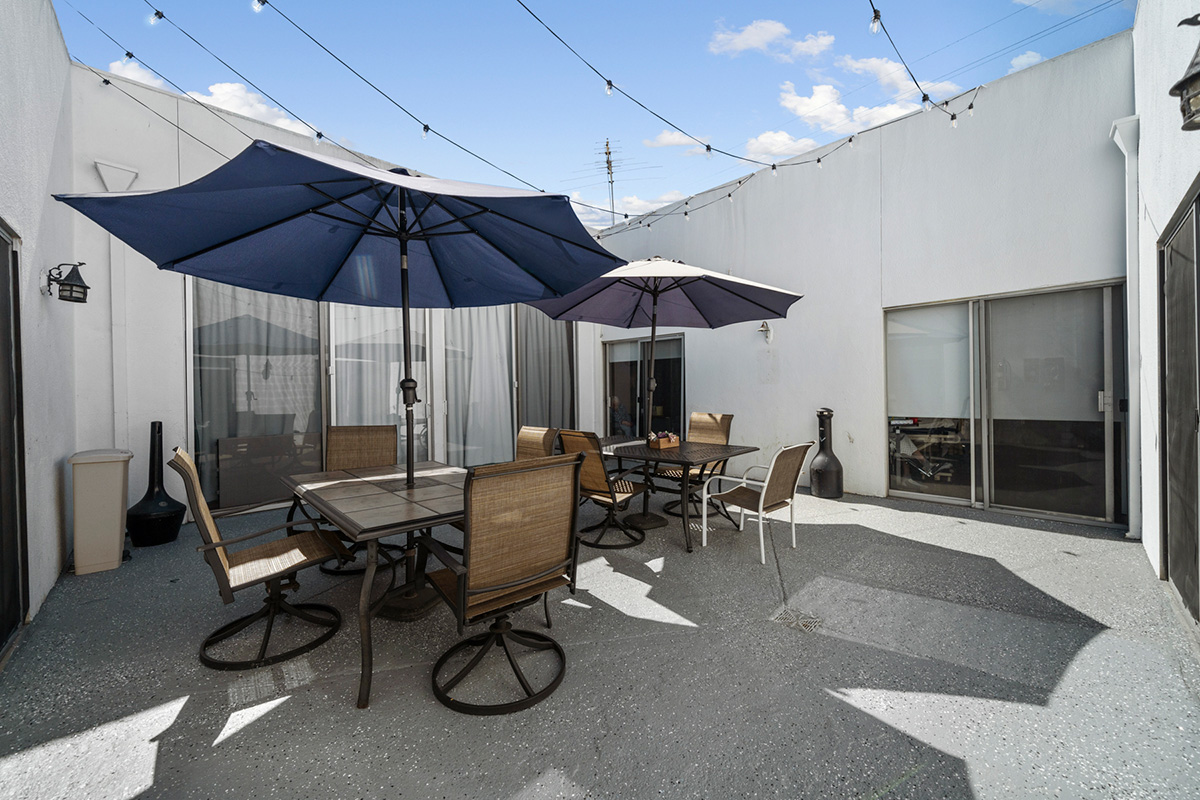
A jam-packed calendar of engaging activities and stimulating programs is conducted to keep residents active and socially connected. Delightful and well-balanced dining options are served to satisfy residents’ dietary needs and preferences. This Medicare-certified community is a good option for those needing top-notch care, especially with its nurturing and welcoming environment.

(213) 204-4725

Managed by Andrew Hyder

Administrator

Andrew Hyder serves as the Administrator at Kennedy Care Center, leading the community with a focus on providing experienced and compassionate care to residents. He is dedicated to helping families navigate important decisions regarding health and care.

Quality ratings

Measured by Centers for Medicare & Medicaid Services (CMS)

Overall rating Info Official CMS rating based on health inspections, staffing and quality measures.
2/5
California average: 3.1/5
Health Inspection Info Official CMS rating based on deficiencies found during state health inspections.
1/5
California average: 2.8/5
Staffing Info Official CMS rating based on nurse staffing hours per resident per day.
1/5
California average: 3.1/5
Quality Measures Info Official CMS rating based on clinical outcomes for residents.
5/5
California average: 4.1/5

Nursing care per resident

Info Average daily nursing hours per resident (adjusted for acuity). Higher values indicate more nursing time per resident.
3h 20m per day

This home provides 21% less nursing time per resident than the state average.

California average: 4h 13m per day

Staffing hours breakdown

Info Hours of care per resident per day, broken down by staff type. Data from CMS Medicare.
Staff type Facility State avg National avg
Registered Nurse (RN) Info Registered nurse hours per resident per day. 17m per day 39m per day 41m per day
LPN / LVN Info Licensed Practical Nurse / Licensed Vocational Nurse hours per resident per day. 1h 12m per day 1h 13m per day 52m per day
Nurse Aide Info Nurse aide hours per resident per day. 2h 32m per day 2h 39m per day 2h 21m per day
Total Nursing (Weekend) Info Total number of nurse staff hours per resident per day on weekends. 3h 48m per day 4h 5m per day 3h 26m per day
Physical Therapist Info Physical therapist staff hours per resident per day. 16m per day 5m per day 4m per day
RN (Weekend) Info Registered nurse hours per resident per day on weekends. 12m per day 30m per day 29m per day

Capacity and availability

Smaller home

May offer a more intimate, personalized care environment.

Total beds 97

This home usually has limited availability

Occupancy is moderate, suggesting balanced demand.

Similar demand to the California average
Occupancy rate 87.1%
Residents per day (avg) 84
Occupancy rate
87.1%
Residents per day (avg)
84

Who this home usually serves

TYPE OF STAY

Primarily short stays

Residents typically stay for brief periods, with frequent admissions and discharges throughout the year.

Might be optimal for
Post-acute recovery Temporary care Transitional stays

Breakdown by payment type

Medicare

34% of new residents, usually for short-term rehab.

Typical stay 3 months

Private pay

62% of new residents, often for short stays.

Typical stay 3 - 4 months

Medicaid

4% of new residents, often for long-term daily care.

Typical stay 3 months

Finances and operations

Proprietary home
Other
Home revenue
$17.1M
Profit
$1.8M
Proprietary home Other
Home revenue
$17,133,588.00
Profit
$1,818,970.00
Payroll costs Info The portion of the home's budget spent on staff, including nurses, caregivers, and other employees who support care and operations.
$7.2M
41.7% of revenue
Other operating costs Info All remaining costs needed to run the home, such as food, utilities, building maintenance, supplies and administrative expenses.
$8.2M
Total costs $15.3M
Walk Score
Walk Score: 96 / 100
Walker's paradise. Daily errands do not require a car, with many shops and services nearby.
BBB Rating
BBB Rating: A+ (Not Accredited)
An independent rating from the Better Business Bureau based on factors such as complaint history, transparency, and business practices.
How BBB ratings work

About this community

Additional licensing details

CMS Certification Number: 55977
Awards: 4-Star Quality Measures Medicare Rating

Care Services

Nursing Services
Rehabilitation Services
Skilled Nursing
Licensed Nurses/CNAs
24-Hour Staffing
Short-Term Rehab

All Levels of Care

Short-Term Rehabilitation
Long-Term Care
Complex Wound Care
Hospice Services

Amenities & Lifestyle

Expansive rehab gym
Spacious courtyards and common areas
24/7 nursing care
Hospice services
Complex wound care

Programs & Activities

Specific Programs
About Us, What We Do, Meet the Team, New Patient FAQs, Photos, Careers, Contact Us, Map and Directions, Send a Greeting, Online Bill Pay, Directions
Operating Hours
Monday – Friday: 8am – 5pm

What does this home offer?

Housing options icon

Housing Options: Shared Rooms

Building type icon
Building type icon

Building Type: Single-story

Dining services icon

Dining Services

Housekeeping icon
Housekeeping icon

Housekeeping Services

Social and recreational activities icon

Social and Recreational Activities

On-site medical care and health services icon

On-site Medical Care and Health Services

Types of Care at Kennedy Care Center

Nursing Home
Contact Kennedy Care Center

Compare Nursing Homes around Los Angeles

The information below is reported by the California Department of Social Services and Department of Public Health.
Culver West Health Center
SNF

Nursing Home 24/7 care needed

AL

Assisted Living For seniors needing help with daily tasks but not full-time nursing.

Los Angeles (Culver - West)
91
No
A+
88
CULVER WEST HEALTH CENTER LLC
52.7%
$11,542,688.00
$5,428,917.00
47%
76.00
2/5
3.6224
3/5
1/5
3/5
1
59
1
-20%
-14%
-38%
Shared Rooms
Kennedy Care Center
SNF

Nursing Home 24/7 care needed

AL

Assisted Living For seniors needing help with daily tasks but not full-time nursing.

Los Angeles (Melrose)
97
No
A+
96
RAHBAN, ALFRED
87.1%
$17,129,329.00
$7,153,078.00
41.8%
84.00
2/5
3.3284
1/5
1/5
5/5
1
103
1
-44%
-21%
+3%
Shared Rooms
Avalon Villa Care Center
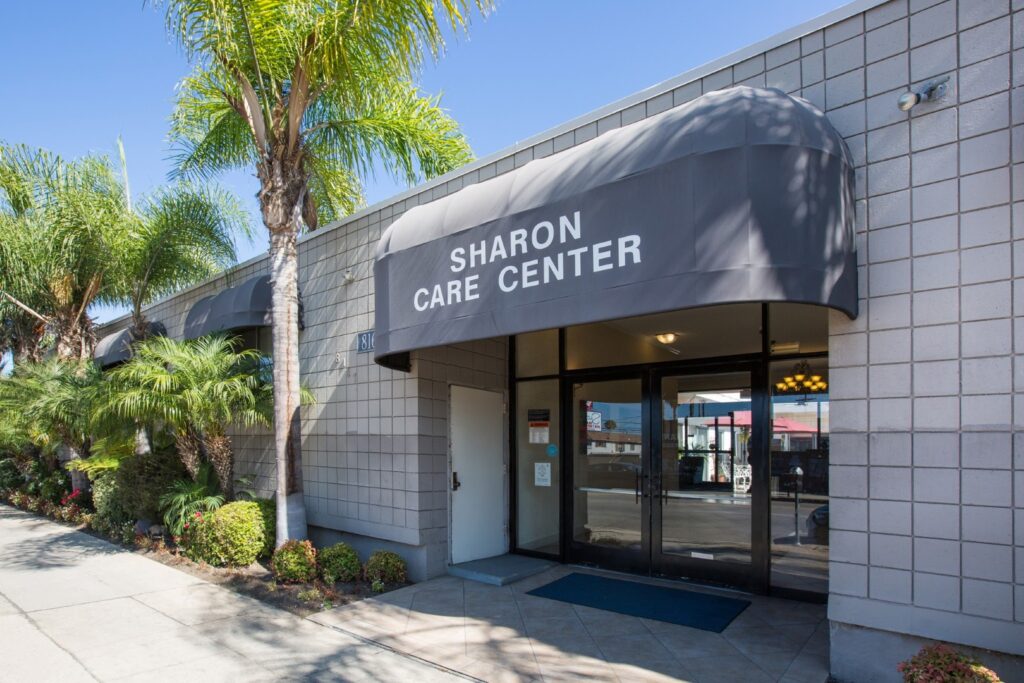
SNF

Nursing Home 24/7 care needed

AL

Assisted Living For seniors needing help with daily tasks but not full-time nursing.

Los Angeles (South Los Angeles)
131
No
-
60
-
90.1%
$16,410,129.00
$7,535,673.00
45.9%
117.70
1/5
4.2794
1/5
3/5
3/5
2
110
3
+53%
+1%
+6%
Shared Rooms
Sharon Care Center
SNF

Nursing Home 24/7 care needed

AL

Assisted Living For seniors needing help with daily tasks but not full-time nursing.

Los Angeles (Central LA)
86
No
-
95
SUMMIT CARE LLC
87.2%
$14,491,603.00
$5,665,173.00
39.1%
77.80
1/5
3.7417
1/5
2/5
4/5
1
111
5
-5%
-11%
+3%
Shared Rooms
Alta Vista Gardens
SNF

Nursing Home 24/7 care needed

AL

Assisted Living For seniors needing help with daily tasks but not full-time nursing.

CA 90046
70
No
-
-
-
-
-
-
-
-
-
-
-
-
-
-
-
-
-
-
-
Shared Rooms

Places of interest near Kennedy Care Center

Address 7.8 miles from city center
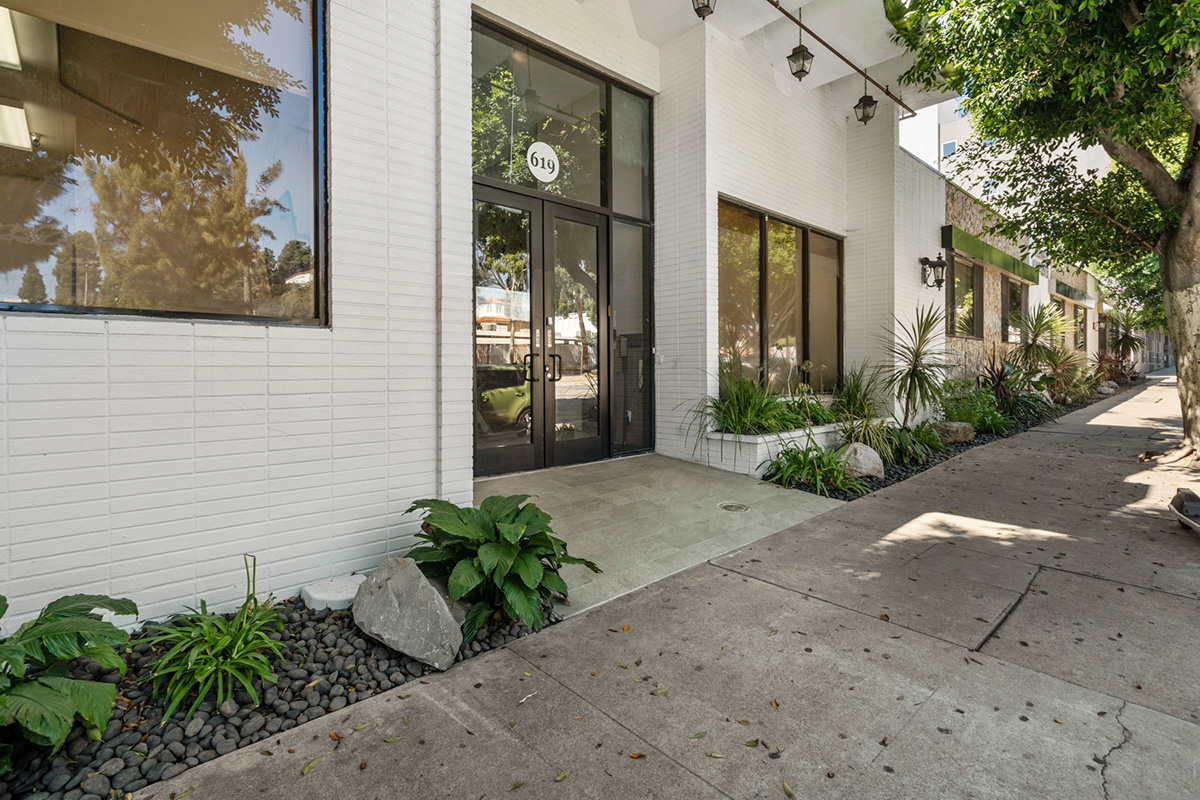
Address 619 N Fairfax Ave, Los Angeles, CA 90036

Calculate Travel Distance to Kennedy Care Center

Add your location

Address

Staffing Data

Source: CMS Payroll-Based Journal (Q2 2025)

252
Total Staff
121
Employees
131
Contractors
38,765
Total Hours (Quarter)
57
Avg Staff/Day
7.5
Avg Shift (hrs)
Nursing Staff Breakdown
Role Count Avg Shift (hrs) Uses Contractors?
Registered Nurse128.5 Yes
Licensed Practical Nurse907.5 Yes
Certified Nursing Assistant1027.7 Yes
Staff by Category
Administration
1 staff
8hs shift avg
Nursing Staff
210 staff
7.7hs shift avg
Physicians & Practitioners
2 staff
7.2hs shift avg
Therapy Services
32 staff
6.9hs shift avg
Activities & Recreation
1 staff
7.9hs shift avg
Social Services
2 staff
3.3hs shift avg
Dietary Services
2 staff
7.1hs shift avg
Other Services
2 staff
8hs shift avg
Contractor Analysis
5.6%
of total hours from contractors
2,170 contractor hours this quarter
Certified Nursing Assistant: 55 Licensed Practical Nurse: 66 Registered Nurse: 10
Role Employees Contractors Total Staff Total Hours Days Worked % of Days Avg Shift (hrs)
Certified Nursing Assistant475510219,44891100%7.7
Licensed Practical Nurse2466907,64691100%7.5
Respiratory Therapy Technician100101,9487886%7.4
Speech Language Pathologist100101,4538189%6.4
Registered Nurse210121,3979099%8.5
Physical Therapy Aide7071,2377684%7
Physical Therapy Assistant5051,0988088%6.5
Dental Services Staff2021,0246470%8
RN Director of Nursing6061,0018492%6.6
Administrator1015126470%8
Nurse Practitioner1015126470%8
Other Dietary Services Staff1015126571%7.9
Therapeutic Recreation Specialist1014806167%7.9
Dietitian1014016470%6.3
Clinical Nurse Specialist101701719%4.1
Qualified Social Worker2022789%3.3

Health Inspection History

Inspections
Total health inspections 29

California average 12.5


Last Health inspection on Sep 2025

Total health citations 103
Citations per inspection
3.55

Health citations are formal notices following inspections when they fail to comply with safety and care standards.

48 of 103 citations resulted from standard inspections; and 55 of 103 resulted from complaint investigations.

Breakdown of citation severity (last 3 years)
Critical Health citations More info 0
100% better than California average

California average: 0.4


Serious Health citations More info 1
In line with California average

California average: 1

0 critical citations More info California average: 0.4

1 serious citation More info California average: 1

99 moderate citations More info California average: 47.2

3 minor citations More info California average: 1.5
Citations history (last 3 years)
Infection Control moderate citation Sep 12, 2025
Corrected

Quality of Care moderate citation Sep 12, 2025
Corrected

Resident Rights moderate citation Sep 12, 2025
Corrected

Resident Rights moderate citation Sep 12, 2025
Corrected

Facility Characteristics

Source: CMS Long-Term Care Facility Characteristics (Data as of Jan 2026)

Ownership: For-Profit LLC
Resident Census by Payment Source
84 Total Residents
Medicare 24 (28.6%)
Medicaid 60 (71.4%)
Programs & Services
Residents' Group
Family Engagement

Active councils help families stay involved in care decisions and facility operations.

Quality of care over time

These measures show how residents usually do over time at this home, based on health outcomes and preventive care.

High-risk clinical events score Info A composite score based on pressure ulcers, falls with injury, weight loss, walking ability decline, and activities of daily living decline. 4.6
30% better than California average

California average: 6.6

Functional decline score Info A composite score based on activities of daily living decline, walking ability decline, and incontinence. 6.4
43% better than California average

California average: 11.3

Long-stay resident measures
Need for Help with Daily Activities Increased Info Percent of long-stay residents whose need for help with daily activities has increased 10.0%
10% better than California average

California average: 11.1%

Walking Ability Worsened Info Percent of long-stay residents whose ability to move independently worsened 5.8%
52% better than California average

California average: 12.0%

Low Risk Residents with Bowel/Bladder Incontinence Info Percent of low risk long-stay residents who lose control of their bowels or bladder 3.5%
69% better than California average

California average: 11.3%

Falls with Major Injury Info Percent of long-stay residents experiencing one or more falls with major injury 0.4%
79% better than California average

California average: 1.7%

High Risk Residents with Pressure Ulcers Info Percent of long-stay high risk residents with pressure ulcers 2.4%
52% better than California average

California average: 5.0%

Urinary Tract Infection Info Percent of long-stay residents with a urinary tract infection 0.0%
100% better than California average

California average: 1.2%

Lost Too Much Weight Info Percent of long-stay residents who lose too much weight 4.6%
9% worse than California average

California average: 4.2%

Depressive Symptoms Info Percent of long-stay residents who have depressive symptoms 52.3%
682% worse than California average

California average: 6.7%

Antipsychotic Use Info Percent of long-stay residents who received an antipsychotic medication 7.2%
28% better than California average

California average: 10.1%

Pneumococcal Vaccine Info Percent of long-stay residents assessed and appropriately given the pneumococcal vaccine 99.7%
In line with California average

California average: 98.5%

Influenza Vaccine Info Percent of long-stay residents assessed and appropriately given the seasonal influenza vaccine 100.0%
In line with California average

California average: 98.2%

Hospitalizations per 1,000 days Info Number of hospitalizations per 1,000 long-stay resident days. 2.07
8% better than California average

California average: 2.25

ED visits per 1,000 days Info Number of outpatient emergency department visits per 1,000 long-stay resident days. 1.36
14% better than California average

California average: 1.59

Short-stay resident measures
Pneumococcal Vaccine Info Percent of short-stay residents assessed and appropriately given the pneumococcal vaccine 98.5%
5% better than California average

California average: 94.0%

Antipsychotic medication increase Info Percent of short-stay residents who newly received an antipsychotic medication 0.7%
54% better than California average

California average: 1.5%

Influenza Vaccine Info Percent of short-stay residents assessed and appropriately given the seasonal influenza vaccine 99.3%
7% better than California average

California average: 93.2%

Re-hospitalized after SNF stay Info Percentage of short-stay residents who were re-hospitalized after their nursing home admission. 22.7%
In line with California average

California average: 23.2%

Emergency department visits Info Percentage of short-stay residents who had an outpatient emergency department visit. 11.2%
In line with California average

California average: 11.2%

Falls with major injury Info Percentage of SNF residents who experience falls with major injury during their stay. 0.0%
100% better than California average

California average: 0.8%

Ability to care for self at discharge Info Percentage of residents at or above expected ability to care for themselves at discharge. 46.8%
13% worse than California average

California average: 53.7%

Successful return to home or community Info Rate of successful return to home or community from a skilled nursing facility. 42.2%
16% worse than California average

California average: 50.6%

Penalties and fines

Federal penalties imposed by CMS for regulatory violations, including civil money penalties (fines) and denials of payment for new Medicare/Medicaid admissions.

Source: CMS Penalties Database (Data as of Jan 2026)

Total fines amount $59K
8% higher than California average

California average: $55K

Number of fines 1
58% fewer fines than California average

California average: 2.4

Payment Denials Info Serious action where Medicare and/or Medicaid temporarily stops payments for new residents until issues are fixed. 1
102% more payment denials than California average

California average: 0.5

Fines amount comparison
This facility $59K
California average $55K
Penalty History

Penalties are imposed by CMS for violations of federal nursing home regulations.

Civil Money Penalty Info Fines imposed for noncompliance, which can be assessed per day or per instance of violation. Mar 20, 2025
$59K
Payment Denial Info Serious action where Medicare and/or Medicaid temporarily stops payments for new residents until issues are fixed. Mar 20, 2025
35 days

Last updated: Jan 2026

Guides for Better Senior Living

Care Cost Calculator: See Prices in Your Area

Nursing Home Data Explorer

Don’t Wait Too Long: 7 Red Flag Signs Your Parent Needs Assisted Living Now

The True Cost of Assisted Living in 2025 – And How Families Are Paying For It

Understanding Senior Living Costs: Pricing Models, Discounts & Financial Assistance

Financial Aid for California Seniors

Get financial aid guidance

Multipurpose Senior Services Program

MSSP (Medi-Cal Waiver)

Age 65+, California resident, Medi-Cal eligible, nursing home risk.

~$2,829/month (300% FBR, individual).

$2,000 (individual), $3,000 (couple).

County-managed; waitlists possible.

In-Home Supportive Services (IHSS)

California IHSS

Age 65+, California resident, Medicaid-eligible or low-income.

~$1,732/month (individual, Medi-Cal threshold).

$2,000 (individual).

Can hire family as caregivers.

Multipurpose Senior Services Program (MSSP)

CA MSSP

Age 65+, California resident, Medi-Cal-eligible, nursing home-eligible but community-capable.

~$2,829/month (300% FBR, individual).

$2,000 (individual).

Available in 38 counties; waitlists common.

Property Tax Postponement Program (PTP)

CA PTP

Age 62+, California resident, own and live in home, 40% equity.

~$51,500/year (household, adjusted annually).

Equity-based; no strict asset cap.

Deferred taxes accrue interest (5% as of 2024); repaid upon sale/death.

Assisted Living Waiver (ALW)

CA ALW

Age 65+ or disabled, California resident, Medi-Cal-eligible, nursing home-eligible.

~$2,829/month (300% FBR, individual).

$2,000 (individual).

Available in 15 counties (e.g., LA, Sacramento); waitlists common.

California CARES Program

CA CARES

Caregivers of California residents 60+ needing help with 3+ daily activities; no caregiver age limit.

No strict limit; cost-sharing above ~$2,500/month threshold.

Not applicable; need-based.

High demand in urban areas; complements IHSS respite.

Low-Income Home Energy Assistance Program (LIHEAP)

CA LIHEAP

Age 60+ priority, California resident, low-income, utility/heating need.

~$2,510/month (200% of poverty level, individual).

Not applicable; income-focused.

High demand in inland/coastal extremes; weatherization capped at $5,000/home.

Who we are

Your Senior Care Partner, Every Step of the Way

We help families find affordable senior communities and unlock same day discounts, Medicaid, and Medicare options tailored to your needs.

Contact us Today
Tour Icon
Planning a tour? Check our touring checklist.
Chat Icon
Thinking of living here? We can help you speak to a current resident