Occupancy rate
90%

We arrange tours, appointments, and even moving support so you don’t have to
Thank you for your interest!
Our team will be in touch shortly to help with next steps.


Offers a balance of services and community atmosphere.
Occupancy is moderate, suggesting balanced demand.
Most residents typically stay for a few weeks or months before returning home or moving on.
68% of new residents, usually for short-term rehab.
21% of new residents, often for short stays.
11% of new residents, often for long-term daily care.
Kentmere Rehabilitation and Healthcare Center is administrated by Brittany Brown- ED.
Key information about the people who lead and staff this community.
Ways to qualify for care at this community, including accepted programs and payment options.
This facility is certified for eligible Medicaid services.
This facility is certified for eligible Medicare services.
In Delaware, the Department of Health and Social Services, Division of Health Care Quality is responsible for the oversight, unannounced inspection, and licensing of all long-term care settings.
Deficiencies indicate regulatory issues. A higher number implies the facility had several areas requiring improvement.
Delaware average: 64 deficiencies
The most recent inspection on November 22, 2024, identified deficiencies related to residents’ rights, abuse and neglect, medication administration, care planning, pharmacy services, food safety, and equipment safety. Earlier inspections showed a pattern of issues including staffing shortages, failure to provide timely emergency care, infection control lapses, and deficiencies in resident care and documentation. Complaint investigations substantiated abuse, neglect, and misappropriation of property, with staff disciplinary actions noted, but no fines or license actions were listed in the available reports. Prior complaint investigations were mostly unsubstantiated or focused on infection control and staffing concerns. The facility’s deficiencies have persisted over time with no clear trend of improvement.
Delaware average 4.4
Last Health inspection on Nov 2024
Delaware average 38.9
Delaware average 8.72
Health citations are formal notices following inspections when they fail to comply with safety and care standards.
35 of 40 citations resulted from standard inspections; and 5 of 40 came from combined inspections (standard and complaint).
Delaware average: 0.9
Delaware average: 1.2
Data sourced from CMS Health Deficiencies reports. Citation severity codes range from A (least serious) to L (most serious). Immediate Jeopardy (J-L) citations indicate situations where the facility's noncompliance has placed residents at risk of death or serious harm.
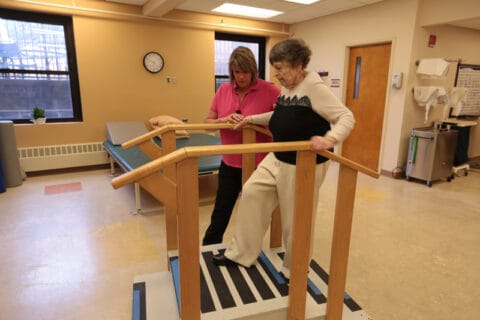
Nursing Home Licensed facility providing 24/7 skilled nursing care for residents with complex, ongoing medical needs. Staffed by RNs, LPNs, and CNAs. Inspected and star-rated annually by CMS. Accepts Medicare (short-term rehab) and Medicaid (long-term care).
Assisted Living A licensed, long-term care setting for seniors or individuals with disabilities who need help with daily activities — like bathing, dressing, and medication management — but not 24-hour skilled nursing. Offers housing, meals, and around-the-clock support while aiming to maximize resident independence.
Assisted Living A licensed, long-term care setting for seniors or individuals with disabilities who need help with daily activities — like bathing, dressing, and medication management — but not 24-hour skilled nursing. Offers housing, meals, and around-the-clock support while aiming to maximize resident independence.
Nursing Home Licensed facility providing 24/7 skilled nursing care for residents with complex, ongoing medical needs. Staffed by RNs, LPNs, and CNAs. Inspected and star-rated annually by CMS. Accepts Medicare (short-term rehab) and Medicaid (long-term care).
![]() 1.7 miles from city center
1.7 miles from city center
Add your location
This data corresponds to Q2 2025 and is based on CMS Payroll-Based Journal.
Delaware average ratio: 1.61:1
Delaware average: 7.6 hours
Manages medical care and health needs.
No contractors work on this role.
Assists with medical care and medications.
No contractors work on this role.
Helps with daily care and mobility.
No contractors work on this role.
Total hours from contractors
2,433 contractor hours this quarter
| Certified Nursing Assistant | 55 | 0 | 55 | 18,680 | 91 | 100% | 7.9 |
| Licensed Practical Nurse | 25 | 0 | 25 | 7,540 | 91 | 100% | 8.7 |
| Registered Nurse | 20 | 0 | 20 | 4,655 | 91 | 100% | 7.8 |
| Clinical Nurse Specialist | 8 | 0 | 8 | 1,916 | 70 | 77% | 7.5 |
| Other Dietary Services Staff | 5 | 0 | 5 | 1,429 | 91 | 100% | 8 |
| Administrator | 2 | 0 | 2 | 883 | 64 | 70% | 7.8 |
| Physical Therapy Aide | 0 | 4 | 4 | 850 | 66 | 73% | 6.9 |
| Dietitian | 2 | 0 | 2 | 831 | 62 | 68% | 7.6 |
| Speech Language Pathologist | 0 | 4 | 4 | 507 | 69 | 76% | 6.6 |
| Nurse Practitioner | 1 | 0 | 1 | 496 | 56 | 62% | 8.9 |
| Physical Therapy Assistant | 0 | 6 | 6 | 380 | 57 | 63% | 6.4 |
| Respiratory Therapy Technician | 0 | 5 | 5 | 378 | 69 | 76% | 4.5 |
| Qualified Social Worker | 0 | 1 | 1 | 229 | 66 | 73% | 3.5 |
| Medical Director | 0 | 1 | 1 | 45 | 60 | 66% | 0.7 |
| Occupational Therapy Assistant | 0 | 2 | 2 | 44 | 23 | 25% | 1.9 |
Source: CMS Long-Term Care Facility Characteristics (Data as of Jan 2026)
Residents meet regularly to discuss policies, care quality, and activities
Organized group of residents that meets regularly to discuss facility policies, quality of life, and activities.
Data sourced from CMS Long-Term Care Facility Characteristics quarterly report. Payer mix reflects the current resident census by primary payment source.
These measures show how residents usually do over time at this home, based on health outcomes and preventive care.
Delaware average: 9.6
Delaware average: 19.0
Delaware average: 15.4%
Delaware average: 19.8%
Delaware average: 22.1%
Delaware average: 3.0%
Delaware average: 4.4%
Delaware average: 2.1%
Delaware average: 5.8%
Delaware average: 6.0%
Delaware average: 11.0%
Delaware average: 95.3%
Delaware average: 97.4%
Delaware average: 1.83
Delaware average: 1.37
Delaware average: 82.1%
Delaware average: 0.9%
Delaware average: 83.1%
Delaware average: 21.5%
Delaware average: 11.2%
Delaware average: 0.8%
Delaware average: 53.7%
Delaware average: 50.6%
Quality measures are calculated from Minimum Data Set (MDS) assessments. For most measures, lower percentages indicate better care quality.
Historical financial and operational data for Kentmere Rehabilitation and Healthcare Center based on CMS SNF Cost Reports.
Loading trend charts...
Care Cost Calculator: See Prices in Your Area
Nursing Home Data Explorer
Don’t Wait Too Long: 7 Red Flag Signs Your Parent Needs Assisted Living Now
The True Cost of Assisted Living in 2025 – And How Families Are Paying For It
Understanding Senior Living Costs: Pricing Models, Discounts & Financial Assistance

Touring a community? Use this expert-backed checklist to stay organized, ask the right questions, and find the perfect fit.
We'll send you a PDF version of the touring checklist.