La Plata Nursing Home
CMS overall rating Info CMS (the Centers for Medicare & Medicaid Services) is the federal agency that rates nursing home quality. Its Overall Rating runs from 1 to 5 stars, combining health inspections, staffing, and quality measures, with inspections weighted most heavily.

La Plata Nursing Home

CMS overall rating Info CMS (the Centers for Medicare & Medicaid Services) is the federal agency that rates nursing home quality. Its Overall Rating runs from 1 to 5 stars, combining health inspections, staffing, and quality measures, with inspections weighted most heavily.
Calculator: See prices in your area
La Plata Nursing Home accepts Medicare, Medicaid, and private pay.

Overview of La Plata Nursing Home

La Plata Nursing Home is a nursing home in La Plata, MO, offering rehabilitation and skilled nursing. The community promotes a nurturing and welcoming environment to ensure older adults’ comfort and safety. 24-hour care, housekeeping, and nutritious meals are also offered to enrich residents’ living experiences. Through a holistic approach to care, the community strives to meet residents’ unique needs and preferences.

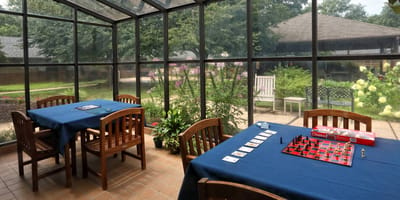
Light exercises, social events, and various games provide residents with more opportunities to explore new interests and have fun. Thoughtfully furnished rooms and cozy common areas also ensure residents have more spaces to rest and interact with their surroundings. Nestled in the tree-lined residential area of La Plata, residents are guaranteed a stress-free retirement. This nursing home is a good option for senior living in Missouri, as it has dedicated services for older adults’ welfare.

Quality ratings

Measured by Centers for Medicare & Medicaid Services (CMS)

Overall rating Info The Overall CMS Rating combines results from health inspections, staffing levels and quality measures. Health inspections carry the most weight. Staffing and quality scores can increase or decrease the final rating based on performance compared to state and national standards.
▲ 20.8% Above MO avg. ▲ 20.8% Above MO avg.MO average: 2.5Click the badge to see the full State ranking.Click here to see the full State ranking.
Health Inspection Info Based on the results of the facility's three most recent standard inspections and any complaint investigations. CMS reviews the number, scope, and severity of deficiencies, with more recent findings weighted more heavily.
▲ 8.1% Above MO avg. ▲ 8.1% Above MO avg.MO average: 2.8Click the badge to see the full State ranking.Click here to see the full State ranking.
Staffing Info Measures average nursing staff hours per resident per day, including Registered Nurses (RNs) and total nursing staff. Ratings are adjusted based on the level of care residents require and are compared to state and national benchmarks.
▲ 82.8% Above MO avg. ▲ 82.8% Above MO avg.MO average: 2.2Click the badge to see the full State ranking.Click here to see the full State ranking.
Quality Measures Info Based on clinical and physical health indicators reported to CMS, such as hospital readmissions, falls, pressure ulcers, and improvements in mobility. These measures reflect how well residents' health needs are being managed.
▲ 12.9% Above MO avg. ▲ 12.9% Above MO avg.MO average: 2.7Click the badge to see the full State ranking.Click here to see the full State ranking.

Staffing hours breakdown

Info Daily nursing hours per resident by staff type, reported to CMS. Higher is generally better — compare this facility to state and national averages to see where staffing stands.

Hours per resident per day — compared to Missouri state averages

Total nursing care / resident Info This home is ranked 78th out of 282 homes in Missouri for nurse hours. Total adjusted nursing hours per resident per day, combining RN, LPN, and aide time. CMS adjusts this for case-mix so facilities can be fairly compared.
4h 12m per day
Rank #78 / 282Nurse hours — State benchmarkedThis home is ranked 78th out of 282 homes in Missouri. Shows adjusted nurse hours per resident per day benchmarked to the Missouri average, with a ranking across 282 Missouri facilities. More hours mean more direct care. The national average is about 3.5 hrs; below 3.0 is a red flag.Rankings are based only on facilities in Missouri that report data for that category. Facilities without available data are excluded from the ranking.Click the rank badge to see the full State ranking.Click here to see the full State ranking.
This facility Missouri avg (3h 44m per day)
vs Missouri avg
+13%

3 of 6 metrics below state avg

Standout metric Nurse Aide is +11% above state avg
Staff typeHours / Day / Residentvs state avg
Registered Nurse (RN) Info RNs hold the highest nursing license and can assess residents, interpret test results, and direct care plans. More RN hours per day often signals stronger clinical oversight and faster response to health changes. 18m per day ▼ 33% State avg: 28m per day · National avg: 41m per day
LPN / LVN Info Licensed Practical Nurses (LPNs) or Licensed Vocational Nurses (LVNs) deliver routine hands-on care — medication administration, wound dressing, and monitoring vital signs. They work under RN supervision and make up a large share of daily bedside care. 42m per day ■ Avg State avg: 41m per day · National avg: 52m per day
Nurse Aide Info Certified Nurse Aides (CNAs) provide the most direct day-to-day assistance: bathing, dressing, feeding, and mobility. Nurse aide hours are typically the largest staffing category and directly affect residents' quality of life. 2h 34m per day ▲ 11% State avg: 2h 19m per day · National avg: 2h 20m per day
Weekend Total Nursing Info Combined nursing hours (RN + LPN + Nurse Aide) per resident per day on weekends. Staffing often drops on weekends — this figure reveals whether the facility maintains adequate coverage outside of weekday hours. 3h 7m per day ■ Avg State avg: 3h 3m per day · National avg: 3h 27m per day
Physical Therapist Info Hours per resident per day provided by licensed Physical Therapists (PTs) or PT Assistants. PT services help residents recover mobility after injury or illness and are especially important for post-acute (short-stay) rehabilitation. 0m per day ▼ 89% State avg: 3m per day · National avg: 4m per day
Weekend RN Info Registered nurse hours specifically on weekends. Facilities sometimes reduce RN presence on Saturdays and Sundays — a low weekend RN figure compared to weekday hours can indicate reduced clinical oversight when most administrative staff are absent. 16m per day ▼ 22% State avg: 20m per day · National avg: 29m per day

Capacity and availability

This home usually has availability

Higher occupancy than the Missouri average: 66.6%
Occupancy rate
84.4% Rank #82 / 434Occupancy rate — State benchmarkedThis home is ranked 82nd out of 434 homes in Missouri. Shows this facility's occupancy rate versus the Missouri average, with its Statewide rank out of 434. Higher occupancy signals strong local demand and financial stability.Rankings are based only on facilities in Missouri that report data for that category. Facilities without available data are excluded from the ranking.Click the rank badge to see the full State ranking.Click here to see the full State ranking.
Avg. Length of Stay
211 days
Bed community size
52-bed community Rank #384 / 454Bed count — State benchmarkedThis home is ranked 384th out of 454 homes in Missouri. Shows this facility's certified or reported bed count compared to other Missouri facilities. Larger communities may offer more amenities, programs, and on-site services for residents and families.Rankings are based only on facilities in Missouri that report data for that category. Facilities without available data are excluded from the ranking.Click the rank badge to see the full State ranking.Click here to see the full State ranking.
A moderately sized community that may balance personal attention with shared amenities and social activities.
Walk Score
Walk Score: 12 / 100 Rank #490 / 563Walk Score — State benchmarkedThis home is ranked 490th out of 563 homes in Missouri. Shows how walkable this facility's neighborhood is compared to the average Walk Score across Missouri facilities. Higher scores benefit residents, families, and staff.Rankings are based only on facilities in Missouri that report data for that category. Facilities without available data are excluded from the ranking.Click the rank badge to see the full State ranking.Click here to see the full State ranking.
Car-dependent. Most errands require a car, with limited nearby walkable options.

Safety & Compliance

Hoyer Lift

Therapy & Rehabilitation

2 services
Rehabilitation Services
Respite Care

Staffing & Medical

1 service
24-Hour Staffing

Additional Policies & Features

Visitor PolicyFlexible visitation hours.

Amenities & Lifestyle

Gym
Barber
Restaurant
Concierge
Housekeeping
Laundry
Dining Services
Activities
Wellness Programtherapy gym, beauty/barber services
Specific ProgramsVolunteer, Complete Care at La Plata, What to Expect

Contact La Plata Nursing Home

Staffing Data

Reporting period: October 1 – December 31, 2025 (Q4 2025). Source: CMS Payroll-Based Journal report.

Total staff 71
Employees 57
Contractors 14
Staff to resident ratio 1.69 : 1
0% compared with Missouri average
Missouri average ratio: 1.69 : 1 Missouri average ratio: 1.69 : 1See full Missouri ranking
Avg staff/day 26
Average shift 6.9 hours
15% worse than Missouri average
Missouri average: 8.1 hours Missouri average shift: 8.1 hoursSee full Missouri ranking
Total staff hours (quarter) 16,392

Nursing staff breakdown

Q4 2025 · Oct 1 – Dec 31 More info This data comes from the CMS Payroll-Based Journal report covering October 1 – December 31, 2025.
Registered Nurse

Manages medical care and health needs.

RN Staff Info All 3 RN Staff are full-time employees. No contractors work on this role. 3
Average shift length Info Average shift length. Calculated as total hours divided by days worked and average staff per day. 7.7 hours
Licensed Practical Nurse

Assists with medical care and medications.

LPN Staff Info All 9 LPN Staff are full-time employees. No contractors work on this role. 9
Average shift length Info Average shift length. Calculated as total hours divided by days worked and average staff per day. 7.5 hours
Certified Nursing Assistant

Helps with daily care and mobility.

CNA Staff Info All 19 CNA Staff are full-time employees. No contractors work on this role. 19
Average shift length Info Average shift length. Calculated as total hours divided by days worked and average staff per day. 7.1 hours

Contractor staffing

Q4 2025 · Oct 1 – Dec 31 More info This data comes from the CMS Payroll-Based Journal report covering October 1 – December 31, 2025.

Total hours from contractors

2.1%

346 contractor hours this quarter

Speech Language Pathologist: 3 Respiratory Therapy Technician: 3 Physical Therapy Assistant: 2 Physical Therapy Aide: 2 Qualified Social Worker: 1 Medical Director: 1 Occupational Therapy Assistant: 1 Occupational Therapy Aide: 1

Staff by category

Q4 2025 · Oct 1 – Dec 31 More info This data comes from the CMS Payroll-Based Journal report covering October 1 – December 31, 2025.
Certified Nursing Assistant190195,70192100%7.1
Licensed Practical Nurse9092,47192100%7.5
Medication Aide/Technician6062,34292100%7.3
Nurse Aide in Training110112,2179199%6.8
Registered Nurse3037788188%7.7
Dietitian1014946470%7.7
Nurse Practitioner1014545964%7.7
Therapeutic Recreation Specialist1014335863%7.5
Administrator1013985358%7.5
RN Director of Nursing1012974650%6.5
Dental Services Staff3032775155%4
Mental Health Service Worker1011862527%7.5
Physical Therapy Aide0221165358%2.1
Speech Language Pathologist033924650%1.8
Physical Therapy Assistant022372224%1.7
Medical Director011361213%3
Occupational Therapy Aide0112433%8
Respiratory Therapy Technician033201820%1.1
Occupational Therapy Assistant0111233%4
Qualified Social Worker011967%1.5
19 Certified Nursing Assistant
% of Days 100%
9 Licensed Practical Nurse
% of Days 100%
6 Medication Aide/Technician
% of Days 100%
11 Nurse Aide in Training
% of Days 99%
3 Registered Nurse
% of Days 88%
1 Dietitian
% of Days 70%
1 Nurse Practitioner
% of Days 64%
1 Therapeutic Recreation Specialist
% of Days 63%
1 Administrator
% of Days 58%
1 RN Director of Nursing
% of Days 50%
3 Dental Services Staff
% of Days 55%
1 Mental Health Service Worker
% of Days 27%
2 Physical Therapy Aide
% of Days 58%
3 Speech Language Pathologist
% of Days 50%
2 Physical Therapy Assistant
% of Days 24%
1 Medical Director
% of Days 13%
1 Occupational Therapy Aide
% of Days 3%
3 Respiratory Therapy Technician
% of Days 20%
1 Occupational Therapy Assistant
% of Days 3%
1 Qualified Social Worker
% of Days 7%

Penalties and fines

Federal penalties imposed by CMS for regulatory violations, including civil money penalties (fines) and denials of payment for new Medicare/Medicaid admissions.

Source: CMS Penalties Database (Data as of Jan 2026)

Total fines amount $174K Rank #1 / 289Federal fines — State benchmarkedThis home is ranked 1st out of 289 homes in Missouri. Shows this facility's cumulative CMS federal fine dollars versus the Missouri average among facilities with fines, and where it ranks among 289 facilities in the pool. Lower total dollars mean a better rank.Rankings are based only on facilities in Missouri that report data for that category. Facilities without available data are excluded from the ranking.Click the rank badge to see the full State ranking.Click here to see the full State ranking.
138% higher than Missouri average

Missouri average: $73K

Number of fines 1
59% fewer fines than Missouri average

Missouri average: 2.4

Payment Denials Info Serious action where Medicare and/or Medicaid temporarily stops payments for new residents until issues are fixed. 1
45% more payment denials than Missouri average

Missouri average: 0.7

Fines amount comparison
This facility $174K
Missouri average $73K

No penalties in the past 3 years

No civil money penalties or payment denials were reported in the last 3 years.

Quality of care over time

These measures show how residents usually do over time at this home, based on health outcomes and preventive care.

High-risk clinical events score Info A composite score based on pressure ulcers, falls with injury, weight loss, walking ability decline, and activities of daily living decline. 6.6
40% better than Missouri average

Missouri average: 10.9

Functional decline score Info A composite score based on activities of daily living decline, walking ability decline, and incontinence. 6.8
65% better than Missouri average

Missouri average: 19.5

Long-stay resident measures
Need for Help with Daily Activities Increased Info Percent of long-stay residents whose need for help with daily activities has increased 12.1%
39% better than Missouri average

Missouri average: 19.8%

Walking Ability Worsened Info Percent of long-stay residents whose ability to move independently worsened 5.1%
75% better than Missouri average

Missouri average: 20.6%

Low Risk Residents with Bowel/Bladder Incontinence Info Percent of low risk long-stay residents who lose control of their bowels or bladder 3.0%
83% better than Missouri average

Missouri average: 18.1%

Falls with Major Injury Info Percent of long-stay residents experiencing one or more falls with major injury 8.9%
121% worse than Missouri average

Missouri average: 4.0%

High Risk Residents with Pressure Ulcers Info Percent of long-stay high risk residents with pressure ulcers 1.8%
63% better than Missouri average

Missouri average: 5.0%

Urinary Tract Infection Info Percent of long-stay residents with a urinary tract infection 8.0%
194% worse than Missouri average

Missouri average: 2.7%

Lost Too Much Weight Info Percent of long-stay residents who lose too much weight 4.9%
12% better than Missouri average

Missouri average: 5.6%

Depressive Symptoms Info Percent of long-stay residents who have depressive symptoms 0.0%
100% better than Missouri average

Missouri average: 12.8%

Antipsychotic Use Info Percent of long-stay residents who received an antipsychotic medication 26.0%
18% worse than Missouri average

Missouri average: 22.0%

Pneumococcal Vaccine Info Percent of long-stay residents assessed and appropriately given the pneumococcal vaccine 82.2%
In line with Missouri average

Missouri average: 85.2%

Influenza Vaccine Info Percent of long-stay residents assessed and appropriately given the seasonal influenza vaccine 76.2%
16% worse than Missouri average

Missouri average: 90.9%

Short-stay resident measures
Pneumococcal Vaccine Info Percent of short-stay residents assessed and appropriately given the pneumococcal vaccine 79.4%
19% better than Missouri average

Missouri average: 66.6%

Antipsychotic medication increase Info Percent of short-stay residents who newly received an antipsychotic medication 0.0%
100% better than Missouri average

Missouri average: 2.2%

Breakdown by payment type

Medicare

35% of new residents, usually for short-term rehab.

Typical stay 2 - 3 months

Private pay

24% of new residents, often for short stays.

Typical stay 1 - 2 years

Medicaid

41% of new residents, often for long-term daily care.

Typical stay 1 - 2 years

Facility Characteristics

Source: CMS Long-Term Care Facility Characteristics (Data as of Jan 2026)

Total residents 42
Medicare
3
7.1% of residents
Medicaid
22
52.4% of residents
Private pay or other
17
40.5% of residents
Programs & Services
Residents Group

Residents meet regularly to discuss policies, care quality, and activities

Active Resident Council

Organized group of residents that meets regularly to discuss facility policies, quality of life, and activities.

Finances and operations

Based on CMS SNF Cost Report for fiscal year ending in 12/2023.

Government
Operated by federal authorities.
Net patient revenue Info Net patient revenue — what the home actually collects for resident care, after contractual allowances, bad debt and discounts are subtracted from its gross charges (CMS cost report, Worksheet G-3). It covers resident care only; money the home earns from other sources is shown separately as "Other income."
$3.1M
Net patient income Info Net patient income: net patient revenue minus the home's total operating expenses. A positive figure means it earns more from resident care than it spends to deliver it; a negative figure means the opposite. It excludes non-operating "other income."
-$270.5K
Government Operated by federal authorities.
Net patient revenue Info Net patient revenue — what the home actually collects for resident care, after contractual allowances, bad debt and discounts are subtracted from its gross charges (CMS cost report, Worksheet G-3). It covers resident care only; money the home earns from other sources is shown separately as "Other income."
$3.1M Rank #251 / 292Revenue — State benchmarkedThis home is ranked 251st out of 292 homes in Missouri. Shows this facility's annual revenue compared to the Missouri average. Higher revenue generally means more resources for staffing and capital — read alongside Payroll %.Rankings are based only on facilities in Missouri that report data for that category. Facilities without available data are excluded from the ranking.Click the rank badge to see the full State ranking.Click here to see the full State ranking.
Net patient income Info Net patient income: net patient revenue minus the home's total operating expenses. A positive figure means it earns more from resident care than it spends to deliver it; a negative figure means the opposite. It excludes non-operating "other income."
-$270.5K
Other income Info Money the home earns outside of resident care — such as investments, grants, rentals and other non-operating sources (CMS cost report, Worksheet G-3). It is tracked separately from net patient revenue: it is not part of that figure, and it is not included in net patient income.
$166.1K
Payroll costs Info Staff salaries plus wage-related costs — benefits such as payroll taxes, health insurance and retirement — from the home's own accounting records (CMS cost report, Worksheet A). Contract or agency labor is counted separately, under other operating costs. Rank #245 / 292Payroll — State benchmarkedThis home is ranked 245th out of 292 homes in Missouri. Shows total annual staff payroll benchmarked to the Missouri average. Higher payroll investment relative to peers often signals better staffing and less reliance on cheaper contract labor.Rankings are based only on facilities in Missouri that report data for that category. Facilities without available data are excluded from the ranking.Click the rank badge to see the full State ranking.Click here to see the full State ranking.
$2.1M 68.8% of net patient revenue Info Payroll as a share of revenue: staff salaries and wage-related benefits divided by net patient revenue. A higher figure means more of each revenue dollar goes to staff pay. Rank #120 / 292Payroll % — State benchmarkedThis home is ranked 120th out of 292 homes in Missouri. Shows payroll as a percentage of revenue versus the Missouri average. Well-run Missouri facilities typically land around 60–71% — the top third Statewide. Below 25% may signal understaffing or heavy agency use — read with Staffing ratings.Rankings are based only on facilities in Missouri that report data for that category. Facilities without available data are excluded from the ranking.Click the rank badge to see the full State ranking.Click here to see the full State ranking.
Other operating costs Info Everything it costs to run the home apart from payroll — food, utilities, supplies, maintenance, contract labor and administration. Calculated as total operating expense minus payroll (staff salaries and wage-related benefits).
$1.2M
Total costs Info The home's total operating expense for the year — all the costs of running it, salaries included (CMS cost report, Worksheet G-3).
$3.4M

What does this home offer?

Building type icon
Building type icon

Building Type: Single-story

Social and recreational activities icon

Social and Recreational Activities

Rehabilitative support icon

Rehabilitative Support

On-site medical care and health services icon

On-site Medical Care and Health Services

Who this home usually serves

TYPE OF STAY

Mostly long-term care residents

Most residents stay for extended periods and receive ongoing daily care.

New residents most often arrive under Medicaid (41% of admissions), and a typical Medicaid stay runs around 1 - 2 years.

Admissions
49 total

Coverage residents most often arrive under.

Medicare 35%
Private pay 24%
Medicaid 41%
Discharges
76 total

Coverage residents most often leave under.

Medicare 24%
Private pay 32%
Medicaid 45%

Places of interest near La Plata Nursing Home

Address 100 Old Stagecoach Rd, La Plata, MO 63549

Calculate Travel Distance to La Plata Nursing Home

Add your location

Address

Compare Nursing Homes around Kirksville

The information below is reported by the Missouri Department of Health and Senior Services, Division of Regulation and Licensure.

3 facilities compared · CMS & MO Dept. of Health data

La Plata Nursing Home
NH
La Plata
52
Facility 52
MO AVG 97
Rank #384 / 454
84.4%
Facility 84.4%
MO AVG 66.6%
Rank #82 / 434
+27%
4.21
Facility 4.21
MO AVG 3.74
Rank #78 / 282
-45%+13%
$0
Facility $0
MO AVG $76.9k
Rank #1 / 289
30
Facility 30
MO AVG 36.5
Rank #140 / 287
6.0
Facility 6.0
MO AVG 5.7
Rank #182 / 287
244-
12
Facility 12
MO AVG 45
Rank #490 / 563
La Plata Nursing Home District
$3.1M
Facility $3.1M
MO AVG $8.4M
Rank #251 / 292
$2.1M
Facility $2.1M
MO AVG $3.3M
Rank #245 / 292
68.8%
Facility 68.8%
MO AVG 45.6%
Rank #120 / 292
265793
The Pines
NH
Kirksville (Preston Vineyards)
120
Facility 120
MO AVG 97
Rank #89 / 454
54.6%
Facility 54.6%
MO AVG 66.6%
Rank #320 / 434
-18%
5.16
Facility 5.16
MO AVG 3.74
Rank #21 / 282
+3%+38%
$0
Facility $0
MO AVG $76.9k
Rank #1 / 289
32
Facility 32
MO AVG 36.5
Rank #154 / 287
10.7
Facility 10.7
MO AVG 5.7
Rank #280 / 287
-72-
44
Facility 44
MO AVG 45
Rank #307 / 563
-
$6.6M
Facility $6.6M
MO AVG $8.4M
Rank #92 / 292
$4.6M
Facility $4.6M
MO AVG $3.3M
Rank #97 / 292
69%
Facility 69%
MO AVG 45.6%
Rank #168 / 292
265198
Kirksville Manor Care Center
NH
HC
MC
RC
Kirksville
132
Facility 132
MO AVG 97
Rank #72 / 454
36.4%
Facility 36.4%
MO AVG 66.6%
Rank #397 / 434
-45%
4.51
Facility 4.51
MO AVG 3.74
Rank #48 / 282
-57%+21%
$250.8k
Facility $250.8k
MO AVG $76.9k
Rank #284 / 289
47
Facility 47
MO AVG 36.5
Rank #219 / 287
5.9
Facility 5.9
MO AVG 5.7
Rank #178 / 287
748-
24
Facility 24
MO AVG 45
Rank #429 / 563
Kirksville Manor Inc
$5.0M
Facility $5.0M
MO AVG $8.4M
Rank #228 / 292
$3.5M
Facility $3.5M
MO AVG $3.3M
Rank #130 / 292
70.9%
Facility 70.9%
MO AVG 45.6%
Rank #3 / 292
265247

Financial Assistance for
Nursing Home in Missouri

La Plata Nursing Home is located in La Plata, Missouri.
Here are the financial assistance programs available to residents in Missouri.

Get Financial aid guidance

Aged and Disabled Waiver

Missouri Medicaid A&D Waiver

Age 65+ or disabled
General Missouri resident, Medicaid- eligible, nursing home-level care need.
Income Limits (2025) ~$2,829/month 300% FBR, individual
Asset Limits $2,000 (individual), $3,000 (couple).
MO

Rural access prioritized.

Benefits
Personal care (5-7 hours/day) Respite (240 hours/year) Adult day care (~$65/day) Home health services

Missouri Supplemental Nursing Care (SNC)

MO SNC

Age 65+
General Missouri resident, in approved facility.
Income Limits ~$1,215/month individual
Asset Limits $2,000 individual
MO

Supplements SSI; facility-based only.

Benefits
Monthly cash payment (~$156-$292/month) for care costs

Structured Family Caregiving Waiver (SFCW)

Missouri Structured Family Caregiving Waiver

Age 65+
General Missouri resident, MO HealthNet-eligible, NFLOC, dementia diagnosis, live with caregiver.
Income Limits (2025) ~$2,901/month (300% FBR, individual); QIT required.
Asset Limits $5,909.25 (individual), $11,818.45 (couple).
MO

Caregiver must be family; small program size.

Benefits
Cash stipend ($1,000-$1,500/month) to family caregiver Respite Training Supplies ($500/year)

MO HealthNet Aged, Blind, and Disabled (ABD)

Missouri MO HealthNet ABD

Age 65+ or disabled
General Missouri resident, MO HealthNet-eligible, needs help with 1+ ADL.
Income Limits (2025) ~$1,690/month (individual, projected); spenddown allowed.
Asset Limits $5,909.25 (individual), $11,818.45 (couple).
MO

Less intensive than waivers; statewide access.

Benefits
Personal care (2-4 hours/day) Homemaker services Limited respite Medical equipment

Medicare Savings Program (MSP)

Missouri Medicare Savings Program

Age 65+ or disabled
General Missouri resident, Medicare Part A/B.
Income Limits (2025) ~$2,510/month (QMB), ~$3,380/month (SLMB), ~$3,598/month (QI)—individual.
Asset Limits $9,430 (individual), $14,130 (couple).
MO

Three tiers; no waitlist; includes Extra Help for Part D.

Benefits
Covers Part B premiums ($174.70/month) Deductibles ($240/year) Copays (~20%)

Missouri Caregiver Program (Customized Caregiver Training & Relief)

Missouri Caregiver Program

Age
General Caregivers of 60+ with dementia, Missouri resident, functional needs (2+ ADLs).
Income Limits (2025) No strict cap; prioritizes low-income ~$24,980/year individual
Asset Limits Not assessed; need-based.
MO

Administered via AAAs and Alzheimer’s Association; rural focus.

Benefits
Respite (4-6 hours/week) Training Assistive tech ($500/year) Supplies

VA Aid and Attendance (A&A) and Housebound Benefits

Missouri VA Aid and Attendance/Housebound

Age 65+ or disabled veteran/spouse
General Missouri resident, wartime service, need for ADL help (A&A) or homebound.
Income Limits (2025) Net income < ~$1,984/month (veteran with dependent, A&A); pension offsets income.
Asset Limits ~$155,356 net worth limit
MO

High veteran demand in rural/urban areas.

Benefits
Cash (~$1,433-$2,642/month veteran, ~$951-$1,318 spouse) for care costs (e.g., in-home, assisted living)

Frequently Asked Questions about La Plata Nursing Home

Is La Plata Nursing Home in a walkable area?

La Plata Nursing Home has a walk score of 12. Car-dependent. Most errands require a car, with limited nearby walkable options.

What is the occupancy rate at La Plata Nursing Home?

La Plata Nursing Home's occupancy is 84.4%.

Is La Plata Nursing Home a government-operated facility?

La Plata Nursing Home is a government-operated nursing facility.

Are there photos of La Plata Nursing Home?

Yes — there are 6 photos of La Plata Nursing Home in the photo gallery on this page.

What is the address of La Plata Nursing Home?

La Plata Nursing Home is located at 100 Old Stagecoach Rd, La Plata, MO 63549.

What is the phone number of La Plata Nursing Home?

(660) 332-4315 will put you in contact with the team at La Plata Nursing Home.

Is La Plata Nursing Home Medicare or Medicaid certified?

Yes — La Plata Nursing Home is a CMS-certified provider of Medicare and Medicaid.

Guides for Better Senior Living

Care Cost Calculator: See Prices in Your Area

Nursing Home Data Explorer

Don’t Wait Too Long: 7 Red Flag Signs Your Parent Needs Assisted Living Now

The True Cost of Assisted Living in 2025 – And How Families Are Paying For It

Understanding Senior Living Costs: Pricing Models, Discounts & Financial Assistance