LakePointe Senior Care & Rehab Center
CMS overall rating Info CMS (the Centers for Medicare & Medicaid Services) is the federal agency that rates nursing home quality. Its Overall Rating runs from 1 to 5 stars, combining health inspections, staffing, and quality measures, with inspections weighted most heavily.

LakePointe Senior Care & Rehab Center

CMS overall rating Info CMS (the Centers for Medicare & Medicaid Services) is the federal agency that rates nursing home quality. Its Overall Rating runs from 1 to 5 stars, combining health inspections, staffing, and quality measures, with inspections weighted most heavily.
Calculator: See prices in your area
LakePointe Senior Care & Rehab Center accepts Medicare, Medicaid, and private pay.

Overview of Lakepointe Senior Care & Rehab Center

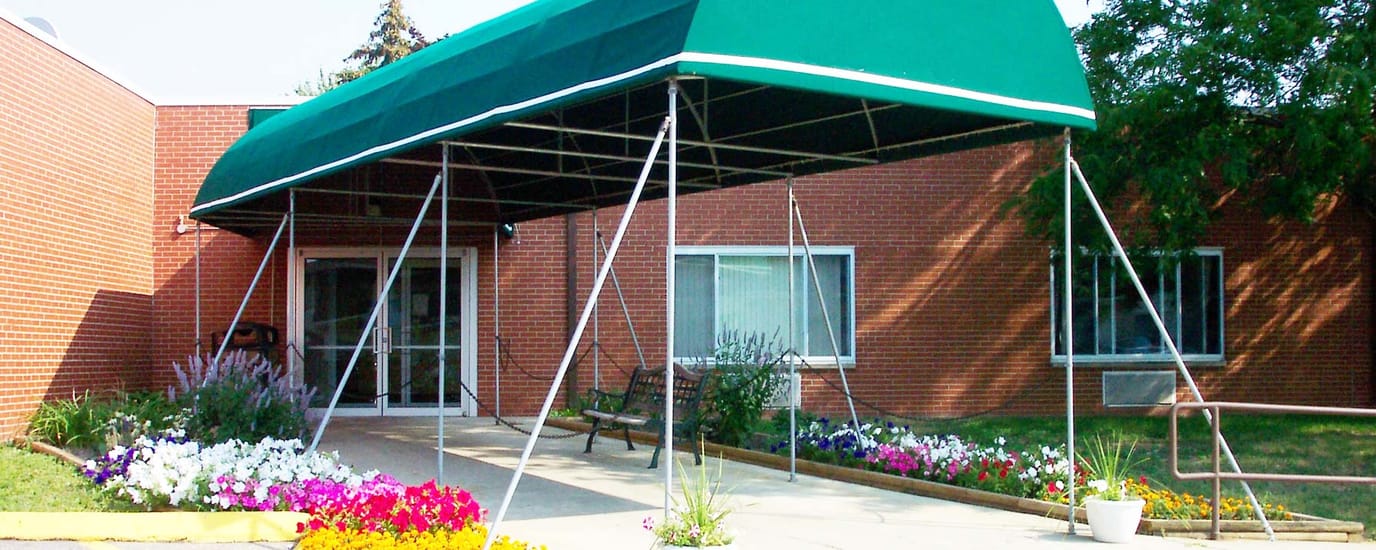
LakePointe Senior Care & Rehab Center is a nursing home in Clinton Township, MI, offering long-term care and rehabilitation. The community’s warm and supportive environment also ensures older adults are treated well throughout their stay. With 24/7 care, therapies seven days a week, and restaurant-style dining, residents can focus on their healing and recovery. Focusing on residents’ holistic wellness, customized care plans are also provided based on their needs and preferences.

Stretching exercises, off-site activities, and social events encourage residents to live actively and gain meaningful experiences. A salon/ barbershop and lively gathering areas also ensure residents’ relaxation. Set along the Clinton River Spillway, near restaurants and a marketplace in Clinton Township, the community guarantees accessibility and convenience. This nursing home has exceptional standards of care, making it a great choice for senior living in Michigan.

Quality ratings

Measured by Centers for Medicare & Medicaid Services (CMS)

Overall rating Info The Overall CMS Rating combines results from health inspections, staffing levels and quality measures. Health inspections carry the most weight. Staffing and quality scores can increase or decrease the final rating based on performance compared to state and national standards.
▲ 59.4% Above MI avg. ▲ 59.4% Above MI avg.MI average: 3.1Click the badge to see the full State ranking.Click here to see the full State ranking.
Health Inspection Info Based on the results of the facility's three most recent standard inspections and any complaint investigations. CMS reviews the number, scope, and severity of deficiencies, with more recent findings weighted more heavily.
▲ 76.9% Above MI avg. ▲ 76.9% Above MI avg.MI average: 2.8Click the badge to see the full State ranking.Click here to see the full State ranking.
Staffing Info Measures average nursing staff hours per resident per day, including Registered Nurses (RNs) and total nursing staff. Ratings are adjusted based on the level of care residents require and are compared to state and national benchmarks.
▼ 14.2% Below MI avg. ▼ 14.2% Below MI avg.MI average: 3.5Click the badge to see the full State ranking.Click here to see the full State ranking.
Quality Measures Info Based on clinical and physical health indicators reported to CMS, such as hospital readmissions, falls, pressure ulcers, and improvements in mobility. These measures reflect how well residents' health needs are being managed.
▲ 6.4% Above MI avg. ▲ 6.4% Above MI avg.MI average: 3.8Click the badge to see the full State ranking.Click here to see the full State ranking.

Staffing hours breakdown

Info Daily nursing hours per resident by staff type, reported to CMS. Higher is generally better — compare this facility to state and national averages to see where staffing stands.

Hours per resident per day — compared to Michigan state averages

Total nursing care / resident Info This home is ranked 77th out of 142 homes in Michigan for nurse hours. Total adjusted nursing hours per resident per day, combining RN, LPN, and aide time. CMS adjusts this for case-mix so facilities can be fairly compared.
3h 54m per day
Rank #77 / 142Nurse hours — State benchmarkedThis home is ranked 77th out of 142 homes in Michigan. Shows adjusted nurse hours per resident per day benchmarked to the Michigan average, with a ranking across 142 Michigan facilities. More hours mean more direct care. The national average is about 3.5 hrs; below 3.0 is a red flag.Rankings are based only on facilities in Michigan that report data for that category. Facilities without available data are excluded from the ranking.Click the rank badge to see the full State ranking.Click here to see the full State ranking.
This facility Michigan avg (4h 18m per day)
vs Michigan avg
-9%

5 of 6 metrics below state avg

Standout metric LPN / LVN is +27% above state avg
Staff typeHours / Day / Residentvs state avg
Registered Nurse (RN) Info RNs hold the highest nursing license and can assess residents, interpret test results, and direct care plans. More RN hours per day often signals stronger clinical oversight and faster response to health changes. 24m per day ▼ 48% State avg: 46m per day · National avg: 41m per day
LPN / LVN Info Licensed Practical Nurses (LPNs) or Licensed Vocational Nurses (LVNs) deliver routine hands-on care — medication administration, wound dressing, and monitoring vital signs. They work under RN supervision and make up a large share of daily bedside care. 1h 8m per day ▲ 27% State avg: 53m per day · National avg: 52m per day
Nurse Aide Info Certified Nurse Aides (CNAs) provide the most direct day-to-day assistance: bathing, dressing, feeding, and mobility. Nurse aide hours are typically the largest staffing category and directly affect residents' quality of life. 2h 13m per day ▼ 5% State avg: 2h 20m per day · National avg: 2h 20m per day
Weekend Total Nursing Info Combined nursing hours (RN + LPN + Nurse Aide) per resident per day on weekends. Staffing often drops on weekends — this figure reveals whether the facility maintains adequate coverage outside of weekday hours. 3h 21m per day ▼ 4% State avg: 3h 31m per day · National avg: 3h 27m per day
Physical Therapist Info Hours per resident per day provided by licensed Physical Therapists (PTs) or PT Assistants. PT services help residents recover mobility after injury or illness and are especially important for post-acute (short-stay) rehabilitation. 2m per day ▼ 49% State avg: 4m per day · National avg: 4m per day
Weekend RN Info Registered nurse hours specifically on weekends. Facilities sometimes reduce RN presence on Saturdays and Sundays — a low weekend RN figure compared to weekday hours can indicate reduced clinical oversight when most administrative staff are absent. 11m per day ▼ 62% State avg: 29m per day · National avg: 29m per day

Capacity and availability

This home usually has limited availability

Higher occupancy than the Michigan average: 75.8%
Occupancy rate
89.8% Rank #34 / 395Occupancy rate — State benchmarkedThis home is ranked 34th out of 395 homes in Michigan. Shows this facility's occupancy rate versus the Michigan average, with its Statewide rank out of 395. Higher occupancy signals strong local demand and financial stability.Rankings are based only on facilities in Michigan that report data for that category. Facilities without available data are excluded from the ranking.Click the rank badge to see the full State ranking.Click here to see the full State ranking.
Avg. Length of Stay
128 days
Bed community size
134-bed community Rank #51 / 435Bed count — State benchmarkedThis home is ranked 51st out of 435 homes in Michigan. Shows this facility's certified or reported bed count compared to other Michigan facilities. Larger communities may offer more amenities, programs, and on-site services for residents and families.Rankings are based only on facilities in Michigan that report data for that category. Facilities without available data are excluded from the ranking.Click the rank badge to see the full State ranking.Click here to see the full State ranking.
A larger shared setting that may offer more common spaces and organized community services.
Walk Score
Walk Score: 61 / 100 Rank #125 / 703Walk Score — State benchmarkedThis home is ranked 125th out of 703 homes in Michigan. Shows how walkable this facility's neighborhood is compared to the average Walk Score across Michigan facilities. Higher scores benefit residents, families, and staff.Rankings are based only on facilities in Michigan that report data for that category. Facilities without available data are excluded from the ranking.Click the rank badge to see the full State ranking.Click here to see the full State ranking.
Moderately walkable. Some errands can be accomplished on foot, with a mix of nearby amenities.

Therapy & Rehabilitation

2 services
Rehabilitation Services
Short-Term Rehab

Amenities & Lifestyle

Salon
Restaurant
ActivitiesDaily personalized activities and off-site activities are available
Specific ProgramsPhysical, Occupational, and Speech Therapy, On-Site Dialysis, Daily Personalized Activities, Spiritual Support Services

Dining & Nutrition

Food DescriptionThe facility features restaurant-style dining.

Contact LakePointe Senior Care & Rehab Center

Staffing Data

Reporting period: October 1 – December 31, 2025 (Q4 2025). Source: CMS Payroll-Based Journal report.

Total staff 189
Employees 163
Contractors 26
Staff to resident ratio 1.45 : 1
14% fewer staff per resident than Michigan average
Michigan average ratio: 1.70 : 1 Michigan average ratio: 1.70 : 1See full Michigan ranking
Avg staff/day 77
Average shift 7.2 hours
9% worse than Michigan average
Michigan average: 7.9 hours Michigan average shift: 7.9 hoursSee full Michigan ranking
Total staff hours (quarter) 51,050

Nursing staff breakdown

Q4 2025 · Oct 1 – Dec 31 More info This data comes from the CMS Payroll-Based Journal report covering October 1 – December 31, 2025.
Registered Nurse

Manages medical care and health needs.

RN Staff Info All 12 RN Staff are full-time employees. No contractors work on this role. 12
Average shift length Info Average shift length. Calculated as total hours divided by days worked and average staff per day. 7.4 hours
Licensed Practical Nurse

Assists with medical care and medications.

LPN Staff Info All 48 LPN Staff are full-time employees. No contractors work on this role. 48
Average shift length Info Average shift length. Calculated as total hours divided by days worked and average staff per day. 7.2 hours
Certified Nursing Assistant

Helps with daily care and mobility.

CNA Staff Info All 87 CNA Staff are full-time employees. No contractors work on this role. 87
Average shift length Info Average shift length. Calculated as total hours divided by days worked and average staff per day. 7.2 hours

Contractor staffing

Q4 2025 · Oct 1 – Dec 31 More info This data comes from the CMS Payroll-Based Journal report covering October 1 – December 31, 2025.

Total hours from contractors

6.3%

3,197 contractor hours this quarter

Physical Therapy Assistant: 7 Physical Therapy Aide: 6 Respiratory Therapy Technician: 5 Speech Language Pathologist: 4 Physician Assistant: 1 Medical Director: 1 Qualified Social Worker: 1 Other Physician: 1

Staff by category

Q4 2025 · Oct 1 – Dec 31 More info This data comes from the CMS Payroll-Based Journal report covering October 1 – December 31, 2025.
Certified Nursing Assistant8708725,62392100%7.2
Licensed Practical Nurse4804812,98792100%7.2
Registered Nurse120123,39192100%7.4
Other Dietary Services Staff5051,92392100%7.2
Occupational Therapy Aide2029606470%8
Speech Language Pathologist0448868896%6.6
Physical Therapy Aide0667486368%6.8
Clinical Nurse Specialist4046895762%7.9
Physician Assistant0114926267%7.9
Nurse Practitioner1014725964%8
Mental Health Service Worker1014725964%8
Dietitian1014565762%8
Dental Services Staff1014485964%7.6
Administrator1014325459%8
Respiratory Therapy Technician0554056166%6.3
Physical Therapy Assistant0772895661%4
Qualified Social Worker0111454246%3.5
Other Physician0111242628%4.8
Medical Director0111082729%4
87 Certified Nursing Assistant
% of Days 100%
48 Licensed Practical Nurse
% of Days 100%
12 Registered Nurse
% of Days 100%
5 Other Dietary Services Staff
% of Days 100%
2 Occupational Therapy Aide
% of Days 70%
4 Speech Language Pathologist
% of Days 96%
6 Physical Therapy Aide
% of Days 68%
4 Clinical Nurse Specialist
% of Days 62%
1 Physician Assistant
% of Days 67%
1 Nurse Practitioner
% of Days 64%
1 Mental Health Service Worker
% of Days 64%
1 Dietitian
% of Days 62%
1 Dental Services Staff
% of Days 64%
1 Administrator
% of Days 59%
5 Respiratory Therapy Technician
% of Days 66%
7 Physical Therapy Assistant
% of Days 61%
1 Qualified Social Worker
% of Days 46%
1 Other Physician
% of Days 28%
1 Medical Director
% of Days 29%

Penalties and fines

Includes penalties issued in 2023

Federal penalties imposed by CMS for regulatory violations, including civil money penalties (fines) and denials of payment for new Medicare/Medicaid admissions.

Source: CMS Penalties Database (Data as of Jan 2026)

Total fines amount $34K Rank #104 / 145Federal fines — State benchmarkedThis home is ranked 104th out of 145 homes in Michigan. Shows this facility's cumulative CMS federal fine dollars versus the Michigan average among facilities with fines, and where it ranks among 145 facilities in the pool. Lower total dollars mean a better rank.Rankings are based only on facilities in Michigan that report data for that category. Facilities without available data are excluded from the ranking.Click the rank badge to see the full State ranking.Click here to see the full State ranking.
55% lower than Michigan average

Michigan average: $76K

Number of fines 1
51% fewer fines than Michigan average

Michigan average: 2.0

Payment Denials Info Serious action where Medicare and/or Medicaid temporarily stops payments for new residents until issues are fixed. 0
100% fewer payment denials than Michigan average

Michigan average: 0.8

Fines amount comparison
This facility $34K
Michigan average $76K
Penalty History

Penalties are imposed by CMS for violations of federal nursing home regulations.

1 penalty in the past 3 years

Jun 28, 2023 · $34K

Civil Money Penalty Info Fines imposed for noncompliance, which can be assessed per day or per instance of violation. Jun 28, 2023
$34K

Last updated: Jan 2026

Quality of care over time

These measures show how residents usually do over time at this home, based on health outcomes and preventive care.

High-risk clinical events score Info A composite score based on pressure ulcers, falls with injury, weight loss, walking ability decline, and activities of daily living decline. 8.1
In line with Michigan average

Michigan average: 8.4

Functional decline score Info A composite score based on activities of daily living decline, walking ability decline, and incontinence. 12.5
23% better than Michigan average

Michigan average: 16.3

Long-stay resident measures
Need for Help with Daily Activities Increased Info Percent of long-stay residents whose need for help with daily activities has increased 13.5%
8% worse than Michigan average

Michigan average: 12.5%

Walking Ability Worsened Info Percent of long-stay residents whose ability to move independently worsened 18.7%
22% worse than Michigan average

Michigan average: 15.3%

Low Risk Residents with Bowel/Bladder Incontinence Info Percent of low risk long-stay residents who lose control of their bowels or bladder 5.2%
75% better than Michigan average

Michigan average: 21.0%

Falls with Major Injury Info Percent of long-stay residents experiencing one or more falls with major injury 2.2%
31% better than Michigan average

Michigan average: 3.2%

High Risk Residents with Pressure Ulcers Info Percent of long-stay high risk residents with pressure ulcers 5.6%
In line with Michigan average

Michigan average: 5.7%

Urinary Tract Infection Info Percent of long-stay residents with a urinary tract infection 1.5%
9% better than Michigan average

Michigan average: 1.7%

Lost Too Much Weight Info Percent of long-stay residents who lose too much weight 0.5%
92% better than Michigan average

Michigan average: 5.7%

Depressive Symptoms Info Percent of long-stay residents who have depressive symptoms 0.0%
100% better than Michigan average

Michigan average: 3.9%

Antipsychotic Use Info Percent of long-stay residents who received an antipsychotic medication 22.3%
49% worse than Michigan average

Michigan average: 15.0%

Pneumococcal Vaccine Info Percent of long-stay residents assessed and appropriately given the pneumococcal vaccine 99.6%
5% better than Michigan average

Michigan average: 94.9%

Influenza Vaccine Info Percent of long-stay residents assessed and appropriately given the seasonal influenza vaccine 100.0%
5% better than Michigan average

Michigan average: 95.0%

Short-stay resident measures
Pneumococcal Vaccine Info Percent of short-stay residents assessed and appropriately given the pneumococcal vaccine 86.8%
5% better than Michigan average

Michigan average: 82.5%

Antipsychotic medication increase Info Percent of short-stay residents who newly received an antipsychotic medication 3.8%
162% worse than Michigan average

Michigan average: 1.4%

Influenza Vaccine Info Percent of short-stay residents assessed and appropriately given the seasonal influenza vaccine 78.2%
In line with Michigan average

Michigan average: 79.5%

Breakdown by payment type

Medicare

26% of new residents, usually for short-term rehab.

Typical stay 22 days

Private pay

36% of new residents, often for short stays.

Typical stay 1 - 2 months

Medicaid

38% of new residents, often for long-term daily care.

Typical stay 9 - 10 months

Facility Characteristics

Source: CMS Long-Term Care Facility Characteristics (Data as of Jan 2026)

Total residents 130
Medicare
11
8.5% of residents
Medicaid
97
74.6% of residents
Private pay or other
22
16.9% of residents
Programs & Services
Residents Group

Residents meet regularly to discuss policies, care quality, and activities

Active Resident Council

Organized group of residents that meets regularly to discuss facility policies, quality of life, and activities.

Finances and operations

Based on CMS SNF Cost Report for fiscal year ending in 12/2023.

For-profit
Operated by a single business entity.
Net patient revenue Info Net patient revenue — what the home actually collects for resident care, after contractual allowances, bad debt and discounts are subtracted from its gross charges (CMS cost report, Worksheet G-3). It covers resident care only; money the home earns from other sources is shown separately as "Other income."
$13.5M
Net patient income Info Net patient income: net patient revenue minus the home's total operating expenses. A positive figure means it earns more from resident care than it spends to deliver it; a negative figure means the opposite. It excludes non-operating "other income."
-$285.2K
For-profit Operated by a single business entity.
Net patient revenue Info Net patient revenue — what the home actually collects for resident care, after contractual allowances, bad debt and discounts are subtracted from its gross charges (CMS cost report, Worksheet G-3). It covers resident care only; money the home earns from other sources is shown separately as "Other income."
$13.5M Rank #58 / 143Revenue — State benchmarkedThis home is ranked 58th out of 143 homes in Michigan. Shows this facility's annual revenue compared to the Michigan average. Higher revenue generally means more resources for staffing and capital — read alongside Payroll %.Rankings are based only on facilities in Michigan that report data for that category. Facilities without available data are excluded from the ranking.Click the rank badge to see the full State ranking.Click here to see the full State ranking.
Net patient income Info Net patient income: net patient revenue minus the home's total operating expenses. A positive figure means it earns more from resident care than it spends to deliver it; a negative figure means the opposite. It excludes non-operating "other income."
-$285.2K
Other income Info Money the home earns outside of resident care — such as investments, grants, rentals and other non-operating sources (CMS cost report, Worksheet G-3). It is tracked separately from net patient revenue: it is not part of that figure, and it is not included in net patient income.
$867.7K
Payroll costs Info Staff salaries plus wage-related costs — benefits such as payroll taxes, health insurance and retirement — from the home's own accounting records (CMS cost report, Worksheet A). Contract or agency labor is counted separately, under other operating costs. Rank #54 / 143Payroll — State benchmarkedThis home is ranked 54th out of 143 homes in Michigan. Shows total annual staff payroll benchmarked to the Michigan average. Higher payroll investment relative to peers often signals better staffing and less reliance on cheaper contract labor.Rankings are based only on facilities in Michigan that report data for that category. Facilities without available data are excluded from the ranking.Click the rank badge to see the full State ranking.Click here to see the full State ranking.
$7.4M 55% of net patient revenue Info Payroll as a share of revenue: staff salaries and wage-related benefits divided by net patient revenue. A higher figure means more of each revenue dollar goes to staff pay. Rank #73 / 143Payroll % — State benchmarkedThis home is ranked 73rd out of 143 homes in Michigan. Shows payroll as a percentage of revenue versus the Michigan average. Well-run Michigan facilities typically land around 49–59% — the top third Statewide. Below 25% may signal understaffing or heavy agency use — read with Staffing ratings.Rankings are based only on facilities in Michigan that report data for that category. Facilities without available data are excluded from the ranking.Click the rank badge to see the full State ranking.Click here to see the full State ranking.
Other operating costs Info Everything it costs to run the home apart from payroll — food, utilities, supplies, maintenance, contract labor and administration. Calculated as total operating expense minus payroll (staff salaries and wage-related benefits).
$6.3M
Total costs Info The home's total operating expense for the year — all the costs of running it, salaries included (CMS cost report, Worksheet G-3).
$13.7M

What does this home offer?

Building type icon
Building type icon

Building Type: 2-story

On-site medical care and health services icon

On-site Medical Care and Health Services

Rehabilitative support icon

Rehabilitative Support

Beauty services icon

Beauty Services

Who this home usually serves

TYPE OF STAY

Mostly long-term care residents

Most residents stay for extended periods and receive ongoing daily care.

New residents most often arrive under Medicaid (38% of admissions), and a typical Medicaid stay runs around 9 - 10 months.

Admissions
341 total

Coverage residents most often arrive under.

Medicare 26%
Private pay 36%
Medicaid 38%
Discharges
342 total

Coverage residents most often leave under.

Medicare 13%
Private pay 32%
Medicaid 55%

Places of interest near LakePointe Senior Care & Rehab Center

Address 5.0 miles from city center Info Estimated distance in miles from Clinton Township's city center to LakePointe Senior Care & Rehab Center's address, calculated via Google Maps.

Calculate Travel Distance to LakePointe Senior Care & Rehab Center

Add your location

Address

Compare Nursing Homes around Clinton

The information below is reported by the Michigan Department of Licensing and Regulatory Affairs (LARA).

2 facilities compared · CMS & MI Dept. of Health data

LakePointe Senior Care & Rehab Center
NH
Clinton Township
134
Facility 134
MI AVG 75
Rank #51 / 435
89.8%
Facility 89.8%
MI AVG 75.8%
Rank #34 / 395
+18%
3.90
Facility 3.90
MI AVG 4.30
Rank #77 / 142
-38%-9%
$34.0k
Facility $34.0k
MI AVG $87.6k
Rank #104 / 145
26
Facility 26
MI AVG 33.5
Rank #63 / 144
5.2
Facility 5.2
MI AVG 5.2
Rank #78 / 144
2125-
61
Facility 61
MI AVG 39
Rank #125 / 703
Brian Laurain
$13.5M
Facility $13.5M
MI AVG $15.8M
Rank #58 / 143
$7.4M
Facility $7.4M
MI AVG $5.6M
Rank #54 / 143
55%
Facility 55%
MI AVG 39%
Rank #73 / 143
235547
Church of Christ Care Community
NH
AL
HC
IL
MC
NC
RC
Clinton Township
129
Facility 129
MI AVG 75
Rank #60 / 435
72.2%
Facility 72.2%
MI AVG 75.8%
Rank #112 / 395
-5%
3.93
Facility 3.93
MI AVG 4.30
Rank #77 / 142
-45%-9%
$50.3k
Facility $50.3k
MI AVG $87.6k
Rank #111 / 145
27
Facility 27
MI AVG 33.5
Rank #66 / 144
4.5
Facility 4.5
MI AVG 5.2
Rank #59 / 144
3109-
33
Facility 33
MI AVG 39
Rank #404 / 703
Debra Arnett
$10.8M
Facility $10.8M
MI AVG $15.8M
Rank #94 / 143
$6.9M
Facility $6.9M
MI AVG $5.6M
Rank #59 / 143
63.7%
Facility 63.7%
MI AVG 39%
Rank #21 / 143
235619

Financial Assistance for
Nursing Home in Michigan

LakePointe Senior Care & Rehab Center is located in Clinton Township, Michigan.
Here are the financial assistance programs available to residents in Michigan.

Get Financial aid guidance

MI Choice Waiver

Michigan Medicaid MI Choice Waiver

Age 65+ or disabled
General Michigan resident, Medicaid- eligible, nursing home-level care need.
Income Limits (2025) ~$2,829/month 300% FBR, individual
Asset Limits $2,000 (individual), $3,000 (couple).
MI

Delivered through regional waiver agents; waitlists possible.

Benefits
Personal care (5-7 hours/day) Respite care (240 hours/year) Home modifications ($1,500 avg.) Adult day care ($65/day)

Home Help Program

Michigan Home Help

Age 65+ or disabled
General Michigan resident, Medicaid- eligible or low-income.
Income Limits ~$1,732/month individual, Medicaid threshold
Asset Limits $2,000 individual
MI

Can hire family caregivers; less intensive than waiver.

Benefits
Personal care (up to 60 hours/month) Homemaker services Respite (varies)

Program of All-Inclusive Care for the Elderly (PACE)

Michigan PACE

Age 55+
General Michigan resident, nursing home-level care need, safe with PACE support.
Income Limits (2025) ~$2,829/month (Medicaid-eligible); private pay option available.
Asset Limits $2,000 (individual), $3,000 (couple).
MI

16 PACE centers (e.g., Ingham, Wayne counties); expanding slowly.

Benefits
Personal care (5-7 hours/day) Medical care Meals Transportation Therapy Respite

Medicare Savings Program (MSP)

Michigan Medicare Savings Program

Age 65+ or disabled
General Michigan resident, Medicare Part A/B.
Income Limits (2025) ~$2,510/month (QMB), ~$3,380/month (SLMB), ~$3,598/month (QI)—individual.
Asset Limits $9,430 (individual), $14,130 (couple).
MI

Three tiers; no waitlist; includes Extra Help for Part D.

Benefits
Covers Part B premiums ($174.70/month) Deductibles ($240/year) Copays (~20%)

National Family Caregiver Support Program (NFCSP) Respite

Michigan NFCSP Respite Care

Age
General Caregivers of 60+ needing care or 55+ caregivers of others; Michigan resident; functional needs (2+ ADLs).
Income Limits (2025) Prioritizes ~$24,980/year (individual); no strict cap.
Asset Limits Not assessed; need-based.
MI

16 AAAs; prioritizes low-income, rural caregivers.

Benefits
Respite (4-6 hours/week or 5 days/year) Adult day care ($60/day) Caregiver training

VA Aid and Attendance (A&A) and Housebound Benefits

Michigan VA Aid and Attendance/Housebound

Age 65+ or disabled veteran/spouse
General Michigan resident, wartime service, need for ADL help (A&A) or homebound.
Income Limits (2025) Net income < ~$1,984/month (veteran with dependent, A&A); pension offsets income.
Asset Limits ~$155,356 net worth limit
MI

High veteran demand in urban/rural areas.

Benefits
Cash (~$1,433-$2,642/month veteran, ~$951-$1,318 spouse) for care costs

Frequently Asked Questions about LakePointe Senior Care & Rehab Center

Is LakePointe Senior Care & Rehab Center in a walkable area?

LakePointe Senior Care & Rehab Center has a walk score of 61. Moderately walkable. Some errands can be accomplished on foot, with a mix of nearby amenities.

What is the occupancy rate at LakePointe Senior Care & Rehab Center?

LakePointe Senior Care & Rehab Center's occupancy is 89.8%.

Does LakePointe Senior Care & Rehab Center operate as a for-profit or non-profit?

LakePointe Senior Care & Rehab Center is registered as a for-profit.

Are there photos of LakePointe Senior Care & Rehab Center?

Yes — there are 5 photos of LakePointe Senior Care & Rehab Center in the photo gallery on this page.

What is the address of LakePointe Senior Care & Rehab Center?

LakePointe Senior Care & Rehab Center is located at 37700 Harper Ave, Clinton Township, MI 48036.

What is the phone number of LakePointe Senior Care & Rehab Center?

(586) 468-0827 will put you in contact with the team at LakePointe Senior Care & Rehab Center.

Is LakePointe Senior Care & Rehab Center Medicare or Medicaid certified?

Yes — LakePointe Senior Care & Rehab Center is a CMS-certified provider of Medicare and Medicaid.

Guides for Better Senior Living

Care Cost Calculator: See Prices in Your Area

Nursing Home Data Explorer

Don’t Wait Too Long: 7 Red Flag Signs Your Parent Needs Assisted Living Now

The True Cost of Assisted Living in 2025 – And How Families Are Paying For It

Understanding Senior Living Costs: Pricing Models, Discounts & Financial Assistance