


Total health inspections
19
Illinois average 10.4
Last Health inspection on Oct 2025
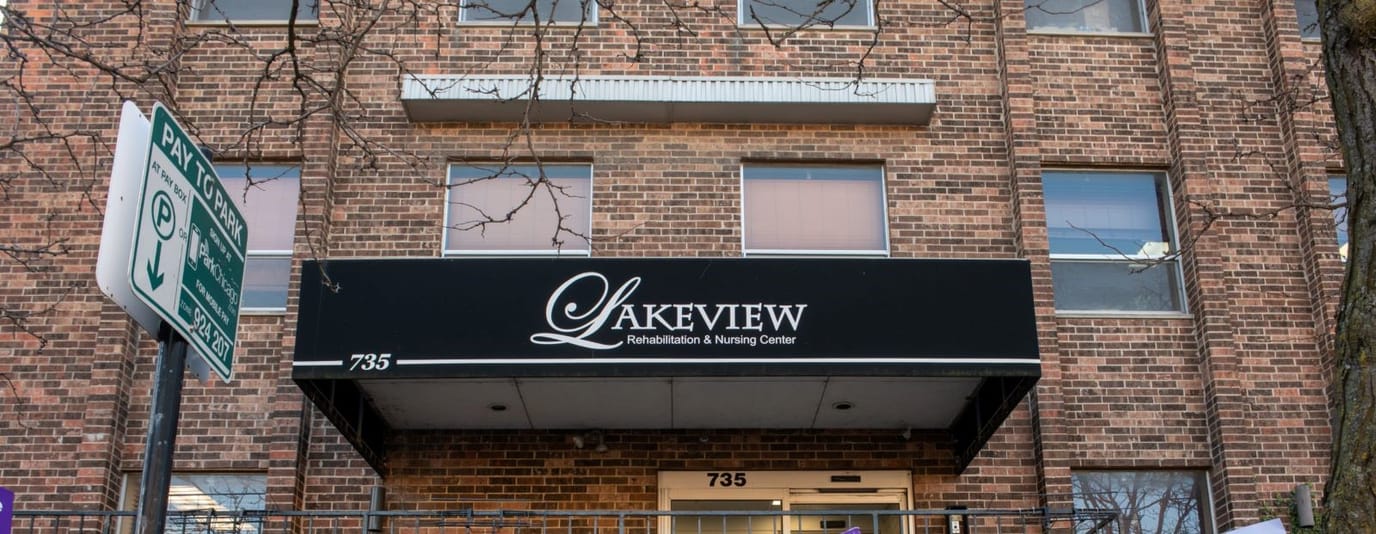
Lakeview Rehabilitation and Nursing Center has been a cherished member of Chicago’s northside community for more than 25 years. Their mission to prioritize emotional wellness is apparent in every aspect of their operations, creating an environment that promotes healing and relaxation for their residents. Loved ones can definitely have peace of mind knowing their family members are receiving compassionate and expert care. The team’s commitment to developing emotional health demonstrates the transformative power of this nursing home to individuals seeking for holistic recovery.
This home has a functional and peaceful atmosphere. The center’s skilled team of professionals offers a range of services, including specialized care for dementia and Alzheimer’s patients, personalized rehabilitation services, wound care, respiratory services, pain management, and in-house diagnostics. For those in search of a nurturing and supportive environment to heal and improve, Lakeview Rehabilitation and Nursing Center is the place to be.
Staffing hours
![]() Daily nursing hours per resident by staff type, reported to CMS. Higher is generally better — compare this facility to state and national averages to see where staffing stands.
Daily nursing hours per resident by staff type, reported to CMS. Higher is generally better — compare this facility to state and national averages to see where staffing stands.
Hours per resident per day vs Illinois averages
Total nursing care
![]() This home is ranked 97th out of 154 homes in Illinois for nurse hours. Total adjusted nursing hours per resident per day, combining RN, LPN, and aide time. CMS adjusts this for case-mix so facilities can be fairly compared.
This home is ranked 97th out of 154 homes in Illinois for nurse hours. Total adjusted nursing hours per resident per day, combining RN, LPN, and aide time. CMS adjusts this for case-mix so facilities can be fairly compared.
2h 40m
14% below state avg5 of 6 metrics below state avg
In Illinois, the Department of Public Health, Office of Health Care Regulation conducts annual unannounced surveys to assess compliance with state and federal healthcare facility standards.
Deficiencies
| This Facility | IL Average | vs. IL Avg |
|---|---|---|---|
|
Total deficiencies
| 75 | 7 | This facility has 971% more total deficiencies than a typical Illinois nursing home (75 vs. IL avg 7).↑ 971% worse |
|
Deficiencies per inspection
| 3.9 | 0.8 | This facility has 388% more deficiencies per inspection than a typical Illinois nursing home (3.9 vs. IL avg 0.8).↑ 388% worse |
Inspections
| This Facility | IL Average | vs. IL Avg |
|---|---|---|---|
|
Total inspections
| 19 | 9 | This facility has had 111% more total inspections than the Illinois average (19 vs. IL avg 9). More inspections can mean more regulatory scrutiny rather than worse care.↑ 111% more |
Illinois average 10.4
Last Health inspection on Oct 2025
Illinois average 36.8
Illinois average 3.68
Health citations are formal notices following inspections when they fail to comply with safety and care standards.
46 of 77 citations resulted from standard inspections; and 31 of 77 resulted from complaint investigations.
Illinois average: 0.7
Illinois average: 3.6
Reporting period: October 1 – December 31, 2025 (Q4 2025). Source: CMS Payroll-Based Journal report.
Manages medical care and health needs.
Assists with medical care and medications.
Helps with daily care and mobility.
Total hours from contractors
2,473 contractor hours this quarter
| Certified Nursing Assistant | 71 | 1 | 72 | 24,477 | 92 | 100% | 8.1 |
| Licensed Practical Nurse | 18 | 0 | 18 | 7,941 | 92 | 100% | 9.5 |
| Registered Nurse | 16 | 4 | 20 | 5,641 | 92 | 100% | 9.5 |
| Other Dietary Services Staff | 5 | 0 | 5 | 1,429 | 90 | 98% | 7.4 |
| Mental Health Service Worker | 2 | 0 | 2 | 934 | 68 | 74% | 7.8 |
| Qualified Social Worker | 0 | 3 | 3 | 585 | 65 | 71% | 6.9 |
| RN Director of Nursing | 2 | 0 | 2 | 516 | 62 | 67% | 8.1 |
| Nurse Practitioner | 1 | 0 | 1 | 512 | 64 | 70% | 8 |
| Dietitian | 1 | 0 | 1 | 475 | 64 | 70% | 7.4 |
| Physical Therapy Assistant | 0 | 3 | 3 | 469 | 63 | 68% | 7.4 |
| Respiratory Therapy Technician | 0 | 1 | 1 | 464 | 60 | 65% | 7.7 |
| Speech Language Pathologist | 0 | 3 | 3 | 462 | 65 | 71% | 6.6 |
| Physical Therapy Aide | 0 | 1 | 1 | 415 | 57 | 62% | 7.3 |
| Other Social Services Staff | 1 | 0 | 1 | 367 | 55 | 60% | 6.7 |
| Clinical Nurse Specialist | 2 | 0 | 2 | 304 | 80 | 87% | 3.7 |
| Administrator | 1 | 0 | 1 | 80 | 10 | 11% | 8 |
| Therapeutic Recreation Specialist | 0 | 1 | 1 | 37 | 10 | 11% | 3.7 |
Includes penalties issued in 2023
Federal penalties imposed by CMS for regulatory violations, including civil money penalties (fines) and denials of payment for new Medicare/Medicaid admissions.
Source: CMS Penalties Database (Data as of Jan 2026)
Illinois average: $143K
Illinois average: 3.0
Illinois average: 1.1
Penalties are imposed by CMS for violations of federal nursing home regulations.
1 penalty in the past 3 years
Nov 17, 2023 · $43K
Last updated: Jan 2026
These measures show how residents usually do over time at this home, based on health outcomes and preventive care.
Illinois average: 9.7
Illinois average: 18.6
Illinois average: 15.5%
Illinois average: 18.4%
Illinois average: 21.6%
Illinois average: 3.4%
Illinois average: 5.3%
Illinois average: 1.8%
Illinois average: 6.5%
Illinois average: 48.1%
Illinois average: 20.2%
Illinois average: 89.2%
Illinois average: 91.6%
Illinois average: 2.05
Illinois average: 2.25
Illinois average: 68.3%
Illinois average: 2.3%
Illinois average: 63.0%
Illinois average: 26.2%
Illinois average: 14.0%
Illinois average: 0.8%
Illinois average: 53.7%
Illinois average: 50.6%
Quality measures are calculated from Minimum Data Set (MDS) assessments. For most measures, lower percentages indicate better care quality.
21% of new residents, usually for short-term rehab.
8% of new residents, often for short stays.
71% of new residents, often for long-term daily care.
Source: CMS Long-Term Care Facility Characteristics (Data as of Jan 2026)
Residents meet regularly to discuss policies, care quality, and activities
Organized group of residents that meets regularly to discuss facility policies, quality of life, and activities.
Data sourced from CMS Long-Term Care Facility Characteristics quarterly report. Payer mix reflects the current resident census by primary payment source.
Historical financial and operational data for Lakeview Nursing and Rehabilitation Center from 2012–2023, based on CMS SNF Cost Reports.
Key figures below are for fiscal year ending in 12/2023.
Based on CMS SNF Cost Report for fiscal year ending in 12/2023.
Most residents stay for extended periods and receive ongoing daily care.
Most new residents arrive under Medicaid (71% of admissions), and a typical Medicaid stay runs around 8 - 9 months.
Coverage residents most often arrive under.
Coverage residents most often leave under.
![]() 3.5 miles from city center
3.5 miles from city center
![]() Estimated distance in miles from Chicago's city center to Lakeview Nursing and Rehabilitation Center's address, calculated via Google Maps.
— 0.55 miles to nearest hospital (Ascension Saint Joseph - Chicago)
Estimated distance in miles from Chicago's city center to Lakeview Nursing and Rehabilitation Center's address, calculated via Google Maps.
— 0.55 miles to nearest hospital (Ascension Saint Joseph - Chicago)
Add your location
Info below is compiled from CMS reports & the IL Dept. of Public Health (IDPH), senior community websites & trusted data sources such as Walk Score & BBB.
Communities are listed from highest to lowest based on our ranking methodology.
| Mercy Circle Senior Living | NH AL IL MC SNF | Chicago (Mount Greenwood) | 43
Facility
43
IL AVG
85
Rank
#329 / 418 | - | - | 4.57
Facility
4.57
IL AVG
3.10
Rank
#24 / 154 | -8% | +47% | $0
Facility
$0
IL AVG
$151.3k
Rank
#1 / 154 | 16
Facility
16
IL AVG
36.8
Rank
#23 / 154 | 4.0
Facility
4.0
IL AVG
3.7
Rank
#104 / 154 | - | 22 | - |
44
Facility
44
IL AVG
52
Rank
#392 / 634 | Sisters Of Mercy Of The Americas West Midwest Community Inc | $10.3MFiscal year ending 06/2024
Facility
$10.3MFiscal year ending 06/2024
IL AVG
$13.2M
Rank
#84 / 135 | $5.1MFiscal year ending 06/2024
Facility
$5.1MFiscal year ending 06/2024
IL AVG
$7.4M
Rank
#99 / 135 | 49.8%Fiscal year ending 06/2024
Facility
49.8%Fiscal year ending 06/2024
IL AVG
60.5%
Rank
#76 / 135 | 146174 | ||||
| The Selfhelp Home Senior Living Community | NH AL IL RC SNF | Chicago (Uptown) | 72
Facility
72
IL AVG
85
Rank
#204 / 418 |
81.9%
Facility
81.9%
IL AVG
73
Rank
#63 / 156 | +12% | 5.56
Facility
5.56
IL AVG
3.10
Rank
#8 / 154 | +44% | +79% | $0
Facility
$0
IL AVG
$151.3k
Rank
#1 / 154 | 21
Facility
21
IL AVG
36.8
Rank
#40 / 154 | 5.3
Facility
5.3
IL AVG
3.7
Rank
#137 / 154 | 1 | 59 | A+ |
92
Facility
92
IL AVG
52
Rank
#28 / 634 | Marvin Rubin | $9.3MFiscal year ending 09/2023
Facility
$9.3MFiscal year ending 09/2023
IL AVG
$13.2M
Rank
#96 / 135 | $7.0MFiscal year ending 09/2023
Facility
$7.0MFiscal year ending 09/2023
IL AVG
$7.4M
Rank
#64 / 135 | 75.3%Fiscal year ending 09/2023
Facility
75.3%Fiscal year ending 09/2023
IL AVG
60.5%
Rank
#16 / 135 | 146009 | ||||
| The Clare | NH AL IL MC SNF | Chicago (Rush & Division) | 49
Facility
49
IL AVG
85
Rank
#293 / 418 |
92.2%
Facility
92.2%
IL AVG
73
Rank
#23 / 156 | +26% | 3.69
Facility
3.69
IL AVG
3.10
Rank
#48 / 154 | +61% | +19% | $0
Facility
$0
IL AVG
$151.3k
Rank
#1 / 154 | 13
Facility
13
IL AVG
36.8
Rank
#18 / 154 | 2.6
Facility
2.6
IL AVG
3.7
Rank
#24 / 154 | 1 | 45 | A+ |
100
Facility
100
IL AVG
52
Rank
#1 / 634 | County Of Fulton | $4.4MFiscal year ending 11/2023
Facility
$4.4MFiscal year ending 11/2023
IL AVG
$13.2M
Rank
#131 / 135 | $3.6MFiscal year ending 11/2023
Facility
$3.6MFiscal year ending 11/2023
IL AVG
$7.4M
Rank
#124 / 135 | 81.8%Fiscal year ending 11/2023
Facility
81.8%Fiscal year ending 11/2023
IL AVG
60.5%
Rank
#13 / 135 | 146151 | ||||
| Asbury Gardens | NH HOS MC PC SNF | North Aurora (Airport Road) | 75
Facility
75
IL AVG
85
Rank
#193 / 418 |
76.5%
Facility
76.5%
IL AVG
73
Rank
#77 / 156 | +5% | 4.00
Facility
4.00
IL AVG
3.10
Rank
#41 / 154 | +6% | +29% | $6.4k
Facility
$6.4k
IL AVG
$151.3k
Rank
#65 / 154 | 21
Facility
21
IL AVG
36.8
Rank
#40 / 154 | 3.5
Facility
3.5
IL AVG
3.7
Rank
#71 / 154 | - | 57 | A+ |
38
Facility
38
IL AVG
52
Rank
#434 / 634 | Abraham Diamond | $6.7MFiscal year ending 12/2023
Facility
$6.7MFiscal year ending 12/2023
IL AVG
$13.2M
Rank
#120 / 135 | $3.8MFiscal year ending 12/2023
Facility
$3.8MFiscal year ending 12/2023
IL AVG
$7.4M
Rank
#121 / 135 | 56.5%Fiscal year ending 12/2023
Facility
56.5%Fiscal year ending 12/2023
IL AVG
60.5%
Rank
#51 / 135 | 146170 | ||||
| Lakeview Nursing and Rehabilitation Center | NH MC | Chicago (Lincoln Park) | 178
Facility
178
IL AVG
85
Rank
#37 / 418 |
84.3%
Facility
84.3%
IL AVG
73
Rank
#56 / 156 | +16% | 2.67
Facility
2.67
IL AVG
3.10
Rank
#97 / 154 | +3% | -14% | $63.8k
Facility
$63.8k
IL AVG
$151.3k
Rank
#104 / 154 | 77
Facility
77
IL AVG
36.8
Rank
#143 / 154 | 4.1
Facility
4.1
IL AVG
3.7
Rank
#107 / 154 | 7 | 150 | A- |
98
Facility
98
IL AVG
52
Rank
#6 / 634 | Daniel Borek | $13.8MFiscal year ending 12/2023
Facility
$13.8MFiscal year ending 12/2023
IL AVG
$13.2M
Rank
#51 / 135 | $8.1MFiscal year ending 12/2023
Facility
$8.1MFiscal year ending 12/2023
IL AVG
$7.4M
Rank
#45 / 135 | 59.1%Fiscal year ending 12/2023
Facility
59.1%Fiscal year ending 12/2023
IL AVG
60.5%
Rank
#44 / 135 | 145654 |
Lakeview Nursing and Rehabilitation Center is located in Chicago, Illinois.
Here are the financial assistance programs available to residents in Illinois.
Lakeview Nursing and Rehabilitation Center is in the Lincoln Park neighborhood of Chicago.
Lakeview Nursing and Rehabilitation Center has a walk score of 98. Walker's paradise. Daily errands do not require a car, with many shops and services nearby.
Lakeview Nursing and Rehabilitation Center's occupancy is 76.7%.
Lakeview Nursing and Rehabilitation Center has been operating for approximately 42 years, based on available licensing and registration records.
No, Lakeview Nursing and Rehabilitation Center has a no-pet policy.
Lakeview Nursing and Rehabilitation Center is registered as a for-profit in IL.
Lakeview Nursing and Rehabilitation Center has had 75 reported deficiencies since 2023 according to records from Illinois Department of Public Health (IDPH).
Care Cost Calculator: See Prices in Your Area
Nursing Home Data Explorer
Don’t Wait Too Long: 7 Red Flag Signs Your Parent Needs Assisted Living Now
The True Cost of Assisted Living in 2025 – And How Families Are Paying For It
Understanding Senior Living Costs: Pricing Models, Discounts & Financial Assistance


