Laurels of Massillon
Nursing Home, Assisted Living, Independent Living & Memory Care · Massillon, OH
CMS overall rating Info CMS (the Centers for Medicare & Medicaid Services) is the federal agency that rates nursing home quality. Its Overall Rating runs from 1 to 5 stars, combining health inspections, staffing, and quality measures, with inspections weighted most heavily.

Laurels of Massillon

Nursing Home, Assisted Living, Independent Living & Memory Care · Massillon, OH
CMS overall rating Info CMS (the Centers for Medicare & Medicaid Services) is the federal agency that rates nursing home quality. Its Overall Rating runs from 1 to 5 stars, combining health inspections, staffing, and quality measures, with inspections weighted most heavily.
Calculator: See prices in your area
Laurels of Massillon accepts Medicare, Medicaid, and private pay.

Overview of Laurels of Massillon

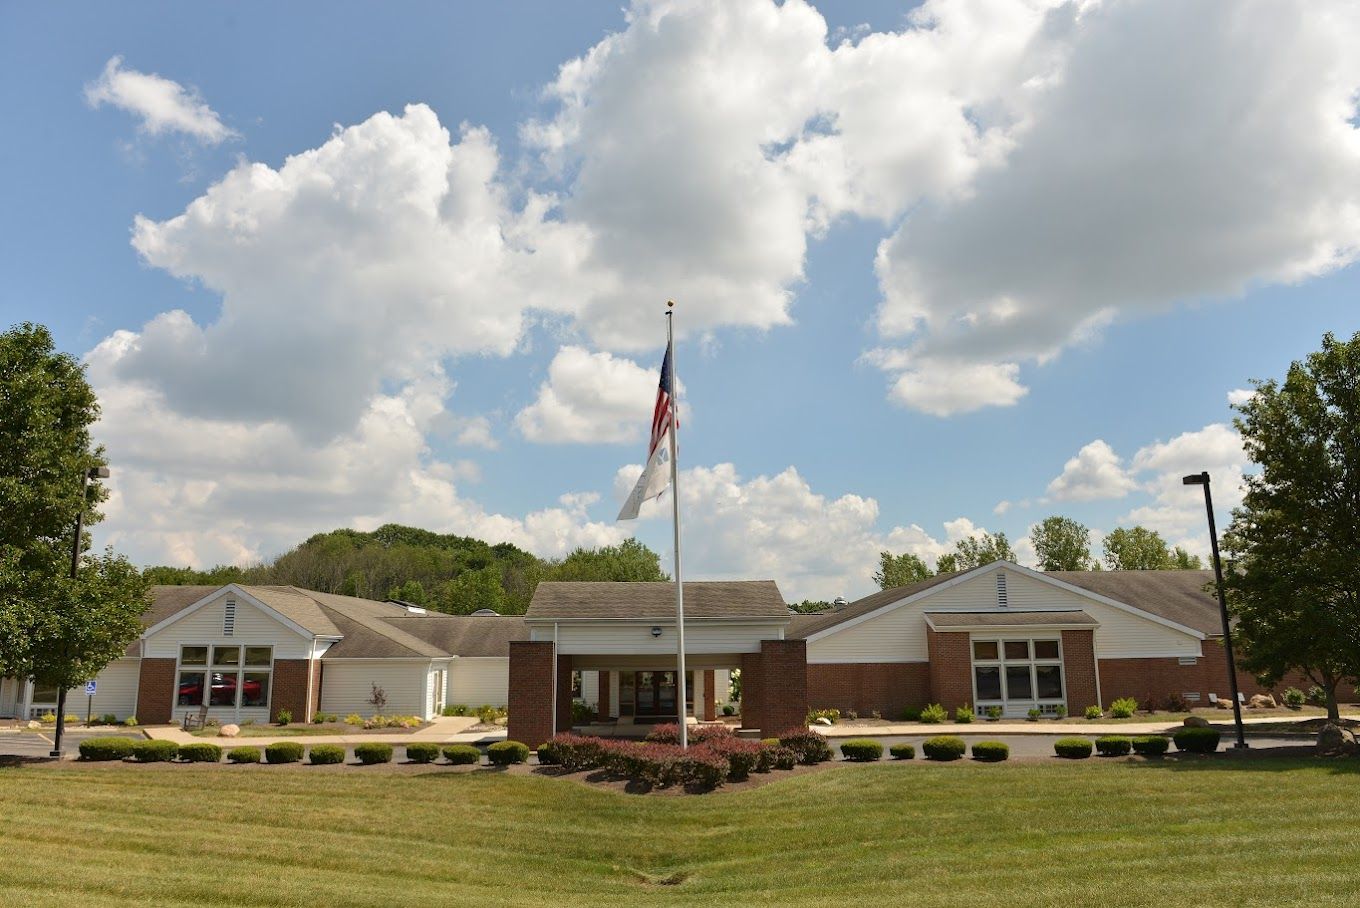
Receive unrivaled care and comfort with the outstanding senior living community of Laurels of Massillon in Sherman Circle Northeast, Massillon, OH, providing an array of care services ranging from short-term rehabilitation to long-term care. These include palliative care, wound management, dementia management, and therapy services. With a team of reliable and well-trained professionals delivering top-notch care and assistance, seniors can rest assured of living their lives to the fullest.

The community works hard to ease seniors’ financial constraints by ensuring their insurance can be used properly. State-of-the-art amenities are also available to keep residents active and moving. Laurels of Massillon strives to provide a haven for seniors to spend their golden years without worries with comprehensive care.

(330) 830-9988

Quality ratings

Measured by Centers for Medicare & Medicaid Services (CMS)

Overall rating Info The Overall CMS Rating combines results from health inspections, staffing levels and quality measures. Health inspections carry the most weight. Staffing and quality scores can increase or decrease the final rating based on performance compared to state and national standards.
▲ 25.7% Above OH avg. ▲ 25.7% Above OH avg.OH average: 3.2Click the badge to see the full State ranking.Click here to see the full State ranking.
Health Inspection Info Based on the results of the facility's three most recent standard inspections and any complaint investigations. CMS reviews the number, scope, and severity of deficiencies, with more recent findings weighted more heavily.
▲ 7.1% Above OH avg. ▲ 7.1% Above OH avg.OH average: 2.8Click the badge to see the full State ranking.Click here to see the full State ranking.
Staffing Info Measures average nursing staff hours per resident per day, including Registered Nurses (RNs) and total nursing staff. Ratings are adjusted based on the level of care residents require and are compared to state and national benchmarks.
▲ 63.8% Above OH avg. ▲ 63.8% Above OH avg.OH average: 2.4Click the badge to see the full State ranking.Click here to see the full State ranking.
Quality Measures Info Based on clinical and physical health indicators reported to CMS, such as hospital readmissions, falls, pressure ulcers, and improvements in mobility. These measures reflect how well residents' health needs are being managed.
▲ 14.7% Above OH avg. ▲ 14.7% Above OH avg.OH average: 4.4Click the badge to see the full State ranking.Click here to see the full State ranking.

Staffing hours breakdown

Info Daily nursing hours per resident by staff type, reported to CMS. Higher is generally better — compare this facility to state and national averages to see where staffing stands.

Hours per resident per day — compared to Ohio state averages

Total nursing care / resident Info This home is ranked 60th out of 210 homes in Ohio for nurse hours. Total adjusted nursing hours per resident per day, combining RN, LPN, and aide time. CMS adjusts this for case-mix so facilities can be fairly compared.
3h 49m per day
Rank #60 / 210Nurse hours — State benchmarkedThis home is ranked 60th out of 210 homes in Ohio. Shows adjusted nurse hours per resident per day benchmarked to the Ohio average, with a ranking across 210 Ohio facilities. More hours mean more direct care. The national average is about 3.5 hrs; below 3.0 is a red flag.Ranking totals vary by category as each rank only includes facilities that report data for that metric. Homes missing that data point aren't included in the ranking.Click the rank badge to see the full State ranking.Click here to see the full State ranking.
This facility Ohio avg (3h 32m per day)
vs Ohio avg
+8%

2 of 6 metrics below state avg

Standout metric Physical Therapist is +96% above state avg
Staff type Hours / Day / Resident vs state avg
Registered Nurse (RN) Info RNs hold the highest nursing license and can assess residents, interpret test results, and direct care plans. More RN hours per day often signals stronger clinical oversight and faster response to health changes. 37m per day ■ Avg State avg: 38m per day · National avg: 41m per day
LPN / LVN Info Licensed Practical Nurses (LPNs) or Licensed Vocational Nurses (LVNs) deliver routine hands-on care — medication administration, wound dressing, and monitoring vital signs. They work under RN supervision and make up a large share of daily bedside care. 52m per day ▼ 11% State avg: 58m per day · National avg: 52m per day
Nurse Aide Info Certified Nurse Aides (CNAs) provide the most direct day-to-day assistance: bathing, dressing, feeding, and mobility. Nurse aide hours are typically the largest staffing category and directly affect residents' quality of life. 2h 27m per day ▲ 15% State avg: 2h 8m per day · National avg: 2h 21m per day
Weekend Total Nursing Info Combined nursing hours (RN + LPN + Nurse Aide) per resident per day on weekends. Staffing often drops on weekends — this figure reveals whether the facility maintains adequate coverage outside of weekday hours. 3h 34m per day ▲ 9% State avg: 3h 17m per day · National avg: 3h 26m per day
Physical Therapist Info Hours per resident per day provided by licensed Physical Therapists (PTs) or PT Assistants. PT services help residents recover mobility after injury or illness and are especially important for post-acute (short-stay) rehabilitation. 6m per day ▲ 96% State avg: 3m per day · National avg: 4m per day
Weekend RN Info Registered nurse hours specifically on weekends. Facilities sometimes reduce RN presence on Saturdays and Sundays — a low weekend RN figure compared to weekday hours can indicate reduced clinical oversight when most administrative staff are absent. 22m per day ▼ 13% State avg: 25m per day · National avg: 29m per day

Capacity and availability

This home usually has limited availability

Higher occupancy than the Ohio average: 78.7%
Occupancy rate
92.9% Rank #48 / 211Occupancy rate — State benchmarkedThis home is ranked 48th out of 211 homes in Ohio. Shows this facility's occupancy rate versus the Ohio average, with its Statewide rank out of 211. Higher occupancy signals strong local demand and financial stability.Ranking totals vary by category as each rank only includes facilities that report data for that metric. Homes missing that data point aren't included in the ranking.Click the rank badge to see the full State ranking.Click here to see the full State ranking.
Avg. Length of Stay
122 days
Bed community size
140-bed community Rank #29 / 323Bed count — State benchmarkedThis home is ranked 29th out of 323 homes in Ohio. Shows this facility's certified or reported bed count compared to other Ohio facilities. Larger communities may offer more amenities, programs, and on-site services for residents and families.Ranking totals vary by category as each rank only includes facilities that report data for that metric. Homes missing that data point aren't included in the ranking.Click the rank badge to see the full State ranking.Click here to see the full State ranking.
A larger shared setting that may offer more common spaces and organized community services.
Walk Score
Walk Score: 29 / 100 Rank #456 / 705Walk Score — State benchmarkedThis home is ranked 456th out of 705 homes in Ohio. Shows how walkable this facility's neighborhood is compared to the average Walk Score across Ohio facilities. Higher scores benefit residents, families, and staff.Ranking totals vary by category as each rank only includes facilities that report data for that metric. Homes missing that data point aren't included in the ranking.Click the rank badge to see the full State ranking.Click here to see the full State ranking.
Somewhat walkable. A few nearby services may be reachable on foot, but most trips require transportation.

About this community

License Details

CMS Certification Number366078

Staffing

Key information about the people who lead and staff this community.

Leadership

ContactMs. Sarah Sonego, Administrator

Contact Laurels of Massillon

Inspection History

In Ohio, the Department of Health, Bureau of Survey and Certification conducts unannounced onsite inspections to evaluate the quality of care and environment in all licensed facilities.

Since 2019 · 7 years of data 34 citations

Inspection Scorecard Info This scorecard compares key inspection, citation, and complaint metrics at this facility against the Ohio state average. Metrics rated ≥15% worse than average are highlighted in red; those ≥15% better are highlighted in green.

Since 2019 vs. Ohio state average
Overall vs. OH average 2 Worse Metrics worse than Ohio average:
• Total citations (1600% above)
• Citations per year (1533% above)
0 Better No metrics in this bucket.
Latest Inspection June 12, 2025 Complaint Investigation

Citations Info Citations are formal regulatory issues recorded during state inspections.

This Facility OH Average vs. OH Avg
Total citations Info Formal regulatory issues recorded by inspectors across all inspection types. 34 2 This facility has 1600% more total citations than a typical Ohio nursing home (34 vs. OH avg 2).↑ 1600% worse
Citations per year Info Average citations per year since 2019. 4.9 0.3 This facility has 1533% more citations per year than a typical Ohio nursing home (4.9 vs. OH avg 0.3).↑ 1533% worse

Inspection Reports Summary Info An editor-reviewed summary of the themes and findings across this facility's recent inspection reports.

  • June 12, 2025 complaint investigation found six deficiencies including failure to provide resident-centered care plans, inadequate privacy during wound care, and inappropriate antibiotic use.
  • December 9, 2024 complaint investigation identified failures to prevent a resident elopement and to complete tuberculosis screening on admission, with corrective actions implemented.
  • December 6, 2023 annual inspection found no health deficiencies during the facility's comprehensive survey.

Health Inspection History

Inspections since 2019
Total health inspections 7

Ohio average 6.7


Last Health inspection on Jun 2025

Total health citations
34 Rank #129 / 210Health citations — State benchmarkedThis home is ranked 129th out of 210 homes in Ohio. Shows this facility's total health deficiency citations benchmarked to the Ohio State average, with a ranking across all 210 OH facilities. Lower citation counts earn a better rank.Ranking totals vary by category as each rank only includes facilities that report data for that metric. Homes missing that data point aren't included in the ranking.Click the rank badge to see the full State ranking.Click here to see the full State ranking.

Ohio average 30.9

Citations per inspection
4.86 Rank #147 / 210Citations per inspection — State benchmarkedThis home is ranked 147th out of 210 homes in Ohio. Shows average deficiency citations per CMS inspection for this facility versus the Ohio mean across 210 facilities with citation data. Lower is better.Ranking totals vary by category as each rank only includes facilities that report data for that metric. Homes missing that data point aren't included in the ranking.Click the rank badge to see the full State ranking.Click here to see the full State ranking.

Ohio average 4.59


Health citations are formal notices following inspections when they fail to comply with safety and care standards.

24 of 34 citations resulted from standard inspections; and 10 of 34 resulted from complaint investigations.

Breakdown of citation severity (last 7 years)
Critical health citations
0
100% better than Ohio average

Ohio average: 0.3


Serious health citations
0
100% better than Ohio average

Ohio average: 0.9

0 critical citations Ohio average: 0.3

0 serious citations Ohio average: 0.9

34 moderate citations Ohio average: 29

0 minor citations Ohio average: 0.7
Citations history (last 7 years)
Infection Control moderate citation Jun 12, 2025
Corrected

Quality of Care moderate citation Jun 12, 2025
Corrected

Quality of Care moderate citation Jun 12, 2025
Corrected

Care Planning moderate citation Jun 12, 2025
Corrected

Staffing Data

Reporting period: October 1 – December 31, 2025 (Q4 2025). Source: CMS Payroll-Based Journal report.

Total staff 179
Employees 149
Contractors 30
Staff to resident ratio 1.50 : 1
26% fewer staff per resident than Ohio average
Ohio average ratio: 2.04 : 1 Ohio average ratio: 2.04 : 1See full Ohio ranking
Avg staff/day 81
Average shift 7.6 hours
6% worse than Ohio average
Ohio average: 8.1 hours Ohio average shift: 8.1 hoursSee full Ohio ranking
Total staff hours (quarter) 56,982

Nursing staff breakdown

Q4 2025 · Oct 1 – Dec 31 More info This data comes from the CMS Payroll-Based Journal report covering October 1 – December 31, 2025.
Registered Nurse

Manages medical care and health needs.

RN Staff Info All 16 RN Staff are full-time employees. No contractors work on this role. 16
Average shift length Info Average shift length. Calculated as total hours divided by days worked and average staff per day. 8.8 hours
Licensed Practical Nurse

Assists with medical care and medications.

LPN Staff Info All 39 LPN Staff are full-time employees. No contractors work on this role. 39
Average shift length Info Average shift length. Calculated as total hours divided by days worked and average staff per day. 8.9 hours
Certified Nursing Assistant

Helps with daily care and mobility.

CNA Staff Info All 76 CNA Staff are full-time employees. No contractors work on this role. 76
Average shift length Info Average shift length. Calculated as total hours divided by days worked and average staff per day. 7.4 hours

Contractor staffing

Q4 2025 · Oct 1 – Dec 31 More info This data comes from the CMS Payroll-Based Journal report covering October 1 – December 31, 2025.

Total hours from contractors

11.4%

6,515 contractor hours this quarter

Speech Language Pathologist: 9 Physical Therapy Aide: 8 Respiratory Therapy Technician: 4 Qualified Social Worker: 3 Clinical Nurse Specialist: 2 Physical Therapy Assistant: 2 Occupational Therapy Assistant: 1 Occupational Therapy Aide: 1

Staff by category

Q4 2025 · Oct 1 – Dec 31 More info This data comes from the CMS Payroll-Based Journal report covering October 1 – December 31, 2025.
Certified Nursing Assistant 76 0 76 28,296 92 100% 7.4
Licensed Practical Nurse 39 0 39 9,735 92 100% 8.9
Registered Nurse 16 0 16 5,040 92 100% 8.8
Physical Therapy Aide 0 8 8 2,382 89 97% 7
Speech Language Pathologist 0 9 9 1,939 89 97% 6.3
Clinical Nurse Specialist 4 2 6 1,851 71 77% 8.5
Respiratory Therapy Technician 0 4 4 1,175 84 91% 6.2
Medication Aide/Technician 3 0 3 1,106 82 89% 9.2
Other Dietary Services Staff 3 0 3 877 90 98% 6.2
RN Director of Nursing 2 0 2 564 66 72% 7.4
Dietitian 1 0 1 555 66 72% 8.4
Administrator 1 0 1 512 64 70% 8
Nurse Practitioner 1 0 1 512 64 70% 8
Dental Services Staff 1 0 1 504 64 70% 7.9
Mental Health Service Worker 1 0 1 488 61 66% 8
Physical Therapy Assistant 0 2 2 478 61 66% 7.8
Occupational Therapy Aide 1 1 2 463 53 58% 8.4
Qualified Social Worker 0 3 3 447 63 68% 6.9
Occupational Therapy Assistant 0 1 1 61 47 51% 1.3
76 Certified Nursing Assistant
% of Days 100%
39 Licensed Practical Nurse
% of Days 100%
16 Registered Nurse
% of Days 100%
8 Physical Therapy Aide
% of Days 97%
9 Speech Language Pathologist
% of Days 97%
6 Clinical Nurse Specialist
% of Days 77%
4 Respiratory Therapy Technician
% of Days 91%
3 Medication Aide/Technician
% of Days 89%
3 Other Dietary Services Staff
% of Days 98%
2 RN Director of Nursing
% of Days 72%
1 Dietitian
% of Days 72%
1 Administrator
% of Days 70%
1 Nurse Practitioner
% of Days 70%
1 Dental Services Staff
% of Days 70%
1 Mental Health Service Worker
% of Days 66%
2 Physical Therapy Assistant
% of Days 66%
2 Occupational Therapy Aide
% of Days 58%
3 Qualified Social Worker
% of Days 68%
1 Occupational Therapy Assistant
% of Days 51%

Penalties and fines

Federal penalties imposed by CMS for regulatory violations, including civil money penalties (fines) and denials of payment for new Medicare/Medicaid admissions.

Source: CMS Penalties Database

No penalties in the past 3 years

No civil money penalties or payment denials were reported in the last 3 years.

Quality of care over time

These measures show how residents usually do over time at this home, based on health outcomes and preventive care.

High-risk clinical events score Info A composite score based on pressure ulcers, falls with injury, weight loss, walking ability decline, and activities of daily living decline. 5.2
11% better than Ohio average

Ohio average: 5.8

Functional decline score Info A composite score based on activities of daily living decline, walking ability decline, and incontinence. 11.7
8% better than Ohio average

Ohio average: 12.7

Long-stay resident measures
Significantly above average Ohio avg: 4.7 Info CMS star rating based on long-stay quality measure performance. 5 stars = significantly above average, 1 star = significantly below average.
Need for Help with Daily Activities Increased Info Percent of long-stay residents whose need for help with daily activities has increased 5.4%
21% better than Ohio average

Ohio average: 6.8%

Walking Ability Worsened Info Percent of long-stay residents whose ability to move independently worsened 6.1%
31% better than Ohio average

Ohio average: 8.9%

Low Risk Residents with Bowel/Bladder Incontinence Info Percent of low risk long-stay residents who lose control of their bowels or bladder 23.6%
7% worse than Ohio average

Ohio average: 22.0%

Falls with Major Injury Info Percent of long-stay residents experiencing one or more falls with major injury 5.5%
61% worse than Ohio average

Ohio average: 3.4%

High Risk Residents with Pressure Ulcers Info Percent of long-stay high risk residents with pressure ulcers 5.9%
52% worse than Ohio average

Ohio average: 3.9%

Urinary Tract Infection Info Percent of long-stay residents with a urinary tract infection 0.3%
54% better than Ohio average

Ohio average: 0.5%

Lost Too Much Weight Info Percent of long-stay residents who lose too much weight 3.1%
50% better than Ohio average

Ohio average: 6.2%

Depressive Symptoms Info Percent of long-stay residents who have depressive symptoms 0.5%
98% better than Ohio average

Ohio average: 24.0%

Antipsychotic Use Info Percent of long-stay residents who received an antipsychotic medication 3.1%
64% better than Ohio average

Ohio average: 8.4%

Pneumococcal Vaccine Info Percent of long-stay residents assessed and appropriately given the pneumococcal vaccine 91.2%
In line with Ohio average

Ohio average: 92.4%

Influenza Vaccine Info Percent of long-stay residents assessed and appropriately given the seasonal influenza vaccine 100.0%
6% better than Ohio average

Ohio average: 94.5%

Hospitalizations per 1,000 days Info Number of hospitalizations per 1,000 long-stay resident days. 2.97
68% worse than Ohio average

Ohio average: 1.77

ED visits per 1,000 days Info Number of outpatient emergency department visits per 1,000 long-stay resident days. 0.00
100% better than Ohio average

Ohio average: 1.83

Short-stay resident measures
Above average Ohio avg: 2.4 Info CMS star rating based on short-stay quality measure performance. 5 stars = much above average, 1 star = much below average.
Pneumococcal Vaccine Info Percent of short-stay residents assessed and appropriately given the pneumococcal vaccine 92.7%
19% better than Ohio average

Ohio average: 78.0%

Antipsychotic medication increase Info Percent of short-stay residents who newly received an antipsychotic medication 0.4%
68% better than Ohio average

Ohio average: 1.3%

Influenza Vaccine Info Percent of short-stay residents assessed and appropriately given the seasonal influenza vaccine 92.7%
23% better than Ohio average

Ohio average: 75.6%

Re-hospitalized after SNF stay Info Percentage of short-stay residents who were re-hospitalized after their nursing home admission. 22.8%
9% better than Ohio average

Ohio average: 25.1%

Emergency department visits Info Percentage of short-stay residents who had an outpatient emergency department visit. 1.9%
85% better than Ohio average

Ohio average: 12.5%

Falls with major injury Info Percentage of SNF residents who experience falls with major injury during their stay. 0.0%
100% better than Ohio average

Ohio average: 0.8%

Ability to care for self at discharge Info Percentage of residents at or above expected ability to care for themselves at discharge. 56.1%
5% better than Ohio average

Ohio average: 53.7%

Successful return to home or community Info Rate of successful return to home or community from a skilled nursing facility. 45.8%
9% worse than Ohio average

Ohio average: 50.6%

Breakdown by payment type

Medicare

32% of new residents, usually for short-term rehab.

Typical stay 1 - 2 months

Private pay

60% of new residents, often for short stays.

Typical stay 11 - 12 months

Medicaid

9% of new residents, often for long-term daily care.

Typical stay 10 - 11 months

Facility Characteristics

Source: CMS Long-Term Care Facility Characteristics (Data as of Jan 2026)

Total residents 119
Medicare
9
7.6% of residents
Medicaid
55
46.2% of residents
Private pay or other
55
46.2% of residents
Programs & Services
Residents Group

Residents meet regularly to discuss policies, care quality, and activities

Active Resident Council

Organized group of residents that meets regularly to discuss facility policies, quality of life, and activities.

Finances and operations

Based on CMS SNF Cost Report for fiscal year ending in 12/2023.

Voluntary non-profit community
Operated by a church.
Net patient revenue Info Net patient revenue — what the home actually collects for resident care, after contractual allowances, bad debt and discounts are subtracted from its gross charges (CMS cost report, Worksheet G-3). It covers resident care only; money the home earns from other sources is shown separately as "Other income."
$13.3M
Net patient income Info Net patient income: net patient revenue minus the home's total operating expenses. A positive figure means it earns more from resident care than it spends to deliver it; a negative figure means the opposite. It excludes non-operating "other income."
-$827.0K
Voluntary non-profit community Operated by a church.
Net patient revenue Info Net patient revenue — what the home actually collects for resident care, after contractual allowances, bad debt and discounts are subtracted from its gross charges (CMS cost report, Worksheet G-3). It covers resident care only; money the home earns from other sources is shown separately as "Other income."
$13.3M Rank #23 / 210Revenue — State benchmarkedThis home is ranked 23rd out of 210 homes in Ohio. Shows this facility's annual revenue compared to the Ohio average. Higher revenue generally means more resources for staffing and capital — read alongside Payroll %.Ranking totals vary by category as each rank only includes facilities that report data for that metric. Homes missing that data point aren't included in the ranking.Click the rank badge to see the full State ranking.Click here to see the full State ranking.
Net patient income Info Net patient income: net patient revenue minus the home's total operating expenses. A positive figure means it earns more from resident care than it spends to deliver it; a negative figure means the opposite. It excludes non-operating "other income."
-$827.0K
Other income Info Money the home earns outside of resident care — such as investments, grants, rentals and other non-operating sources (CMS cost report, Worksheet G-3). It is tracked separately from net patient revenue: it is not part of that figure, and it is not included in net patient income.
$680.5K
Payroll costs Info Staff salaries plus wage-related costs — benefits such as payroll taxes, health insurance and retirement — from the home's own accounting records (CMS cost report, Worksheet A). Contract or agency labor is counted separately, under other operating costs. Rank #39 / 210Payroll — State benchmarkedThis home is ranked 39th out of 210 homes in Ohio. Shows total annual staff payroll benchmarked to the Ohio average. Higher payroll investment relative to peers often signals better staffing and less reliance on cheaper contract labor.Ranking totals vary by category as each rank only includes facilities that report data for that metric. Homes missing that data point aren't included in the ranking.Click the rank badge to see the full State ranking.Click here to see the full State ranking.
$8.1M 61.1% of net patient revenue Info Payroll as a share of revenue: staff salaries and wage-related benefits divided by net patient revenue. A higher figure means more of each revenue dollar goes to staff pay. Rank #168 / 210Payroll % — State benchmarkedThis home is ranked 168th out of 210 homes in Ohio. Shows payroll as a percentage of revenue versus the Ohio average. Well-run Ohio facilities typically land around 54–64% — the top third Statewide. Below 25% may signal understaffing or heavy agency use — read with Staffing ratings.Ranking totals vary by category as each rank only includes facilities that report data for that metric. Homes missing that data point aren't included in the ranking.Click the rank badge to see the full State ranking.Click here to see the full State ranking.
Other operating costs Info Everything it costs to run the home apart from payroll — food, utilities, supplies, maintenance, contract labor and administration. Calculated as total operating expense minus payroll (staff salaries and wage-related benefits).
$6.0M
Total costs Info The home's total operating expense for the year — all the costs of running it, salaries included (CMS cost report, Worksheet G-3).
$14.1M

What does this home offer?

Building type icon
Building type icon

Building Type: Single-story

Who this home usually serves

TYPE OF STAY

Primarily short stays

Residents typically stay for brief periods, with frequent admissions and discharges throughout the year.

Most new residents arrive under private pay (60% of admissions), and a typical private pay stay runs around 11 - 12 months.

Admissions
176 total

Coverage residents most often arrive under.

Medicare 32%
Private pay 60%
Medicaid 9%
Discharges
365 total

Coverage residents most often leave under.

Medicare 15%
Private pay 65%
Medicaid 20%

Places of interest near Laurels of Massillon

Address 2.6 miles from city center Info Estimated distance in miles from Massillon's city center to Laurels of Massillon's address, calculated via Google Maps.

Calculate Travel Distance to Laurels of Massillon

Add your location

Address

Compare Nursing Home around Massillon

The information below is reported by the Ohio Department of Health, Bureau of Survey and Certification.

2 facilities compared · CMS & OH Dept. of Health data

Laurels of Massillon
NH
AL
IL
MC
Massillon
140
Facility 140
OH AVG 78
Rank #29 / 323
92.9%
Facility 92.9%
OH AVG 78.7%
Rank #48 / 211
+18%
3.81
Facility 3.81
OH AVG 3.54
Rank #60 / 210
-3% +8%
$0
Facility $0
OH AVG $74.0k
Rank #1 / 211
34
Facility 34
OH AVG 30.9
Rank #129 / 210
4.9
Facility 4.9
OH AVG 4.6
Rank #147 / 210
- 130 -
29
Facility 29
OH AVG 40
Rank #456 / 705
Sarah Sonego
$13.3M
Facility $13.3M
OH AVG $10.1M
Rank #23 / 210
$8.1M
Facility $8.1M
OH AVG $3.9M
Rank #39 / 210
61.1%
Facility 61.1%
OH AVG 40.2%
Rank #168 / 210
366078
Sprenger Health Care Rose Lane Nursing and Rehabilitation
NH
AL
IL
MC
Massillon
171
Facility 171
OH AVG 78
Rank #9 / 323
92.5%
Facility 92.5%
OH AVG 78.7%
Rank #53 / 211
+18%
3.47
Facility 3.47
OH AVG 3.54
Rank #99 / 210
+60% -2%
$0
Facility $0
OH AVG $74.0k
Rank #1 / 211
35
Facility 35
OH AVG 30.9
Rank #130 / 210
5.0
Facility 5.0
OH AVG 4.6
Rank #150 / 210
2 152 -
6
Facility 6
OH AVG 40
Rank #644 / 705
Sarah Wiedenmannot
$17.2M
Facility $17.2M
OH AVG $10.1M
Rank #16 / 210
$6.8M
Facility $6.8M
OH AVG $3.9M
Rank #26 / 210
39.8%
Facility 39.8%
OH AVG 40.2%
Rank #190 / 210
365289

Financial Assistance for
Nursing Home in Ohio

Laurels of Massillon is located in Massillon, Ohio.
Here are the financial assistance programs available to residents in Ohio.

Get Financial aid guidance

PASSPORT Waiver

Ohio Medicaid PASSPORT

Age 60+
General Ohio resident, Medicaid-eligible, nursing home-level care need.
Income Limits (2025) ~$2,829/month 300% FBR, individual
Asset Limits $2,000 (individual), $3,000 (couple).
OH

Administered through regional agencies; waitlists possible.

Benefits
Personal care (5-7 hours/day) Respite (240 hours/year) Adult day care ($65/day) Home modifications ($1,500 avg.)

Ohio Home Care Program (non-Medicaid)

OH HCP

Age 60+
General Ohio resident, at risk of decline.
Income Limits ~$2,000/month individual, varies
Asset Limits $5,000 individual
OH

Limited funding; regional variation.

Benefits
In-home care (3-5 hours/week) Respite (up to 10 days/year) Transportation (~5 trips/month)

Assisted Living Waiver (ALW)

Ohio Assisted Living Waiver

Age 21+ (65+ prioritized)
General OH resident, Medicaid-eligible, NFLOC.
Income Limits (2025) ~$2,829/month (individual); QIT required.
Asset Limits $2,000 (individual), $3,000 (couple).
OH

Covers ~300 facilities; room/board not included (separate cost).

Benefits
Personal care Meals Medication management Transportation (~$3,000-$4,000/month value)

Program of All-Inclusive Care for the Elderly (PACE)

Ohio PACE (e.g., McGregor PACE)

Age 55+
General OH resident (specific counties), NFLOC, safe with PACE support.
Income Limits (2025) ~$2,829/month (Medicaid-eligible); private pay option available.
Asset Limits $2,000 (individual), $3,000 (couple) for Medicaid enrollees.
OH

Available in 9 counties (e.g., Cuyahoga, Franklin); expanding via Healthy Aging Grants.

Benefits
Personal care (5-7 hours/day) Medical care Meals Transportation Respite Therapies

Medicare Savings Program (MSP)

Ohio Medicare Savings Program

Age 65+ or disabled
General OH resident, Medicare Part A/B.
Income Limits (2025) ~$2,510/month (QMB), ~$3,380/month (SLMB), ~$3,598/month (QI)—individual.
Asset Limits $9,430 (individual), $14,130 (couple).
OH

Three tiers; includes Extra Help for Part D; no waitlist.

Benefits
Covers Part B premiums ($174.70/month) Deductibles ($240/year) Copays (~20%)

Home Energy Assistance Program (HEAP)

Ohio HEAP

Age 60+ prioritized
General OH resident, low-income household.
Income Limits (2025) ~$3,970/month individual, 185% FPL
Asset Limits Not assessed; income-focused.
OH

Covers gas, electric, oil; emergency aid via Winter/Summer Crisis Programs.

Benefits
Heating/cooling aid ($300-$1,000/season) Emergency aid ($500 max)

Family Caregiver Support Program (FCSP)

Ohio Family Caregiver Support Program

Age
General Caregivers of 60+ needing care or 55+ caregivers of others; OH resident; functional needs (2+ ADLs).
Income Limits (2025) Prioritizes ~$24,980/year (individual); no strict cap.
Asset Limits Not assessed; need-based.
OH

12 AAAs; rural/low-income priority; volunteer respite option.

Benefits
Respite (4-6 hours/week or 5 days/year) Adult day care ($60/day) Training Supplies (~$500/year)

VA Aid and Attendance (A&A) and Housebound Benefits

Ohio VA Aid and Attendance/Housebound

Age 65+ or disabled veteran/spouse
General OH resident, wartime service, need for ADL help (A&A) or homebound.
Income Limits (2025) Net income < ~$1,984/month (veteran with dependent, A&A); pension offsets income.
Asset Limits ~$155,356 net worth limit
OH

High veteran demand; supports care in multiple settings.

Benefits
Cash (~$1,433-$2,642/month veteran, ~$951-$1,318 spouse) for care costs (e.g., in-home, assisted living)

Homestead Exemption

Ohio Homestead Exemption

Age 65+ (or disabled)
General OH resident, homeowner, low-income.
Income Limits (2025) ~$38,500/year individual, adjusted annually
Asset Limits Not assessed; home ownership required.
OH

Reduces taxable value by $25,000; applies to primary residence.

Benefits
Tax reduction (~$400-$800/year avg., varies by county)

Save the Dream Ohio (Homeowner Assistance Fund)

Ohio Save the Dream

Age 60+ prioritized
General OH resident, homeowner, hardship post-Jan 21, 2020.
Income Limits (2025) ~$147,600/year family of 4, 150% AMI; varies by county
Asset Limits Not assessed; hardship-focused.
OH

Covers delinquent mortgages, utilities, taxes; max $25,000 mortgage aid.

Benefits
Mortgage aid ($25,000 max) Utility/property tax aid ($5,000 avg.)

Frequently Asked Questions about Laurels of Massillon

Is Laurels of Massillon in a walkable area?

Laurels of Massillon has a walk score of 29. Somewhat walkable. A few nearby services may be reachable on foot, but most trips require transportation.

What is the occupancy rate at Laurels of Massillon?

Laurels of Massillon's occupancy is 86.6%.

Are there photos of Laurels of Massillon?

Yes — there are 4 photos of Laurels of Massillon in the photo gallery on this page.

What is the address of Laurels of Massillon?

Laurels of Massillon is located at 2000 Sherman Cir NE, Massillon, OH 44646, United States.

What is the phone number of Laurels of Massillon?

(330) 830-9988 will put you in contact with the team at Laurels of Massillon.

Is Laurels of Massillon Medicare or Medicaid certified?

Yes — Laurels of Massillon is a CMS-certified provider of Medicare and Medicaid.

Guides for Better Senior Living

Care Cost Calculator: See Prices in Your Area

Nursing Home Data Explorer

Don’t Wait Too Long: 7 Red Flag Signs Your Parent Needs Assisted Living Now

The True Cost of Assisted Living in 2025 – And How Families Are Paying For It

Understanding Senior Living Costs: Pricing Models, Discounts & Financial Assistance