Total health inspections
3
Arizona average 6.3
Last Health inspection on Sep 2025

We arrange tours, appointments, and even moving support so you don’t have to
Thank you for your interest!
Our team will be in touch shortly to help with next steps.
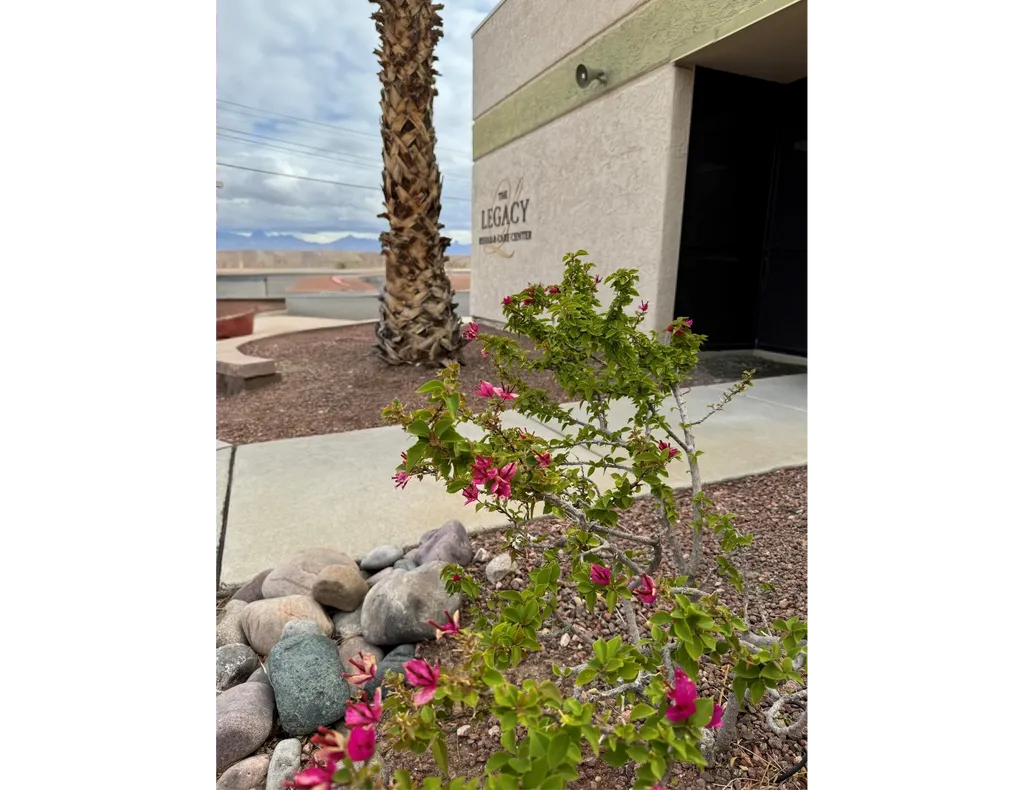
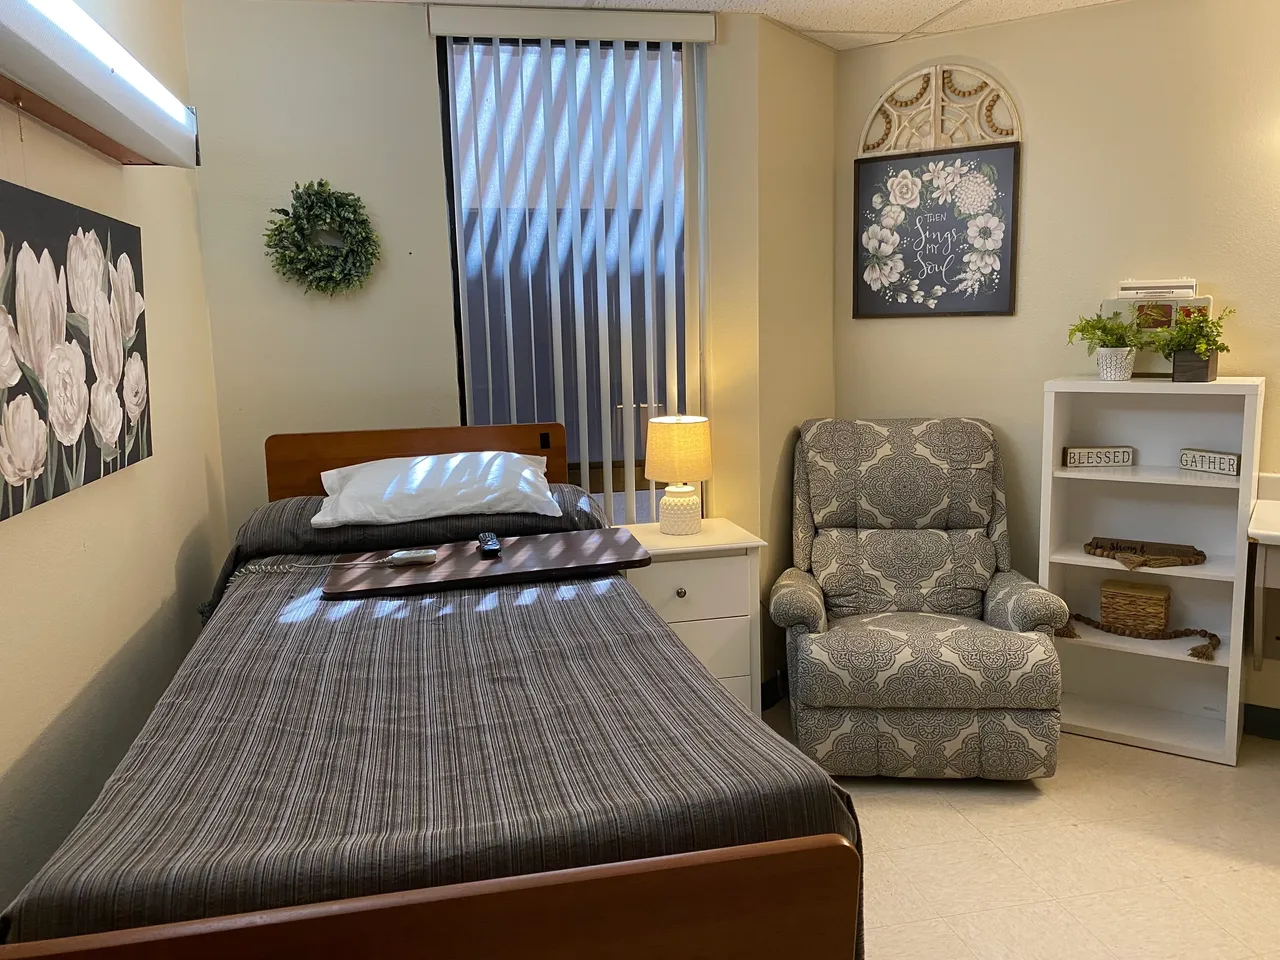
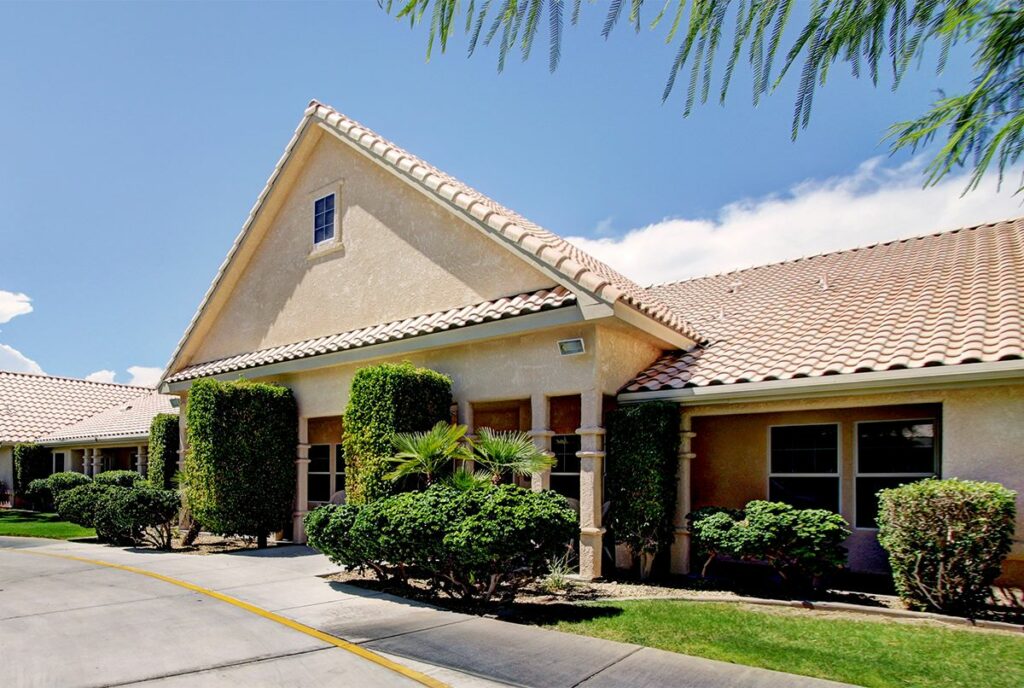
Conveniently located in the charming neighborhood of Silver Creek Road, Bullhead City, AZ, Legacy Rehab & Care Center is an outstanding senior living community focusing on rehabilitation and skilled nursing. The community also provides occupational, physical, and speech therapy to help improve seniors’ well-being. With a compassionate and reliable team delivering top-tier care and assistance, seniors can rest assured of meeting their special needs and preferences.
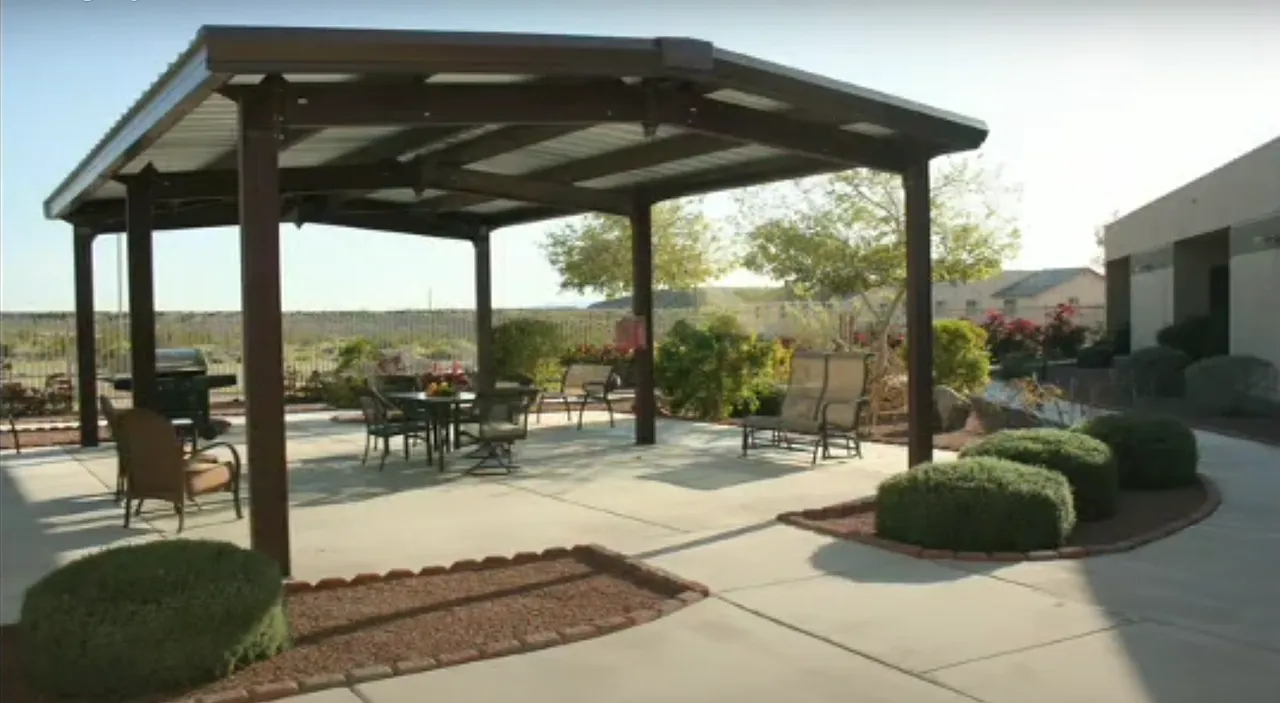
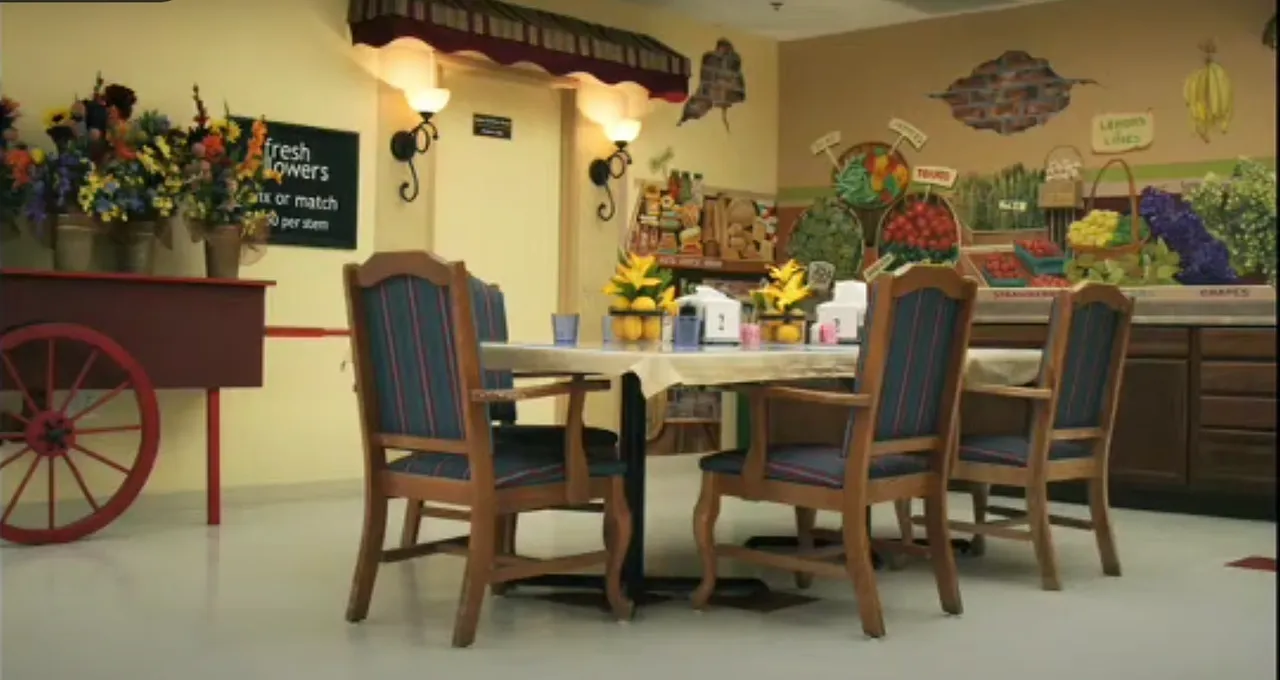
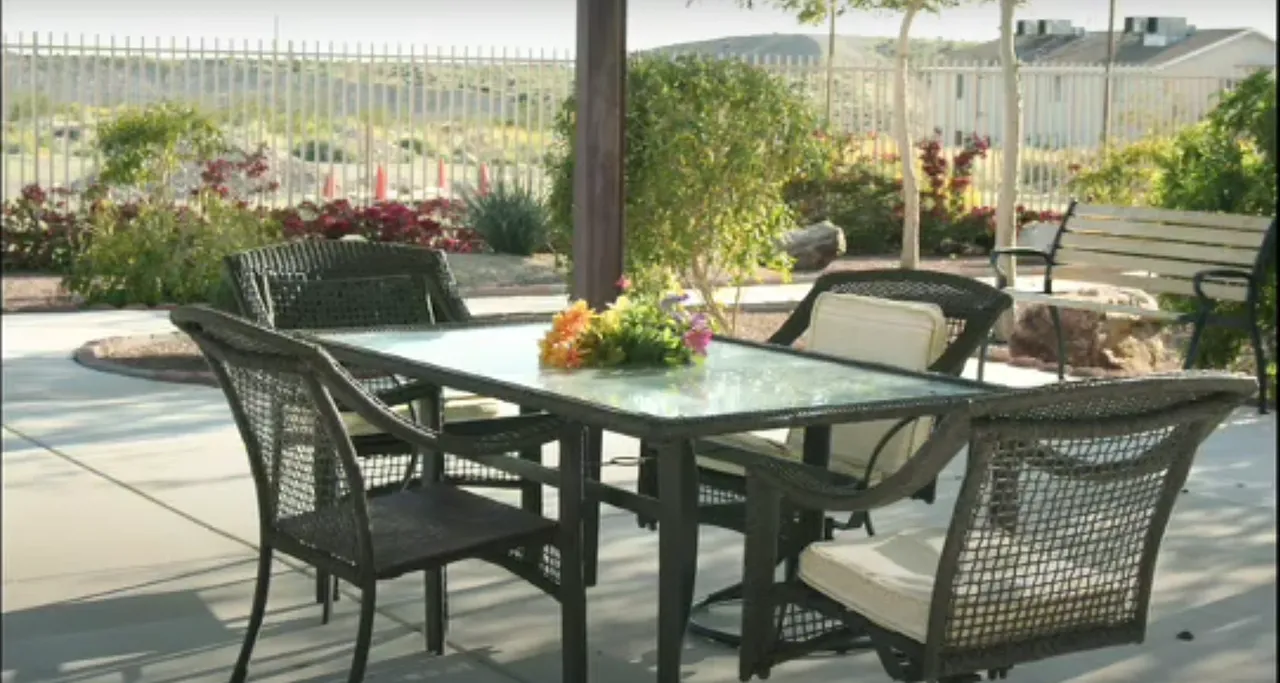
Ensuring that residents age gracefully with its care, the community conducts carefully thought-of activities and events that encourage them to remain active and socially engaged. Here, residents also do not have to worry about meal preparation, as there are various dining options served to cater to dietary needs and preferences. Legacy Rehab & Care Center strives to provide a safe place for seniors to spend their golden years without worries.
Kristen is the Administrator for The Legacy Rehab & Care Center. She has been a licensed Nursing Home Administrator since 2011 and has worked with the organization in various roles since 2006. Kristen is dedicated to providing quality care and is passionate about serving Bullhead’s rural community.
Offers a balance of services and community atmosphere.
Lower occupancy suggests more openings may be available.
This home supports both short-term rehab and long-term care, with residents staying for a wide range of durations.
38% of new residents, usually for short-term rehab.
50% of new residents, often for short stays.
12% of new residents, often for long-term daily care.
Legacy Rehab & Care Center is legally operated by The Legacy Rehab & Care Center, and administrated by Kristen Ott.
Key information about the people who lead and staff this community.
Accept Medicaid: Yes
Total Residents: 120
In Arizona, the Department of Health Services, Bureau of Long Term Care Licensing performs regular onsite inspections and investigates complaints for all licensed residential and nursing facilities.
8 complaint inspections
Arizona average: 6 complaint visits
Arizona average: 5 inspections
Formal expressions of dissatisfaction or concern made by residents, or their families regarding various aspects of the care, services, and environment provided.
Arizona average: 6 complaints
Deficiencies indicate regulatory issues. A higher number implies the facility had several areas requiring improvement.
Arizona average: 9 deficiencies
The most recent inspection on August 21, 2025, was a complaint survey with no deficiencies cited. Earlier inspections generally showed compliance, though a February 9, 2023, survey cited several deficiencies related to pre-admission screening, environmental conditions, premises safety, and fire safety procedures. Complaint investigations throughout the period were unsubstantiated and did not result in citations. No fines, enforcement actions, or license issues were listed in the available reports. The facility appears to have addressed prior issues, as more recent inspections have not identified deficiencies.
Arizona average 6.3
Last Health inspection on Sep 2025
Arizona average 23.2
Arizona average 3.82
Health citations are formal notices following inspections when they fail to comply with safety and care standards.
5 of 6 citations resulted from standard inspections; and 1 of 6 resulted from complaint investigations.
Arizona average: 0.1
Arizona average: 0.6
Data sourced from CMS Health Deficiencies reports. Citation severity codes range from A (least serious) to L (most serious). Immediate Jeopardy (J-L) citations indicate situations where the facility's noncompliance has placed residents at risk of death or serious harm.
Assisted Living A licensed, long-term care setting for seniors or individuals with disabilities who need help with daily activities — like bathing, dressing, and medication management — but not 24-hour skilled nursing. Offers housing, meals, and around-the-clock support while aiming to maximize resident independence.
Independent Living Lifestyle-focused communities for older adults offering dining, activities, and transportation with minimal personal care. Best for active, independent seniors who want community without medical support.
Memory Care Secured, specialized care for people living with Alzheimer's or dementia. Staff trained in cognitive impairment, with higher staff-to-resident ratios and an environment designed to reduce confusion and wandering risk.
Nursing Home Licensed facility providing 24/7 skilled nursing care for residents with complex, ongoing medical needs. Staffed by RNs, LPNs, and CNAs. Inspected and star-rated annually by CMS. Accepts Medicare (short-term rehab) and Medicaid (long-term care).
Assisted Living A licensed, long-term care setting for seniors or individuals with disabilities who need help with daily activities — like bathing, dressing, and medication management — but not 24-hour skilled nursing. Offers housing, meals, and around-the-clock support while aiming to maximize resident independence.
Respite Care Short-term temporary care — days to weeks — to give family caregivers a break. Full care provided during the stay. Often used after hospitalization or to trial a facility before a permanent placement decision.
![]() 3.6 miles from city center
3.6 miles from city center
![]() 2812 Silver Creek Rd, Bullhead City, AZ 86442
2812 Silver Creek Rd, Bullhead City, AZ 86442
Add your location
This data corresponds to Q2 2025 and is based on CMS Payroll-Based Journal.
Arizona average ratio: 1.83:1
Arizona average: 8.5 hours
Manages medical care and health needs.
No contractors work on this role.
Assists with medical care and medications.
This role is partially covered by contractors.
Helps with daily care and mobility.
No contractors work on this role.
Total hours from contractors
738 contractor hours this quarter
| Certified Nursing Assistant | 37 | 0 | 37 | 10,068 | 91 | 100% | 9.2 |
| Licensed Practical Nurse | 12 | 4 | 16 | 4,962 | 91 | 100% | 9 |
| Medication Aide/Technician | 6 | 0 | 6 | 2,384 | 91 | 100% | 9.7 |
| Registered Nurse | 5 | 0 | 5 | 960 | 84 | 92% | 7.1 |
| Clinical Nurse Specialist | 2 | 0 | 2 | 893 | 66 | 73% | 8.4 |
| Physical Therapy Aide | 4 | 0 | 4 | 815 | 65 | 71% | 7 |
| Nurse Practitioner | 2 | 0 | 2 | 569 | 62 | 68% | 8 |
| Dental Services Staff | 2 | 0 | 2 | 560 | 57 | 63% | 8.1 |
| Dietitian | 1 | 0 | 1 | 508 | 62 | 68% | 8.2 |
| RN Director of Nursing | 1 | 0 | 1 | 477 | 60 | 66% | 8 |
| Respiratory Therapy Technician | 2 | 0 | 2 | 376 | 62 | 68% | 6.1 |
| Other Dietary Services Staff | 2 | 0 | 2 | 269 | 47 | 52% | 5.7 |
| Administrator | 1 | 0 | 1 | 240 | 60 | 66% | 4 |
| Speech Language Pathologist | 2 | 0 | 2 | 212 | 27 | 30% | 7.8 |
| Nurse Aide in Training | 5 | 0 | 5 | 194 | 15 | 16% | 10.2 |
| Physical Therapy Assistant | 2 | 0 | 2 | 110 | 53 | 58% | 2.1 |
| Qualified Social Worker | 1 | 0 | 1 | 48 | 14 | 15% | 3.4 |
| Medical Director | 0 | 1 | 1 | 2 | 1 | 1% | 1.5 |
Source: CMS Long-Term Care Facility Characteristics (Data as of Jan 2026)
Residents meet regularly to discuss policies, care quality, and activities
State-approved Nurse Aide Training and Competency Evaluation Program on-site
Organized group of residents that meets regularly to discuss facility policies, quality of life, and activities.
Data sourced from CMS Long-Term Care Facility Characteristics quarterly report. Payer mix reflects the current resident census by primary payment source.
These measures show how residents usually do over time at this home, based on health outcomes and preventive care.
Arizona average: 7.6
Arizona average: 16.1
Arizona average: 11.2%
Arizona average: 15.8%
Arizona average: 20.8%
Arizona average: 2.1%
Arizona average: 5.1%
Arizona average: 1.3%
Arizona average: 5.4%
Arizona average: 4.5%
Arizona average: 10.3%
Arizona average: 97.2%
Arizona average: 94.6%
Arizona average: 91.5%
Arizona average: 1.0%
Arizona average: 87.3%
Arizona average: 24.6%
Arizona average: 10.7%
Arizona average: 0.8%
Arizona average: 53.7%
Arizona average: 50.6%
Quality measures are calculated from Minimum Data Set (MDS) assessments. For most measures, lower percentages indicate better care quality.
Historical financial and operational data for Legacy Rehab & Care Center based on CMS SNF Cost Reports.
Loading trend charts...
Care Cost Calculator: See Prices in Your Area
Nursing Home Data Explorer
Don’t Wait Too Long: 7 Red Flag Signs Your Parent Needs Assisted Living Now
The True Cost of Assisted Living in 2025 – And How Families Are Paying For It
Understanding Senior Living Costs: Pricing Models, Discounts & Financial Assistance

Touring a community? Use this expert-backed checklist to stay organized, ask the right questions, and find the perfect fit.
We'll send you a PDF version of the touring checklist.