Explore Open Rooms

1 Contact details
2 What type of senior care service are you looking for?
3 What budget do you have in mind for senior care?
4 How soon do you need to find care?
5 Additional details

Thank you for your interest!

Our team will be in touch shortly to help with next steps.

Nursing Home in Pensacola

CMS overall rating Info The Overall CMS Rating combines results from health inspections, staffing levels and quality measures. Health inspections carry the most weight. Staffing and quality scores can increase or decrease the final rating based on performance compared to state and national standards.

Life Care Center of Pensacola

3291 E Olive Rd, Pensacola, FL 32514 View map
Overview of Life Care Center of Pensacola

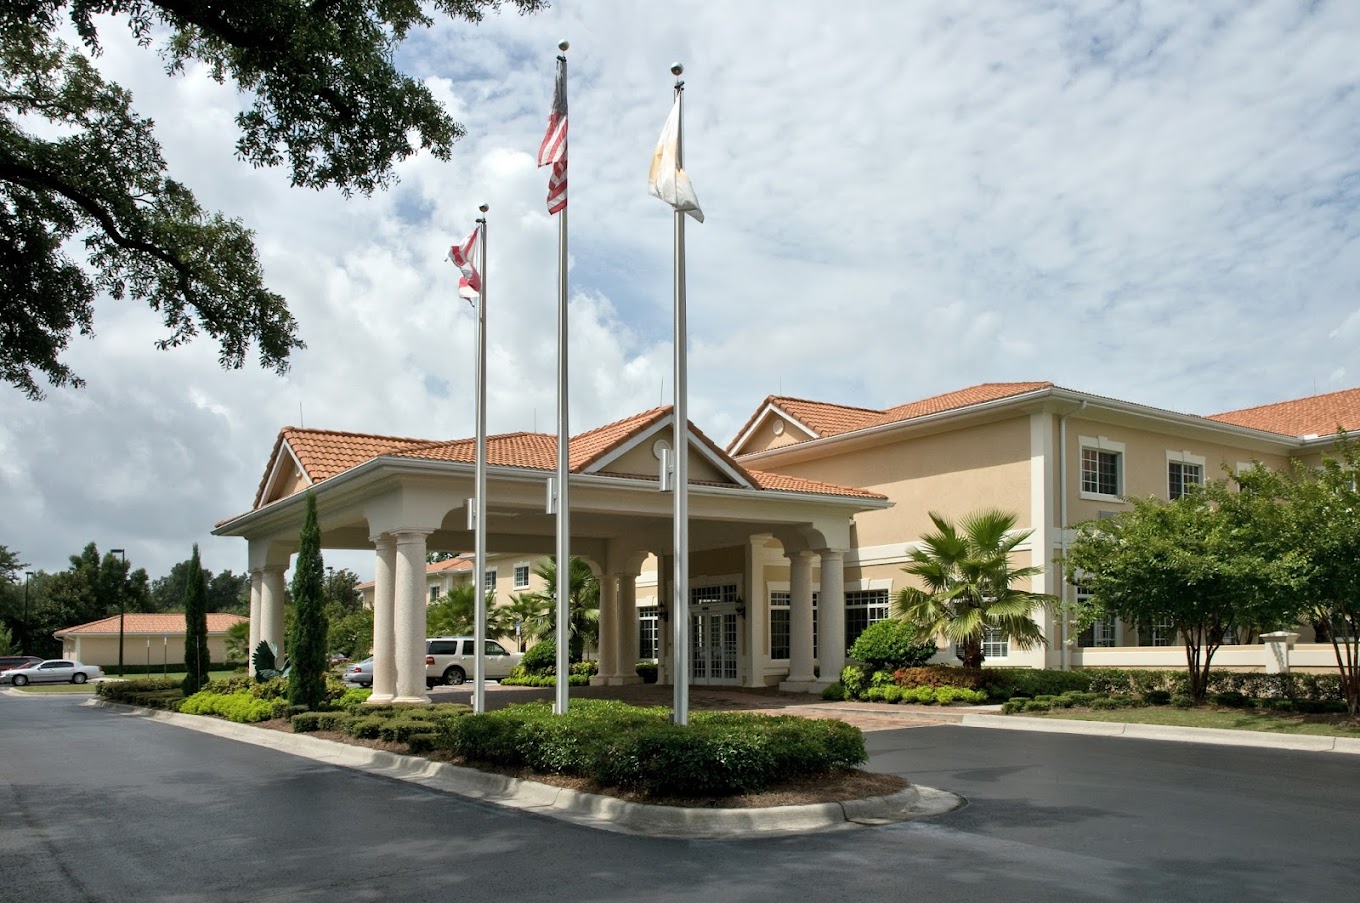
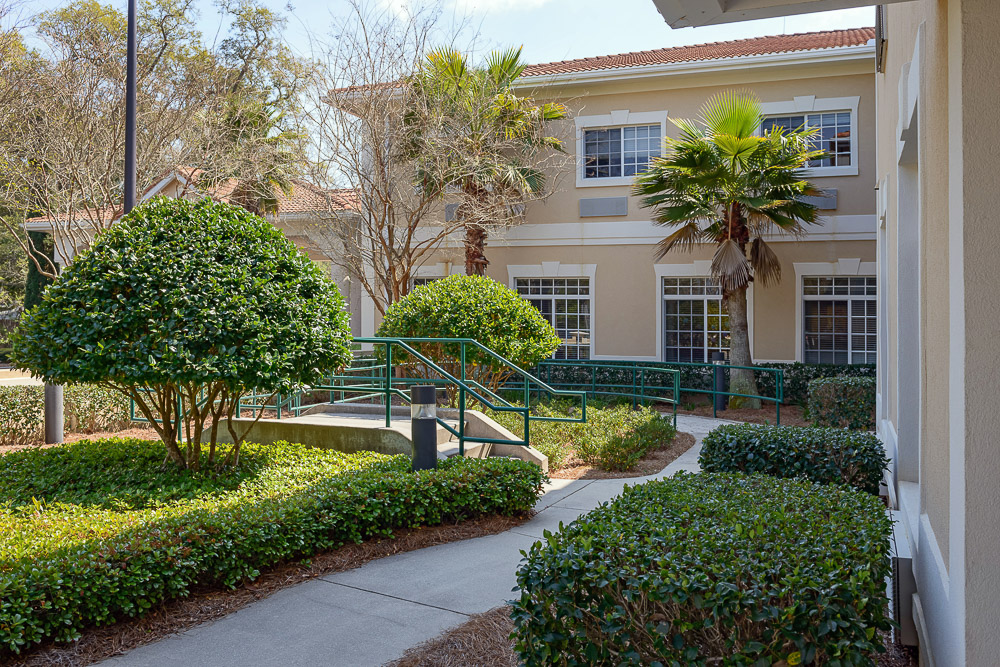
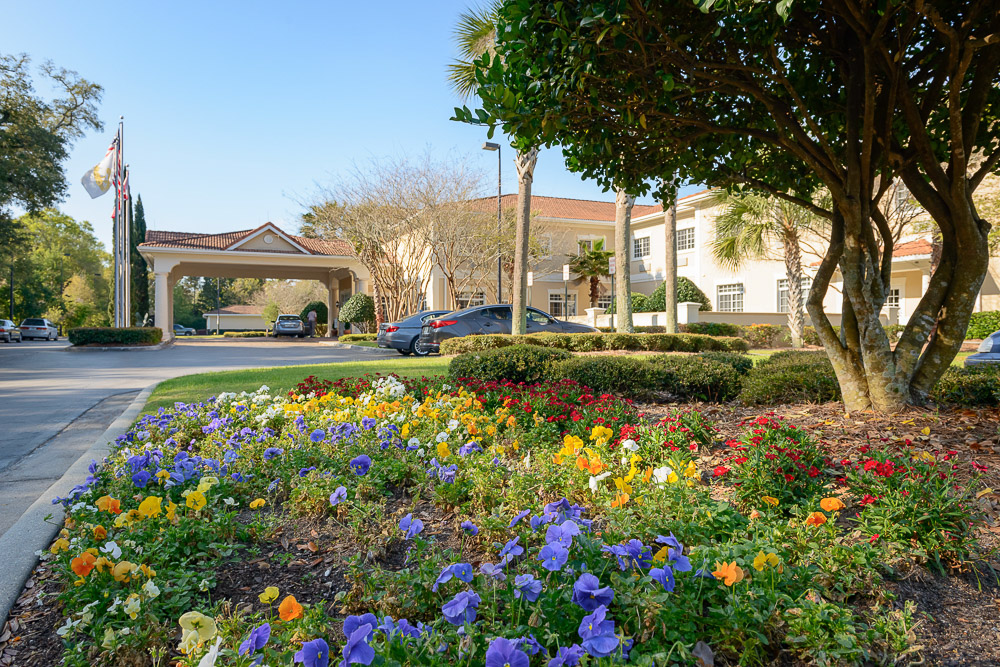
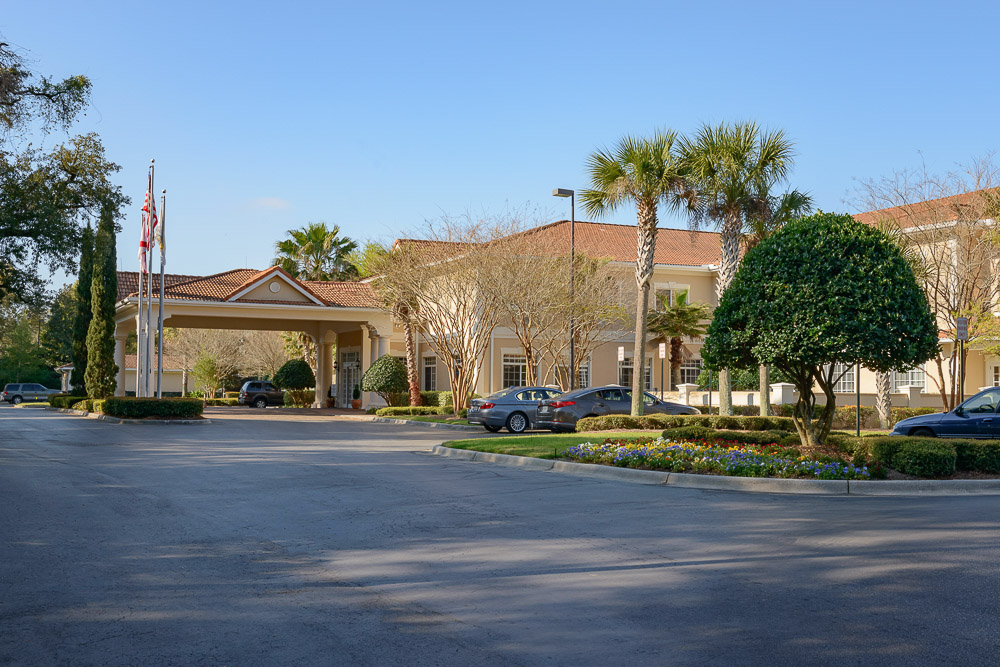
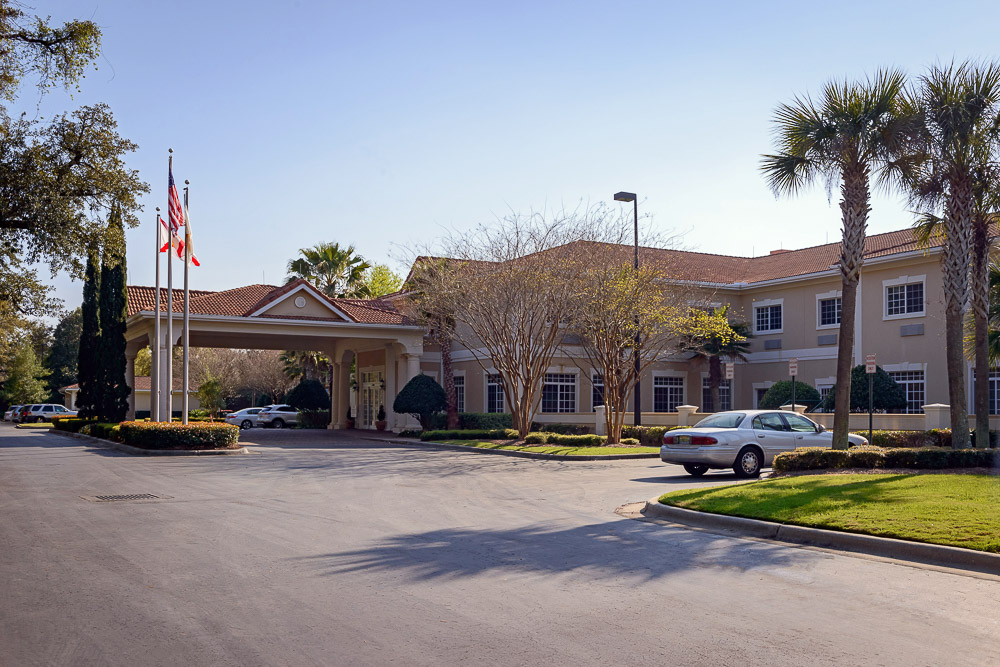
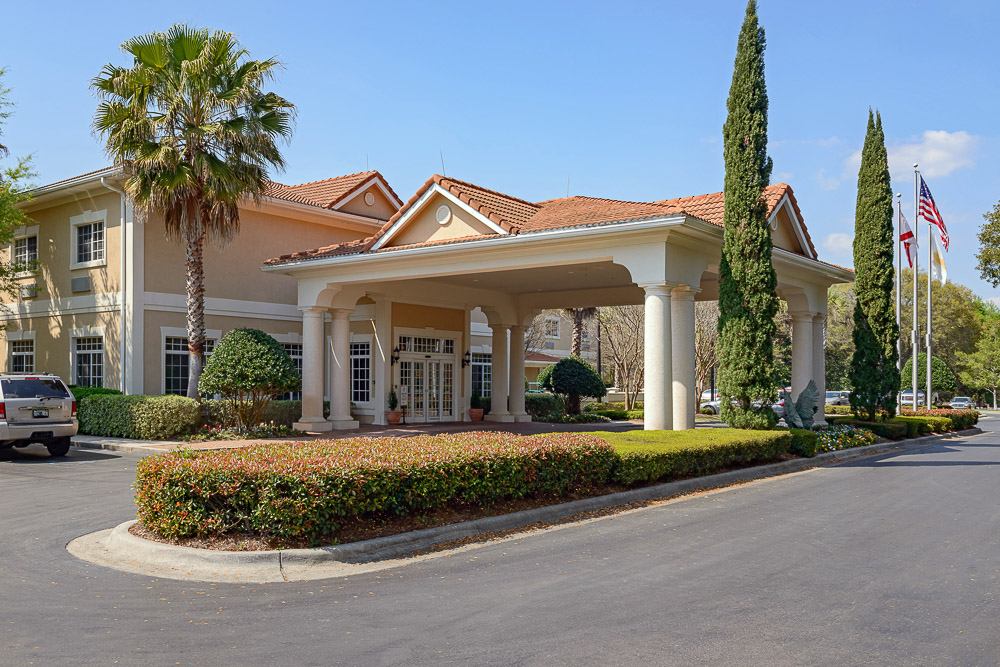
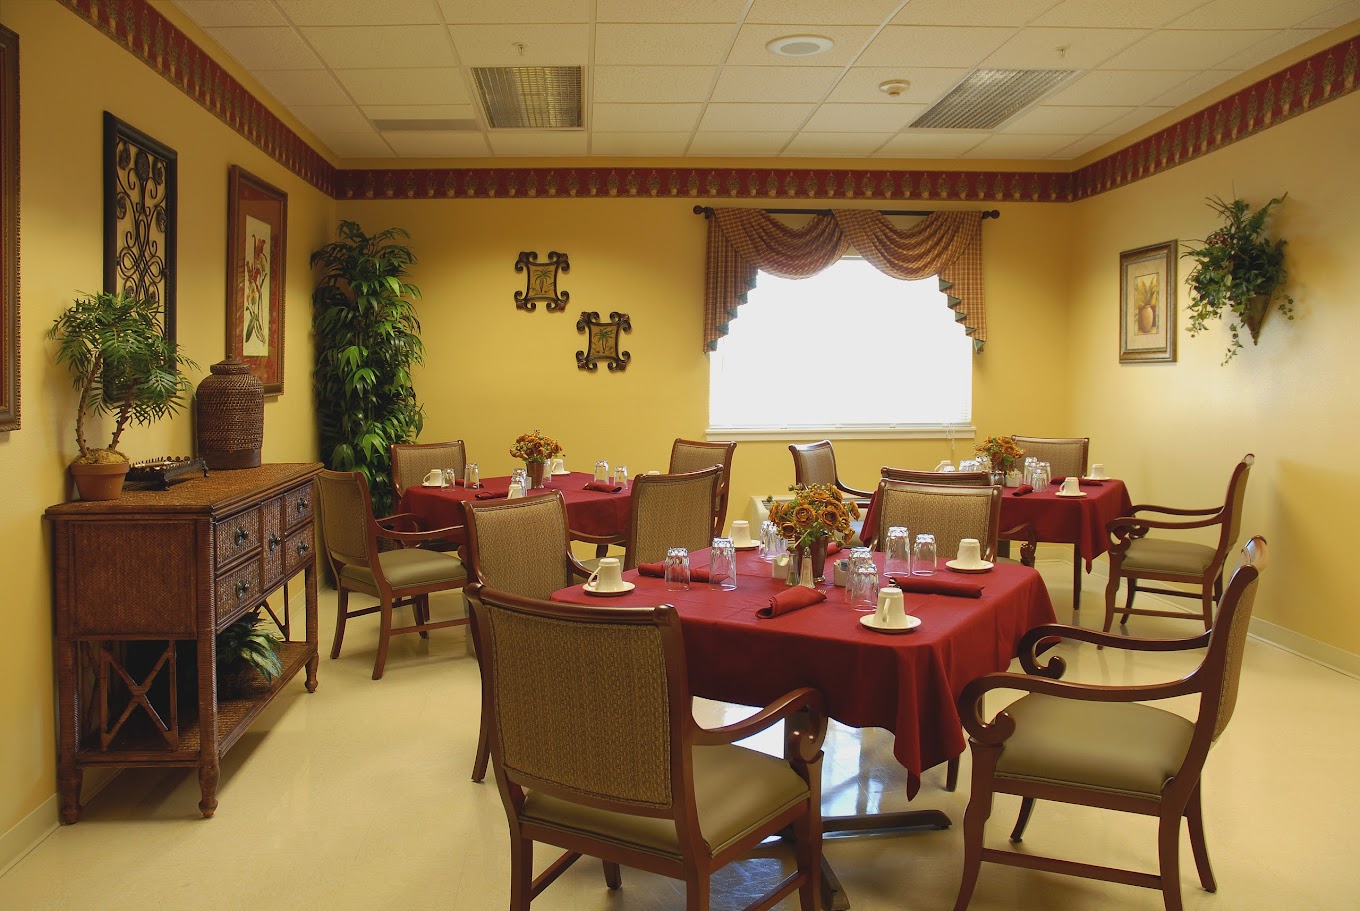
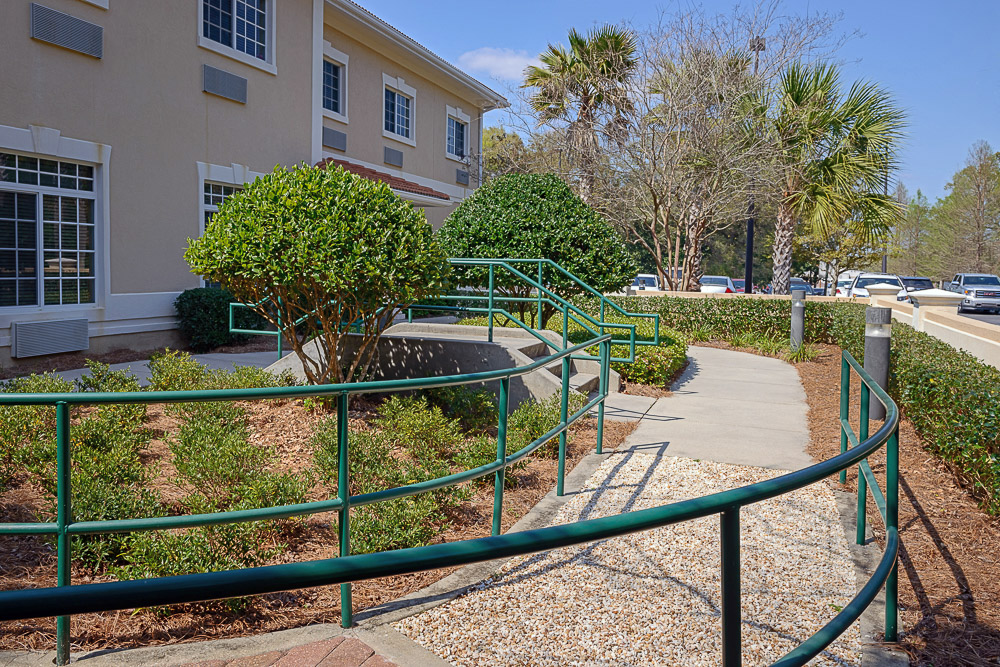
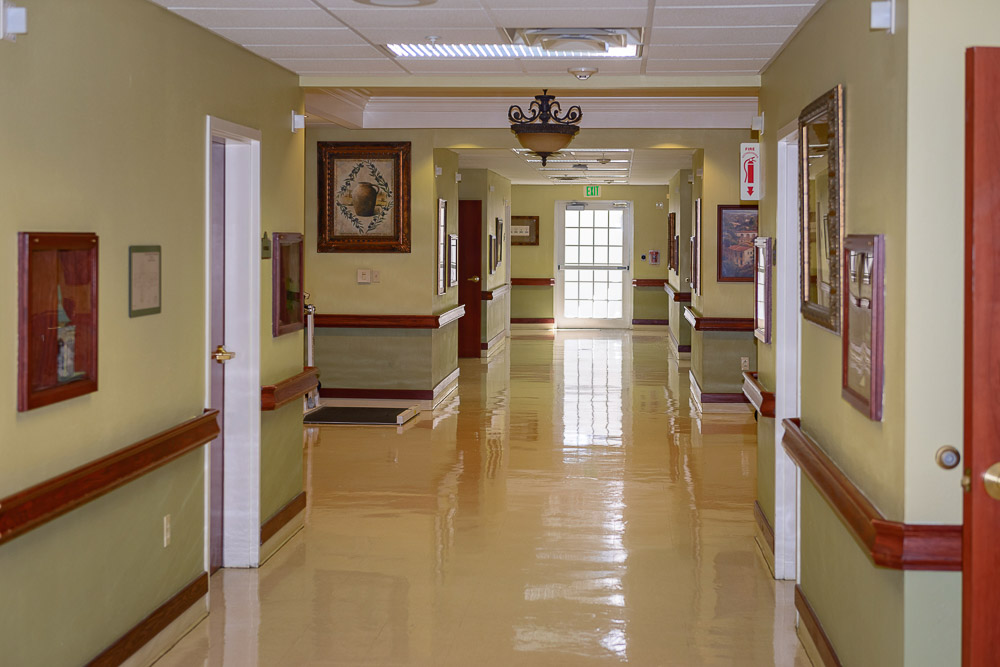
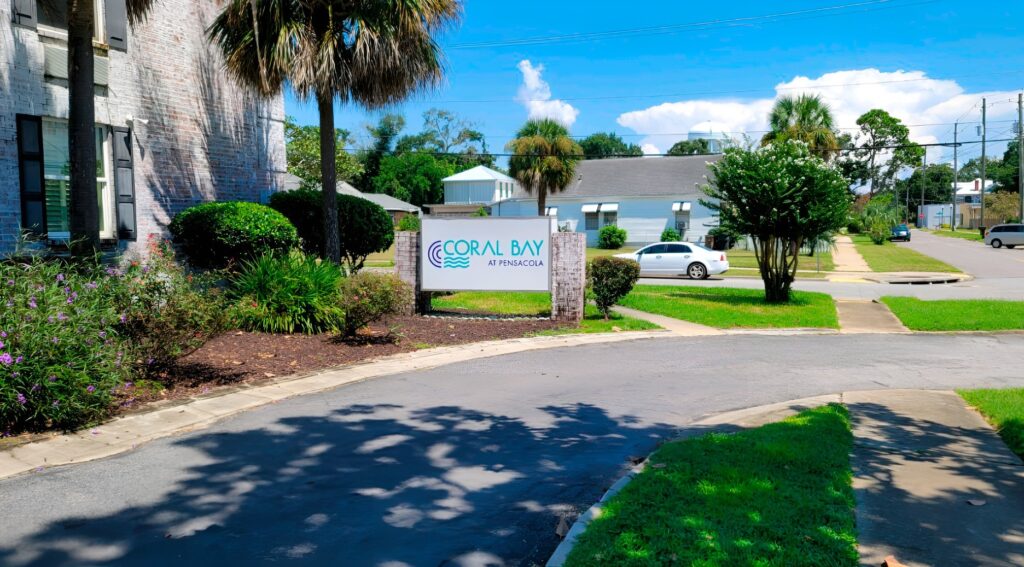
Located in the vibrant neighborhood of Pensacola, FL, Life Care Center of Pensacola is an inviting senior living community, offering compassionate skilled nursing, rehabilitation, and long-term care services. Accommodations here are built to cater to residents’ unique needs and equipped with various in-house amenities, such as flat-screen TVs, bedside and bathroom call lights, and fire safety systems. With a team of skilled caregivers, nurses and therapists for speech, physical, and occupational therapy services, residents are sure to maintain their overall well-being.

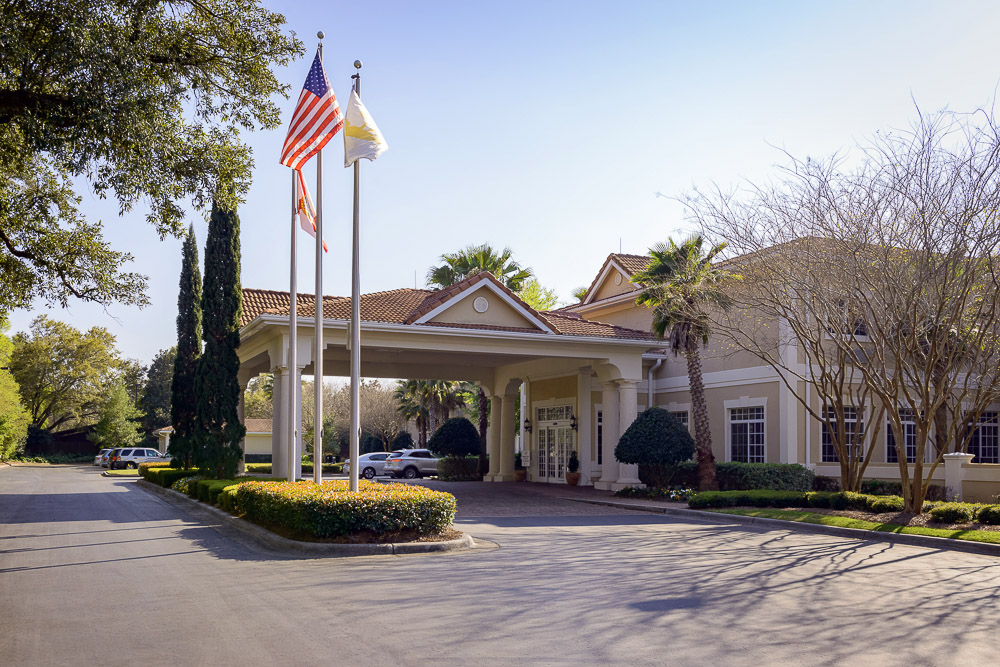
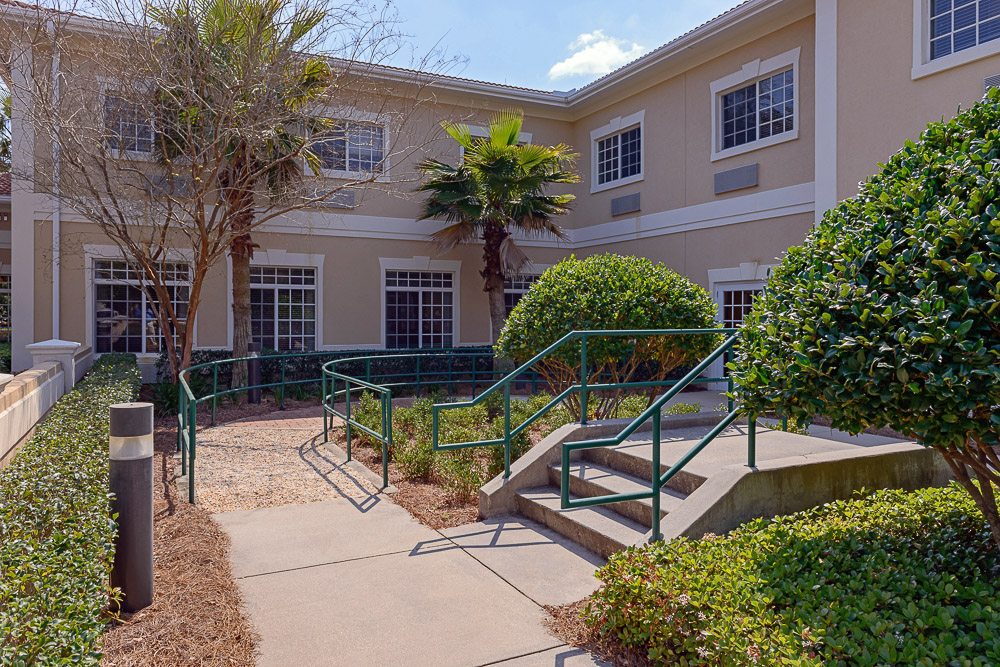
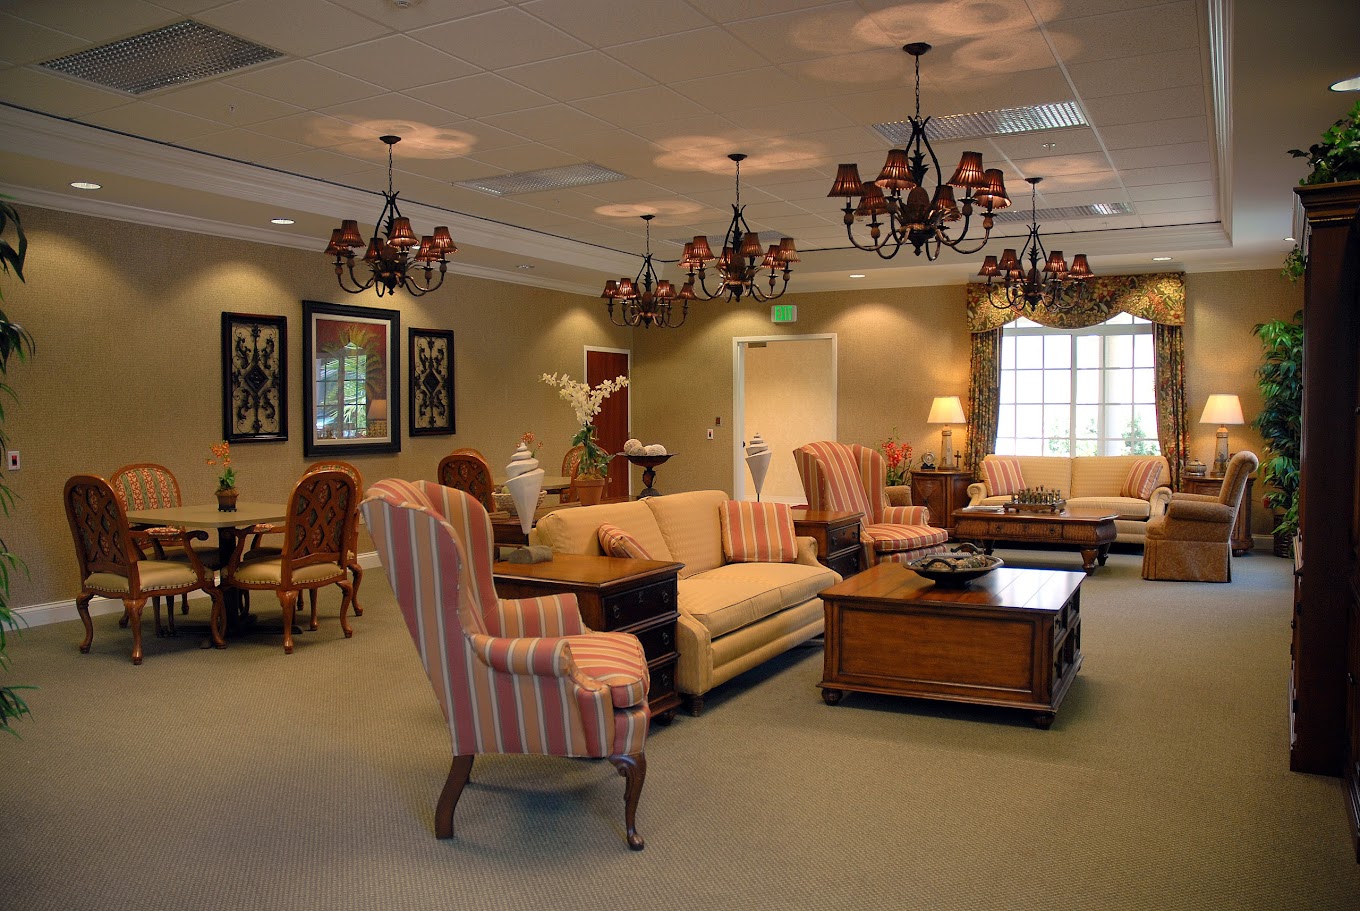
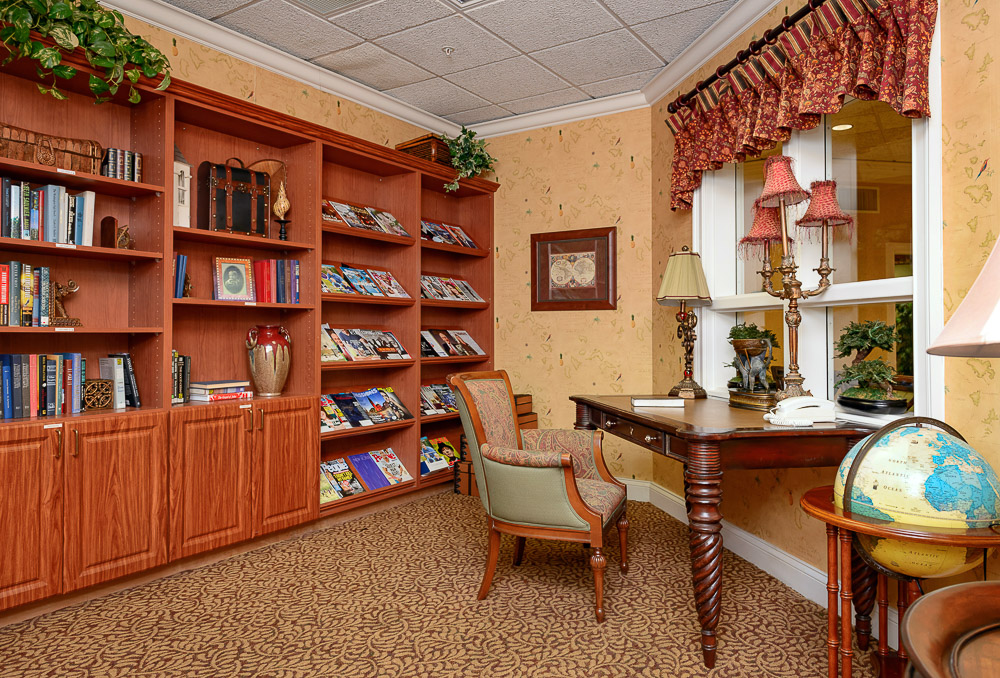
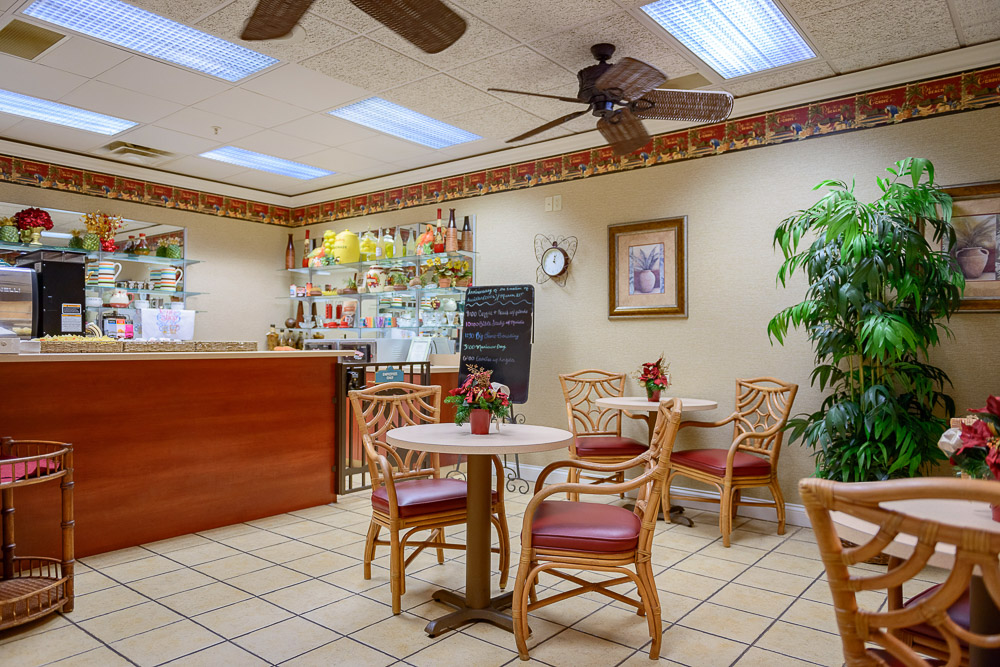
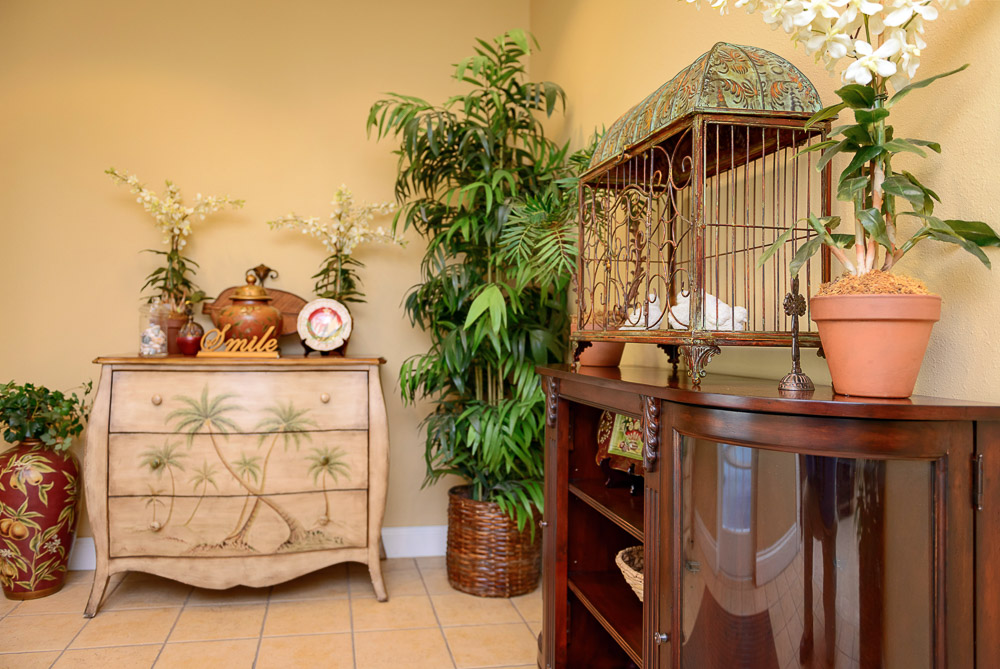
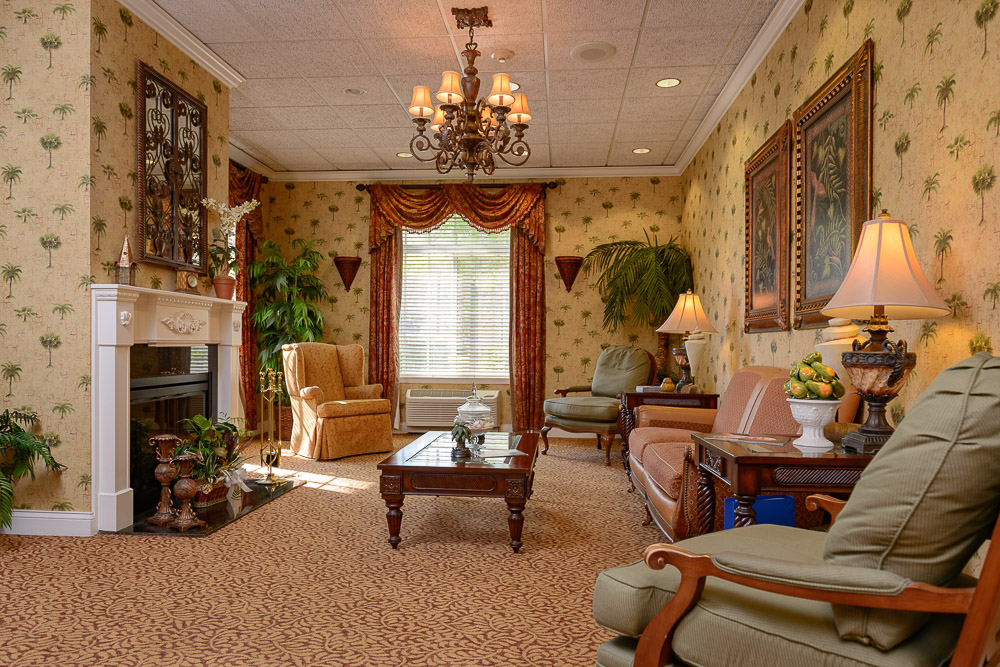
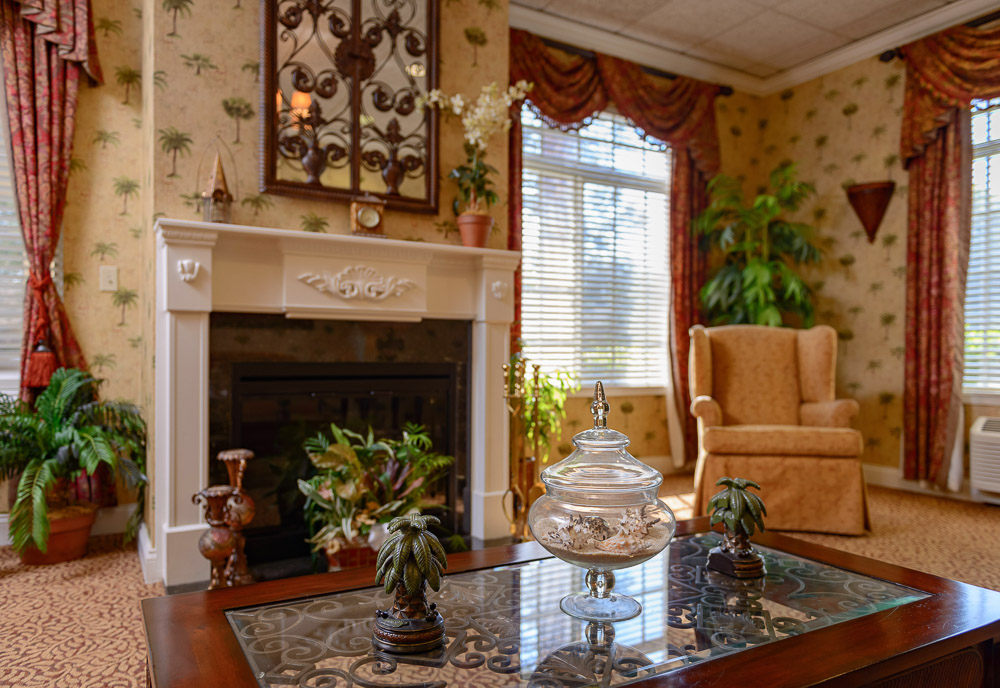
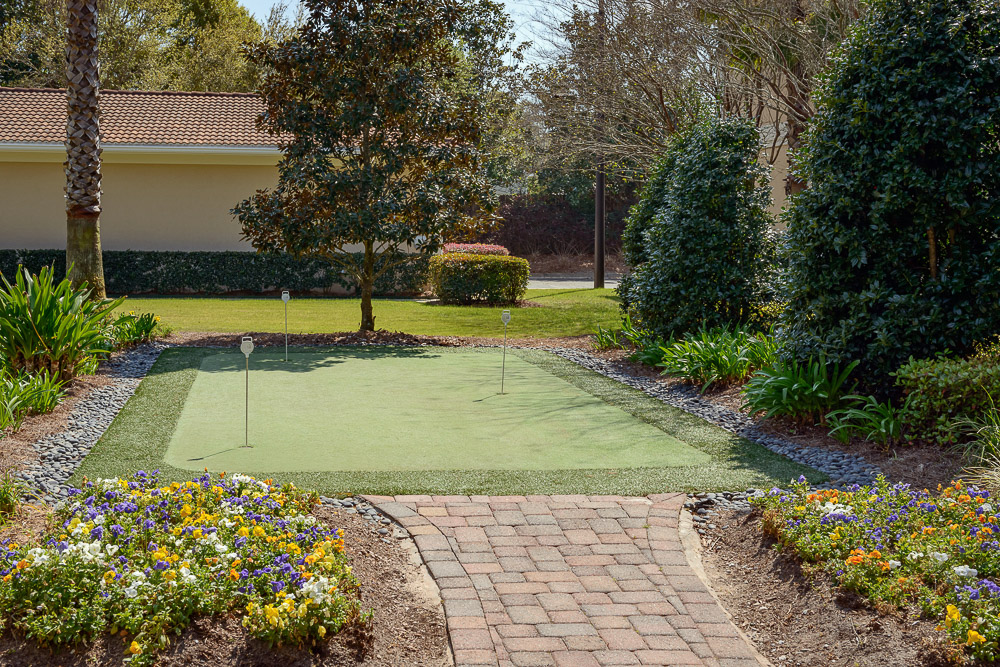
Vibrant activities and delicious meals are also offered to give residents a more enjoyable living experience. Convenient services, such as housekeeping, laundry, and transportation services are also offered to save residents from the hassles of daily living. A wide array of amenities, such as a salon, library, and beautifully landscaped grounds and courtyards are also available for a more enjoyable living experience.

(850) 494-2327

Quality ratings

Measured by Centers for Medicare & Medicaid Services (CMS)

Overall rating Info The Overall CMS Rating combines results from health inspections, staffing levels and quality measures. Health inspections carry the most weight. Staffing and quality scores can increase or decrease the final rating based on performance compared to state and national standards.
5/5
Florida average: 3.7/5
Health Inspection Info Based on the results of the facility's three most recent standard inspections and any complaint investigations. CMS reviews the number, scope, and severity of deficiencies, with more recent findings weighted more heavily.
5/5
Florida average: 3.2/5
Staffing Info Measures average nursing staff hours per resident per day, including Registered Nurses (RNs) and total nursing staff. Ratings are adjusted based on the level of care residents require and are compared to state and national benchmarks.
4/5
Florida average: 3.7/5
Quality Measures Info Based on clinical and physical health indicators reported to CMS, such as hospital readmissions, falls, pressure ulcers, and improvements in mobility. These measures reflect how well residents' health needs are being managed.
5/5
Florida average: 4.3/5

Nursing care per resident

Info This shows how many total hours of nursing staff time are available per resident each day. Higher numbers usually mean more staff support.
3h 48m per day

This home provides 14% less nursing time per resident than the Florida average.

Florida average: 4h 25m per day

Staffing hours breakdown

Info Hours of care per resident per day, broken down by staff type. Data from CMS Medicare.
Staff type Facility State avg National avg
Registered Nurse (RN) Info Registered nurse hours per resident per day. 51m per day 44m per day 41m per day
Nurse Aide Info Nurse aide hours per resident per day. 2h 14m per day 2h 20m per day 2h 21m per day
Total Nursing (Weekend) Info Total number of nurse staff hours per resident per day on weekends. 3h 20m per day 3h 31m per day 3h 26m per day
Physical Therapist Info Physical therapist staff hours per resident per day. 3m per day 5m per day 4m per day
RN (Weekend) Info Registered nurse hours per resident per day on weekends. 40m per day 32m per day 29m per day

Capacity and availability

Medium-capacity home

Offers a balance of services and community atmosphere.

Total beds 120

This home usually has limited availability

Occupancy is moderate, suggesting balanced demand.

Similar demand to the Florida average
Occupancy rate 94.7%
Residents per day (avg) 112
Occupancy rate
94.7%
Residents per day (avg)
112

Who this home usually serves

TYPE OF STAY

Mostly short-term rehab stays

Most residents typically stay for a few weeks or months before returning home or moving on.

Might be optimal for
Short stays Recovery Medicare-covered care

Breakdown by payment type

Medicare

48% of new residents, usually for short-term rehab.

Typical stay 23 days

Private pay

22% of new residents, often for short stays.

Typical stay 1 - 2 months

Medicaid

30% of new residents, often for long-term daily care.

Typical stay 5 - 6 months

Finances and operations

Privately-owned community
Home revenue
$21.6M
Profit
$808.0K
Privately-owned community
Home revenue
$21,592,530.00
Profit
$808,005.00
Payroll costs Info The portion of the home's budget spent on staff, including nurses, caregivers, and other employees who support care and operations.
$7.2M
33.3% of revenue
Other operating costs Info All remaining costs needed to run the home, such as food, utilities, building maintenance, supplies and administrative expenses.
$13.6M
Total costs $20.8M
Walk Score
Walk Score: 41 / 100
Somewhat walkable. A few nearby services may be reachable on foot, but most trips require transportation.
BBB Rating
BBB Rating: A+ (Not Accredited)
An independent rating from the Better Business Bureau based on factors such as complaint history, transparency, and business practices.
How BBB ratings work

About this community

Additional Licensing Details

CMS Certification Number106073

Ownership & Operating Entity

Profit Statusfor-profit

Safety & Compliance

Safety Features24-hour security and fire safety systems.

Therapy & Rehabilitation

1 service
Rehabilitation Services

Staffing & Medical

2 services
Skilled Nursing
24-Hour Staffing

Memory & Specialized Care

1 service
Alzheimer's Certification

Amenities & Lifestyle

25 amenities
24-Hour Security And Fire Safety Systems
Beauty Salon And Barber Shop
Bedside And Bathroom Call Lights
Certified Dietitian
Community Re-Entry Program
Complimentary Wireless Internet
Daily Activity Schedule
Family/Resident Councils
Fine Dining Program
Flat-Screen Tvs
Flexible Visiting Hours
Full-Time
Certified Activity Director
Homelike Setting
Housekeeping And Laundry Services
Landscaped Grounds And Courtyards
Library
Non-Smoking Facility
Pet Visitors Allowed
Private And Semiprivate Rooms
Private Bathrooms
Religious Services
Patient/Family Education Program
Telephone And Cable Television Hookups
Transportation Services
ActivitiesDaily activity schedule available.
Specific ProgramsSkilled Nursing, Rehabilitation, Alzheimer's & Dementia Care, Independent & Assisted Living
Religious ServicesYes

Dining & Nutrition

Food DescriptionFine dining program available.

What does this home offer?

Accepts Medicaid icon

Accept Medicaid: Yes, Accept

Total residents icon

Total Residents: 120 Residents

Building type icon
Building type icon

Building Type: 2-story

Types of Care at Life Care Center of Pensacola

Nursing Home
Contact Life Care Center of Pensacola

Inspection History

In Florida, the Agency for Health Care Administration (AHCA) is the primary authority that conducts unannounced inspections and completes official health quality reports for all healthcare facilities.

4 visits/inspections

1 visits/inspections triggered by complaints

1 routine inspections

Results

3 with issues

1 without issues

Latest inspection

Date September 10, 2025
Annual Inspection

3 deficiencies

Deficiencies indicate regulatory issues. A higher number implies the facility had several areas requiring improvement.

Florida average: 19 deficiencies

0 fines

Florida average: 5 fines

Total amount fined: $0.00

Florida average: $11,623.53

Health Inspection History

Inspections
Total health inspections 3

Florida average 4.3


Last Health inspection on Sep 2025

Total health citations 3

Florida average 19.7

Citations per inspection
1

Florida average 4.48


Health citations are formal notices following inspections when they fail to comply with safety and care standards.

2 of 3 citations resulted from standard inspections; and 1 of 3 resulted from complaint investigations.

Breakdown of citation severity (last 3 years)
Critical Health citations More info 0
100% better than Florida average

Florida average: 0.8


Serious Health citations More info 0
100% better than Florida average

Florida average: 0.4

0 critical citations More info Florida average: 0.8

0 serious citations More info Florida average: 0.4

3 moderate citations More info Florida average: 18.4

0 minor citations More info Florida average: 0.2
Citations history (last 3 years)
Infection Control moderate citation Info Issues related to preventing and controlling infections, including hygiene practices and safety protocols. Sep 10, 2025
Corrected

Infection Control moderate citation Info Issues related to preventing and controlling infections, including hygiene practices and safety protocols. Oct 02, 2024
Corrected

Infection Control moderate citation Info Issues related to preventing and controlling infections, including hygiene practices and safety protocols. Mar 30, 2023
Corrected

Compare Nursing Homes around Pensacola The information below is reported by the Florida Agency for Health Care Administration (AHCA).

3 facilities compared · CMS & FL Dept. of Health data · Updated Apr 2026

Filter by care type
Life Care Center of Pensacola
NH

Nursing Home Licensed facility providing 24/7 skilled nursing care for residents with complex, ongoing medical needs. Staffed by RNs, LPNs, and CNAs. Inspected and star-rated annually by CMS. Accepts Medicare (short-term rehab) and Medicaid (long-term care).

Pensacola (Northeast Pensacola)
120
94.7%
+12%
3.80
+5%
-6%
0
3
1.0
0
112
A+
41
Lindley, Jennifer
$21.2M
$7.2M
34%
106073
Coral Bay at Pensacola
NH

Nursing Home Licensed facility providing 24/7 skilled nursing care for residents with complex, ongoing medical needs. Staffed by RNs, LPNs, and CNAs. Inspected and star-rated annually by CMS. Accepts Medicare (short-term rehab) and Medicaid (long-term care).

Pensacola
210
91.1%
+8%
4.22
-
+4%
0
0
0.0
0
196
-
-
Coral Bay Holdings Llc
$26.5M
$8.4M
31.9%
106051
Solaris HealthCare Pensacola
-
NH

Nursing Home Licensed facility providing 24/7 skilled nursing care for residents with complex, ongoing medical needs. Staffed by RNs, LPNs, and CNAs. Inspected and star-rated annually by CMS. Accepts Medicare (short-term rehab) and Medicaid (long-term care).

Pensacola
-
-
-
-
-
-
-
-
-
0
0
0.0
0
-
-
-
-
-
-
-
-

Places of interest near Life Care Center of Pensacola

Address 8.7 miles from city center
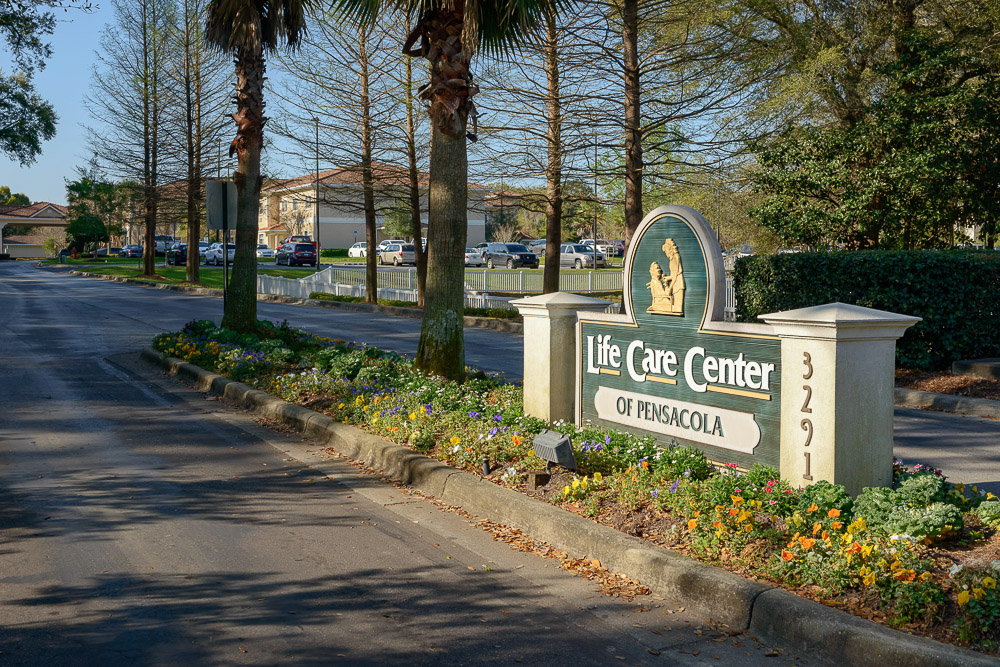
Address 3291 E Olive Rd, Pensacola, FL 32514

Calculate Travel Distance to Life Care Center of Pensacola

Add your location

Address

Staffing Data (Q2 2025)

This data corresponds to Q2 2025 and is based on CMS Payroll-Based Journal.

Total staff 168
Employees 165
Contractors 3
Staff to resident ratio 1.51:1
0% compared with Florida average

Florida average ratio: 1.52:1

Avg staff/day 69
Average shift 7.4 hours
6% worse than Florida average

Florida average: 7.9 hours

Total staff hours (quarter) 46,412
Nursing staff breakdown
Registered Nurse

Manages medical care and health needs.

Total count 21
Average shift length Info Average shift length. Calculated as total hours divided by days worked and average staff per day. 7.7 hours

No contractors work on this role.

Licensed Practical Nurse

Assists with medical care and medications.

Total count 23
Average shift length Info Average shift length. Calculated as total hours divided by days worked and average staff per day. 7.9 hours

No contractors work on this role.

Certified Nursing Assistant

Helps with daily care and mobility.

Total count 78
Average shift length Info Average shift length. Calculated as total hours divided by days worked and average staff per day. 7.3 hours

No contractors work on this role.

Contractor staffing

Total hours from contractors

0.2%

107 contractor hours this quarter

Occupational Therapy Assistant: 2 Medical Director: 1
Staff by category
Certified Nursing Assistant7807821,86591100%7.3
Licensed Practical Nurse230236,63791100%7.9
Registered Nurse210216,44291100%7.7
Dietitian7071,96291100%7.5
Clinical Nurse Specialist4041,4687178%8
Mental Health Service Worker2021,0116571%7.9
Physical Therapy Assistant4049947886%6.8
Speech Language Pathologist5059507785%6.2
RN Director of Nursing2029046673%7.9
Nurse Aide in Training5056588088%5.2
Physical Therapy Aide3036196774%6.3
Administrator1015206571%8
Nurse Practitioner1014966268%8
Occupational Therapy Aide1014725965%8
Qualified Social Worker5054597279%5.6
Respiratory Therapy Technician2024367077%6.2
Therapeutic Recreation Specialist1014135459%7.6
Medical Director0115733%19
Occupational Therapy Assistant0225044%12.5
78 Certified Nursing Assistant
% of Days 100%
23 Licensed Practical Nurse
% of Days 100%
21 Registered Nurse
% of Days 100%
7 Dietitian
% of Days 100%
4 Clinical Nurse Specialist
% of Days 78%
2 Mental Health Service Worker
% of Days 71%
4 Physical Therapy Assistant
% of Days 86%
5 Speech Language Pathologist
% of Days 85%
2 RN Director of Nursing
% of Days 73%
5 Nurse Aide in Training
% of Days 88%
3 Physical Therapy Aide
% of Days 74%
1 Administrator
% of Days 71%
1 Nurse Practitioner
% of Days 68%
1 Occupational Therapy Aide
% of Days 65%
5 Qualified Social Worker
% of Days 79%
2 Respiratory Therapy Technician
% of Days 77%
1 Therapeutic Recreation Specialist
% of Days 59%
1 Medical Director
% of Days 3%
2 Occupational Therapy Assistant
% of Days 4%

Facility Characteristics

Source: CMS Long-Term Care Facility Characteristics (Data as of Jan 2026)

Total census
111 residents
Residents by payment source
Medicare
85 residents (76.6%)
Medicaid
17 residents (15.3%)
Private pay or other
9 residents (8.1%)
Programs & Services
Residents' Group

Residents meet regularly to discuss policies, care quality, and activities

Family Member Group

Family members meet regularly to discuss policies, care quality, and activities

Active Family Council

Organized group of family members that meets regularly to discuss facility policies, resident care, and activities.

Active Resident Council

Organized group of residents that meets regularly to discuss facility policies, quality of life, and activities.

Quality of care over time

These measures show how residents usually do over time at this home, based on health outcomes and preventive care.

High-risk clinical events score Info A composite score based on pressure ulcers, falls with injury, weight loss, walking ability decline, and activities of daily living decline. 4.1
45% better than Florida average

Florida average: 7.4

Functional decline score Info A composite score based on activities of daily living decline, walking ability decline, and incontinence. 9.2
26% better than Florida average

Florida average: 12.4

Long-stay resident measures
Significantly above average Florida avg: 4.6 Info CMS star rating based on long-stay quality measure performance. 5 stars = significantly above average, 1 star = significantly below average.
Need for Help with Daily Activities Increased Info Percent of long-stay residents whose need for help with daily activities has increased 3.3%
69% better than Florida average

Florida average: 10.5%

Walking Ability Worsened Info Percent of long-stay residents whose ability to move independently worsened 7.1%
46% better than Florida average

Florida average: 12.9%

Low Risk Residents with Bowel/Bladder Incontinence Info Percent of low risk long-stay residents who lose control of their bowels or bladder 17.3%
28% worse than Florida average

Florida average: 13.5%

Falls with Major Injury Info Percent of long-stay residents experiencing one or more falls with major injury 2.6%
In line with Florida average

Florida average: 2.6%

High Risk Residents with Pressure Ulcers Info Percent of long-stay high risk residents with pressure ulcers 2.8%
47% better than Florida average

Florida average: 5.4%

Urinary Tract Infection Info Percent of long-stay residents with a urinary tract infection 0.0%
100% better than Florida average

Florida average: 0.9%

Lost Too Much Weight Info Percent of long-stay residents who lose too much weight 4.7%
21% better than Florida average

Florida average: 6.0%

Depressive Symptoms Info Percent of long-stay residents who have depressive symptoms 6.8%
103% worse than Florida average

Florida average: 3.3%

Antipsychotic Use Info Percent of long-stay residents who received an antipsychotic medication 6.5%
19% better than Florida average

Florida average: 8.0%

Pneumococcal Vaccine Info Percent of long-stay residents assessed and appropriately given the pneumococcal vaccine 100.0%
In line with Florida average

Florida average: 97.7%

Influenza Vaccine Info Percent of long-stay residents assessed and appropriately given the seasonal influenza vaccine 100.0%
In line with Florida average

Florida average: 99.2%

Hospitalizations per 1,000 days Info Number of hospitalizations per 1,000 long-stay resident days. 2.04
In line with Florida average

Florida average: 2.10

ED visits per 1,000 days Info Number of outpatient emergency department visits per 1,000 long-stay resident days. 2.79
136% worse than Florida average

Florida average: 1.18

Short-stay resident measures
Above average Florida avg: 2.9 Info CMS star rating based on short-stay quality measure performance. 5 stars = much above average, 1 star = much below average.
Pneumococcal Vaccine Info Percent of short-stay residents assessed and appropriately given the pneumococcal vaccine 99.4%
6% better than Florida average

Florida average: 94.0%

Antipsychotic medication increase Info Percent of short-stay residents who newly received an antipsychotic medication 0.7%
54% better than Florida average

Florida average: 1.5%

Influenza Vaccine Info Percent of short-stay residents assessed and appropriately given the seasonal influenza vaccine 100.0%
6% better than Florida average

Florida average: 94.7%

Re-hospitalized after SNF stay Info Percentage of short-stay residents who were re-hospitalized after their nursing home admission. 26.7%
In line with Florida average

Florida average: 26.2%

Emergency department visits Info Percentage of short-stay residents who had an outpatient emergency department visit. 14.1%
52% worse than Florida average

Florida average: 9.3%

Falls with major injury Info Percentage of SNF residents who experience falls with major injury during their stay. 1.9%
147% worse than Florida average

Florida average: 0.8%

Ability to care for self at discharge Info Percentage of residents at or above expected ability to care for themselves at discharge. 86.0%
60% better than Florida average

Florida average: 53.7%

Successful return to home or community Info Rate of successful return to home or community from a skilled nursing facility. 54.7%
8% better than Florida average

Florida average: 50.6%

Guides for Better Senior Living

Care Cost Calculator: See Prices in Your Area

Nursing Home Data Explorer

Don’t Wait Too Long: 7 Red Flag Signs Your Parent Needs Assisted Living Now

The True Cost of Assisted Living in 2025 – And How Families Are Paying For It

Understanding Senior Living Costs: Pricing Models, Discounts & Financial Assistance

Financial Aid for Florida Seniors

Get financial aid guidance

Long-Term Care Waiver

Florida Medicaid LTC Waiver

Age 65+ or 21+ disabled, Florida resident, Medicaid- eligible, nursing home-level care need.

~$2,829/month (300% FBR, individual).

$2,000 (individual), $3,000 (couple).

High demand; waitlists common.

Community Care for the Elderly (CCE)

Florida CCE

Age 60+, Florida resident, at risk of nursing home.

~$2,000/month (varies).

$5,000 (individual).

Limited funding; regional variation.

Home Care for the Elderly (HCE)

Florida Home Care for the Elderly

Age 60+, Florida resident, at risk of nursing home placement; caregiver must be approved.

~$2,829/month (individual, aligned with Medicaid thresholds).

~$2,000 (individual); varies by case manager discretion.

Limited funding (~3,500 served annually); prioritizes low-income frail seniors.

Program of All-Inclusive Care for the Elderly (PACE)

Florida Medicaid PACE

Age 55+, Florida resident, nursing home-level care need, safe with PACE support.

~$2,829/month (300% FBR).

$2,000 (individual), $3,000 (couple).

Limited to specific counties (e.g., Hillsborough, Miami-Dade); ~10 sites statewide.

Optional State Supplementation (OSS)

Florida Optional State Supplementation

Age 65+ or disabled, Florida resident, living in approved facility, receiving SSI or low-income.

~$1,004/month (individual, including SSI).

$2,000 (individual), $3,000 (couple).

Limited to specific facility types; ~$78.40/month max supplement.

Senior Community Service Employment Program (SCSEP)

Florida SCSEP (federally funded, state-administered)

Age 55+, unemployed, low-income, Florida resident.

~$1,983/month (125% FPL, individual).

Not specified; income-focused.

Priority for veterans, rural residents; ~1,000 slots/year.

Tour Icon
Planning a tour? Check our touring checklist.
Chat Icon
Thinking of living here? We can help you speak to a current resident