Coral Bay at Pensacola
Nursing Home · Pensacola, FL
CMS overall rating Info The Overall CMS Rating is scored from 1 to 5 stars and combines results from health inspections, staffing levels, and quality measures. Health inspections carry the most weight. Staffing and quality scores can increase or decrease the final rating based on performance compared to state and national standards.

Coral Bay at Pensacola

Nursing Home · Pensacola, FL
CMS overall rating Info The Overall CMS Rating is scored from 1 to 5 stars and combines results from health inspections, staffing levels, and quality measures. Health inspections carry the most weight. Staffing and quality scores can increase or decrease the final rating based on performance compared to state and national standards.
Calculator: See prices in your area
Coral Bay at Pensacola accepts Medicare, Medicaid, and private pay.

Overview of Coral Bay at Pensacola

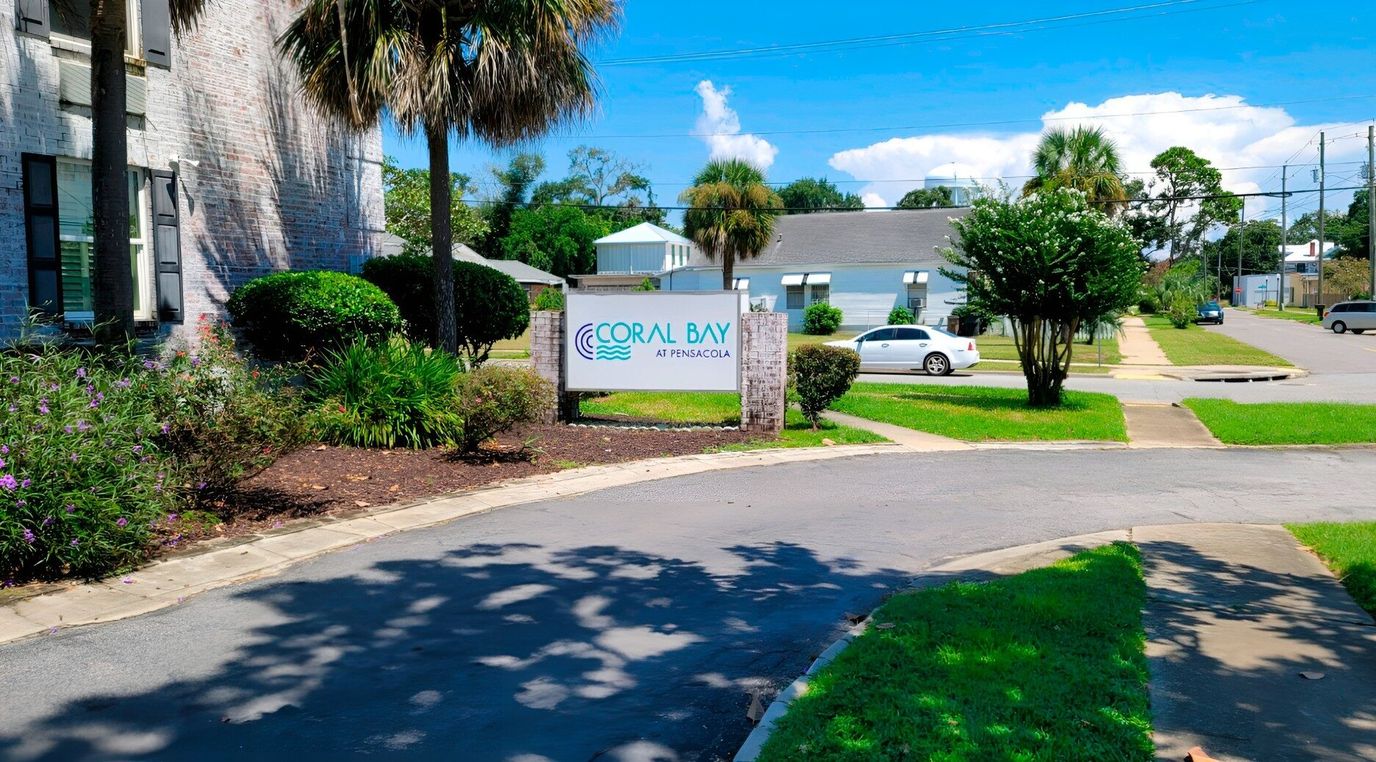
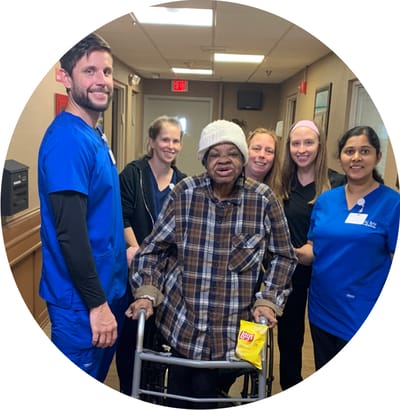
Coral Bay at Pensacola is a nursing home in Pensacola, FL, offering long-term care, memory care, rehabilitation, and respite care. Promoting a comfortable and nurturing environment, the community ensures older adults are well-cared for. Housekeeping, laundry, five-star dining, and social services are among the exceptional services provided to enrich residents’ living experiences. Along with a well-trained care team, personalized care plans are also provided to help them recover and return to their routines.

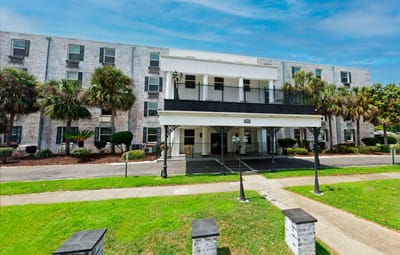
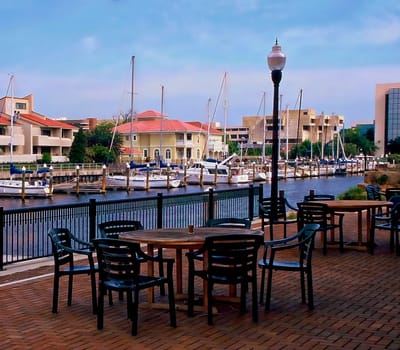
Art classes, local trips, and game nights provide residents with more opportunities to explore interests and live actively. Cozy lounges, a barber/beauty shop, and an outdoor courtyard are among the top-notch amenities that foster interactions and relaxation. Situated near restaurants, shops, and public transportation in the quiet residential area of Pensacola, the community guarantees accessibility and convenience. This nursing home ensures older adults live to their potential, making it one of the best choices for senior living in Florida.

(850) 434-8071

Quality ratings

Measured by Centers for Medicare & Medicaid Services (CMS)

Overall rating Info The Overall CMS Rating combines results from health inspections, staffing levels and quality measures. Health inspections carry the most weight. Staffing and quality scores can increase or decrease the final rating based on performance compared to state and national standards.
▲ 26.0% Above FL avg. ▲ 26.0% Above FL avg.Click the badge to see the full State ranking.Click here to see the full State ranking.
Health Inspection Info Based on the results of the facility's three most recent standard inspections and any complaint investigations. CMS reviews the number, scope, and severity of deficiencies, with more recent findings weighted more heavily.
▲ 42.3% Above FL avg. ▲ 42.3% Above FL avg.Click the badge to see the full State ranking.Click here to see the full State ranking.
Staffing Info Measures average nursing staff hours per resident per day, including Registered Nurses (RNs) and total nursing staff. Ratings are adjusted based on the level of care residents require and are compared to state and national benchmarks.
▲ 18.2% Above FL avg. ▲ 18.2% Above FL avg.Click the badge to see the full State ranking.Click here to see the full State ranking.
Quality Measures Info Based on clinical and physical health indicators reported to CMS, such as hospital readmissions, falls, pressure ulcers, and improvements in mobility. These measures reflect how well residents' health needs are being managed.
▼ 26.1% Below FL avg. ▼ 26.1% Below FL avg.Click the badge to see the full State ranking.Click here to see the full State ranking.

Staffing hours breakdown

Info Daily nursing hours per resident by staff type, reported to CMS. Higher is generally better — compare this facility to state and national averages to see where staffing stands.

Hours per resident per day — compared to Florida state averages

Total nursing care / resident Info This home is ranked 74th out of 252 homes in Florida. Total adjusted nursing hours per resident per day, combining RN, LPN, and aide time. CMS adjusts this for case-mix so facilities can be fairly compared.
4h 13m per day
Rank #74 / 252Nurse hours — State benchmarkedThis home is ranked 74th out of 252 homes in Florida. Shows adjusted nurse hours per resident per day benchmarked to the Florida average, with a ranking across 252 Florida SNFs. More hours mean more direct care. The national average is about 3.5 hrs; below 3.0 is a red flag.Click the rank badge to see the full State ranking.Click here to see the full State ranking.
This facility Florida avg (4h 2m per day)
vs Florida avg
+4%
Staff typeHours / Day / Residentvs state avg
Weekend Total Nursing Info Combined nursing hours (RN + LPN + Nurse Aide) per resident per day on weekends. Staffing often drops on weekends — this figure reveals whether the facility maintains adequate coverage outside of weekday hours. 3h 7m per day

Types of Care at Coral Bay at Pensacola

Nursing Home

Capacity and availability

This home usually has limited availability

Occupancy between 85% and 95% suggests balanced demand.

Higher occupancy than the Florida average: 84.3%
Occupancy rate 91.1% Rank #96 / 255Occupancy rate — State benchmarkedThis home is ranked 96th out of 255 homes in Florida. Shows this facility's occupancy rate versus the Florida average, with its Statewide rank out of 255. Higher occupancy signals strong local demand and financial stability.Click the rank badge to see the full State ranking.Click here to see the full State ranking.
Avg. Length of Stay 277 days
Occupancy rate
91.1% Rank #96 / 255Occupancy rate — State benchmarkedThis home is ranked 96th out of 255 homes in Florida. Shows this facility's occupancy rate versus the Florida average, with its Statewide rank out of 255. Higher occupancy signals strong local demand and financial stability.Click the rank badge to see the full State ranking.Click here to see the full State ranking.
Avg. Length of Stay
277 days
Walk Score
Walk Score: 75 / 100 Rank #150 / 1486Walk Score — State benchmarkedThis home is ranked 150th out of 1486 homes in Florida. Shows how walkable this facility's neighborhood is compared to the average Walk Score across Florida SNFs. Higher scores benefit residents, families, and staff.Click the rank badge to see the full State ranking.Click here to see the full State ranking.
Very walkable. Most errands can be accomplished on foot, and many essentials are within a short walk.

Contact Coral Bay at Pensacola

Staffing Data

Reporting period: October 1 – December 31, 2025 (Q4 2025). Source: CMS Payroll-Based Journal report.

Total staff 205
Employees 180
Contractors 25
Staff to resident ratio 1.07:1
27% worse than Florida average
Florida average ratio: 1.47:1 Florida average ratio: 1.47:1See full Florida ranking
Avg staff/day 92
Average shift 8.2 hours
0% compared with Florida average
Florida average: 7.9 hours Florida average shift: 7.9 hoursSee full Florida ranking
Total staff hours (quarter) 69,004

Nursing staff breakdown

Q4 2025 · Oct 1 – Dec 31 More info This data comes from the CMS Payroll-Based Journal report covering October 1 – December 31, 2025.
Registered Nurse

Manages medical care and health needs.

RN Staff 20
Average shift length Info Average shift length. Calculated as total hours divided by days worked and average staff per day. 8 hours

No contractors work on this role.

Licensed Practical Nurse

Assists with medical care and medications.

LPN Staff 47
Average shift length Info Average shift length. Calculated as total hours divided by days worked and average staff per day. 8.5 hours

This role is partially covered by contractors.

Certified Nursing Assistant

Helps with daily care and mobility.

CNA Staff 107
Average shift length Info Average shift length. Calculated as total hours divided by days worked and average staff per day. 8.3 hours

No contractors work on this role.

Contractor staffing

Q4 2025 · Oct 1 – Dec 31 More info This data comes from the CMS Payroll-Based Journal report covering October 1 – December 31, 2025.

Total hours from contractors

7.4%

5,121 contractor hours this quarter

Licensed Practical Nurse: 6 Speech Language Pathologist: 5 Respiratory Therapy Technician: 5 Physical Therapy Assistant: 3 Qualified Social Worker: 3 Physical Therapy Aide: 3

Staff by category

Q4 2025 · Oct 1 – Dec 31 More info This data comes from the CMS Payroll-Based Journal report covering October 1 – December 31, 2025.
Certified Nursing Assistant107010739,27692100%8.3
Licensed Practical Nurse4164713,29092100%8.5
Registered Nurse200206,51792100%8
Clinical Nurse Specialist4041,9517986%7.7
RN Director of Nursing3031,5748289%7.6
Physical Therapy Aide0331,0637076%6.7
Speech Language Pathologist0551,0327885%6.9
Mental Health Service Worker2029526470%8
Physical Therapy Assistant0337357076%6.7
Qualified Social Worker0335416672%5.7
Administrator1015286672%8
Nurse Practitioner1015286672%8
Dietitian1015217278%7.2
Respiratory Therapy Technician0554966874%6.3
107 Certified Nursing Assistant
% of Days 100%
47 Licensed Practical Nurse
% of Days 100%
20 Registered Nurse
% of Days 100%
4 Clinical Nurse Specialist
% of Days 86%
3 RN Director of Nursing
% of Days 89%
3 Physical Therapy Aide
% of Days 76%
5 Speech Language Pathologist
% of Days 85%
2 Mental Health Service Worker
% of Days 70%
3 Physical Therapy Assistant
% of Days 76%
3 Qualified Social Worker
% of Days 72%
1 Administrator
% of Days 72%
1 Nurse Practitioner
% of Days 72%
1 Dietitian
% of Days 78%
5 Respiratory Therapy Technician
% of Days 74%

Penalties and fines

Federal penalties imposed by CMS for regulatory violations, including civil money penalties (fines) and denials of payment for new Medicare/Medicaid admissions.

Source: CMS Penalties Database

No penalties in the past 3 years

No civil money penalties or payment denials were reported in the last 3 years.

Quality of care over time

These measures show how residents usually do over time at this home, based on health outcomes and preventive care.

High-risk clinical events score Info A composite score based on pressure ulcers, falls with injury, weight loss, walking ability decline, and activities of daily living decline. 7.1
In line with Florida average

Florida average: 7.4

Functional decline score Info A composite score based on activities of daily living decline, walking ability decline, and incontinence. 11.4
8% better than Florida average

Florida average: 12.4

Long-stay resident measures
Need for Help with Daily Activities Increased Info Percent of long-stay residents whose need for help with daily activities has increased 8.4%
20% better than Florida average

Florida average: 10.5%

Walking Ability Worsened Info Percent of long-stay residents whose ability to move independently worsened 7.3%
44% better than Florida average

Florida average: 12.9%

Low Risk Residents with Bowel/Bladder Incontinence Info Percent of low risk long-stay residents who lose control of their bowels or bladder 18.5%
37% worse than Florida average

Florida average: 13.5%

Falls with Major Injury Info Percent of long-stay residents experiencing one or more falls with major injury 3.8%
44% worse than Florida average

Florida average: 2.6%

High Risk Residents with Pressure Ulcers Info Percent of long-stay high risk residents with pressure ulcers 6.1%
13% worse than Florida average

Florida average: 5.4%

Urinary Tract Infection Info Percent of long-stay residents with a urinary tract infection 0.0%
100% better than Florida average

Florida average: 0.9%

Lost Too Much Weight Info Percent of long-stay residents who lose too much weight 9.7%
63% worse than Florida average

Florida average: 6.0%

Depressive Symptoms Info Percent of long-stay residents who have depressive symptoms 24.5%
632% worse than Florida average

Florida average: 3.3%

Antipsychotic Use Info Percent of long-stay residents who received an antipsychotic medication 3.1%
62% better than Florida average

Florida average: 8.0%

Pneumococcal Vaccine Info Percent of long-stay residents assessed and appropriately given the pneumococcal vaccine 100.0%
In line with Florida average

Florida average: 97.7%

Influenza Vaccine Info Percent of long-stay residents assessed and appropriately given the seasonal influenza vaccine 100.0%
In line with Florida average

Florida average: 99.2%

Short-stay resident measures
Pneumococcal Vaccine Info Percent of short-stay residents assessed and appropriately given the pneumococcal vaccine 100.0%
6% better than Florida average

Florida average: 94.0%

Antipsychotic medication increase Info Percent of short-stay residents who newly received an antipsychotic medication 3.5%
134% worse than Florida average

Florida average: 1.5%

Influenza Vaccine Info Percent of short-stay residents assessed and appropriately given the seasonal influenza vaccine 100.0%
6% better than Florida average

Florida average: 94.7%

Breakdown by payment type

Medicare

35% of new residents, usually for short-term rehab.

Typical stay 2 - 3 months

Private pay

55% of new residents, often for short stays.

Typical stay 1 - 2 months

Medicaid

10% of new residents, often for long-term daily care.

Typical stay 5 years

Facility Characteristics

Source: CMS Long-Term Care Facility Characteristics (Data as of Jan 2026)

Total residents 192
Medicare
17
8.9% of residents
Medicaid
162
84.4% of residents
Private pay or other
13
6.8% of residents
Programs & Services
Residents Group

Residents meet regularly to discuss policies, care quality, and activities

Active Resident Council

Organized group of residents that meets regularly to discuss facility policies, quality of life, and activities.

Finances and operations

Privately-owned community
Operated by a business corporation.
Home revenue
$26.5M
Operating loss
-$801.4K
Privately-owned community Operated by a business corporation.
Home revenue
$26.5M Rank #59 / 256Revenue — State benchmarkedThis home is ranked 59th out of 256 homes in Florida. Shows this facility's annual revenue compared to the Florida SNF average. Higher revenue generally means more resources for staffing and capital — read alongside Payroll %.Click the rank badge to see the full State ranking.Click here to see the full State ranking.
Operating loss
-$801.4K
Payroll costs Info The portion of the home's budget spent on staff, including nurses, caregivers, and other employees who support care and operations. Rank #73 / 256Payroll — State benchmarkedThis home is ranked 73rd out of 256 homes in Florida. Shows total annual staff payroll benchmarked to the Florida average. Higher payroll investment relative to peers often signals better staffing and less reliance on cheaper contract labor.Click the rank badge to see the full State ranking.Click here to see the full State ranking.
$10.0M
37.8% of revenue Rank #189 / 256Payroll % — State benchmarkedThis home is ranked 189th out of 256 homes in Florida. Shows payroll as a percentage of revenue versus the Florida average. Well-run Florida SNFs typically land around 49–56% — the top third Statewide. Below 25% may signal understaffing or heavy agency use — read with Staffing ratings.Click the rank badge to see the full State ranking.Click here to see the full State ranking.
Other operating costs Info All remaining costs needed to run the home, such as food, utilities, building maintenance, supplies and administrative expenses.
$17.3M
Total costs $27.3M

What does this home offer?

Building type icon
Building type icon

Building Type: Mid-rise

Dining services icon

Dining Services

Beauty services icon

Beauty Services

Transportation services icon

Transportation Services

Housekeeping icon
Housekeeping icon

Housekeeping Services

Social and recreational activities icon

Social and Recreational Activities

On-site medical care and health services icon

On-site Medical Care and Health Services

Rehabilitative support icon

Rehabilitative Support

Who this home usually serves

TYPE OF STAY

Mix of rehab and long-term care

This home supports both short-term rehab and long-term care, with residents staying for a wide range of durations.

Places of interest near Coral Bay at Pensacola

Address 0.7 miles from city center Info Estimated distance in miles from Pensacola's city center to Coral Bay at Pensacola's address, calculated via Google Maps.

Calculate Travel Distance to Coral Bay at Pensacola

Add your location

Address

Financial Assistance for
Nursing Home in Florida

Coral Bay at Pensacola is located in Pensacola, Florida.
Here are the financial assistance programs available to residents in Florida.

Get Financial aid guidance

Long-Term Care Waiver

Florida Medicaid LTC Waiver

Age 65+ or 21+ disabled
General Florida resident, Medicaid- eligible, nursing home-level care need.
Income Limits (2025) ~$2,829/month 300% FBR, individual
Asset Limits $2,000 (individual), $3,000 (couple).
FL

High demand; waitlists common.

Benefits
In-home care (6-8 hours/day) Assisted living Respite (240 hours/year) Case management

Community Care for the Elderly (CCE)

Florida CCE

Age 60+
General Florida resident, at risk of nursing home.
Income Limits ~$2,000/month varies
Asset Limits $5,000 individual
FL

Limited funding; regional variation.

Benefits
Homemaker services (3-5 hours/week) Adult day care (~$60/day) Respite (up to 10 days/year)

Home Care for the Elderly (HCE)

Florida Home Care for the Elderly

Age 60+
General Florida resident, at risk of nursing home placement; caregiver must be approved.
Income Limits (2025) ~$2,829/month individual, aligned with Medicaid thresholds
Asset Limits ~$2,000 (individual); varies by case manager discretion.
FL

Limited funding (~3,500 served annually); prioritizes low-income frail seniors.

Benefits
Basic subsidy (~$160/month) for housing/medical costs; special subsidies for supplies/services (e.g., incontinence supplies, ~$50-$200/month)

Program of All-Inclusive Care for the Elderly (PACE)

Florida Medicaid PACE

Age 55+
General Florida resident, nursing home-level care need, safe with PACE support.
Income Limits (2025) ~$2,829/month 300% FBR
Asset Limits $2,000 (individual), $3,000 (couple).
FL

Limited to specific counties (e.g., Hillsborough, Miami-Dade); ~10 sites statewide.

Benefits
Personal care (5-7 hours/day) Medical care Meals Transportation Therapy

Optional State Supplementation (OSS)

Florida Optional State Supplementation

Age 65+ or disabled
General Florida resident, living in approved facility, receiving SSI or low-income.
Income Limits (2025) ~$1,004/month individual, including SSI
Asset Limits $2,000 (individual), $3,000 (couple).
FL

Limited to specific facility types; ~$78.40/month max supplement.

Benefits
Cash payment (~$78.40/month) for room/board or personal needs in facilities

Compare Nursing Home around Pensacola

The information below is reported by the Florida Agency for Health Care Administration (AHCA).

3 facilities compared · CMS & FL Dept. of Health data

Filter by care type
Life Care Center of Pensacola
NH

Nursing Home Licensed facility providing 24/7 skilled nursing care for residents with complex, ongoing medical needs. Staffed by RNs, LPNs, and CNAs. Inspected and star-rated annually by CMS. Accepts Medicare (short-term rehab) and Medicaid (long-term care).

Pensacola (Northeast Pensacola)120 94.7% +12%3.80 -1%-6%$031.0-112A+ 41 Jennifer Lindley$21.6M$8.6M40%106073
Coral Bay at Pensacola
NH

Nursing Home Licensed facility providing 24/7 skilled nursing care for residents with complex, ongoing medical needs. Staffed by RNs, LPNs, and CNAs. Inspected and star-rated annually by CMS. Accepts Medicare (short-term rehab) and Medicaid (long-term care).

Pensacola210 91.1% +8%4.22 -19%+4%$0132.6-196- 75 Coral Bay Holdings LLC$26.5M$10.0M37.8%106051
Solaris HealthCare Pensacola
NH

Nursing Home Licensed facility providing 24/7 skilled nursing care for residents with complex, ongoing medical needs. Staffed by RNs, LPNs, and CNAs. Inspected and star-rated annually by CMS. Accepts Medicare (short-term rehab) and Medicaid (long-term care).

Pensacola180 91.2% +8%3.58 +27%-11%$9.3k94.51166- 39 Pensacola Healthcare Holdings, LLC$22.9M$10.6M46.3%105561

Frequently Asked Questions about Coral Bay at Pensacola

Is Coral Bay at Pensacola in a walkable area?

Coral Bay at Pensacola has a walk score of 75. Very walkable. Most errands can be accomplished on foot, and many essentials are within a short walk.

What is the occupancy rate at Coral Bay at Pensacola?

Coral Bay at Pensacola's occupancy is 91.1%.

What is the address of Coral Bay at Pensacola?

Coral Bay at Pensacola is located at 600 W Gregory St, Pensacola, FL 32502.

What is the phone number of Coral Bay at Pensacola?

(850) 434-8071 will put you in contact with the team at Coral Bay at Pensacola.

Is Coral Bay at Pensacola Medicare or Medicaid certified?

Yes — Coral Bay at Pensacola is a CMS-certified provider of Medicare and Medicaid.

Guides for Better Senior Living

Care Cost Calculator: See Prices in Your Area

Nursing Home Data Explorer

Don’t Wait Too Long: 7 Red Flag Signs Your Parent Needs Assisted Living Now

The True Cost of Assisted Living in 2025 – And How Families Are Paying For It

Understanding Senior Living Costs: Pricing Models, Discounts & Financial Assistance

Explore Open Rooms
1 Contact details
2 What type of senior care service are you looking for?
3 What budget do you have in mind for senior care?
4 How soon do you need to find care?
5 Additional details

Thank you for your interest!

Our team will be in touch shortly to help with next steps.