Life Care Center of Red Bank

Nursing Home
Overview of Life Care Center of Red Bank

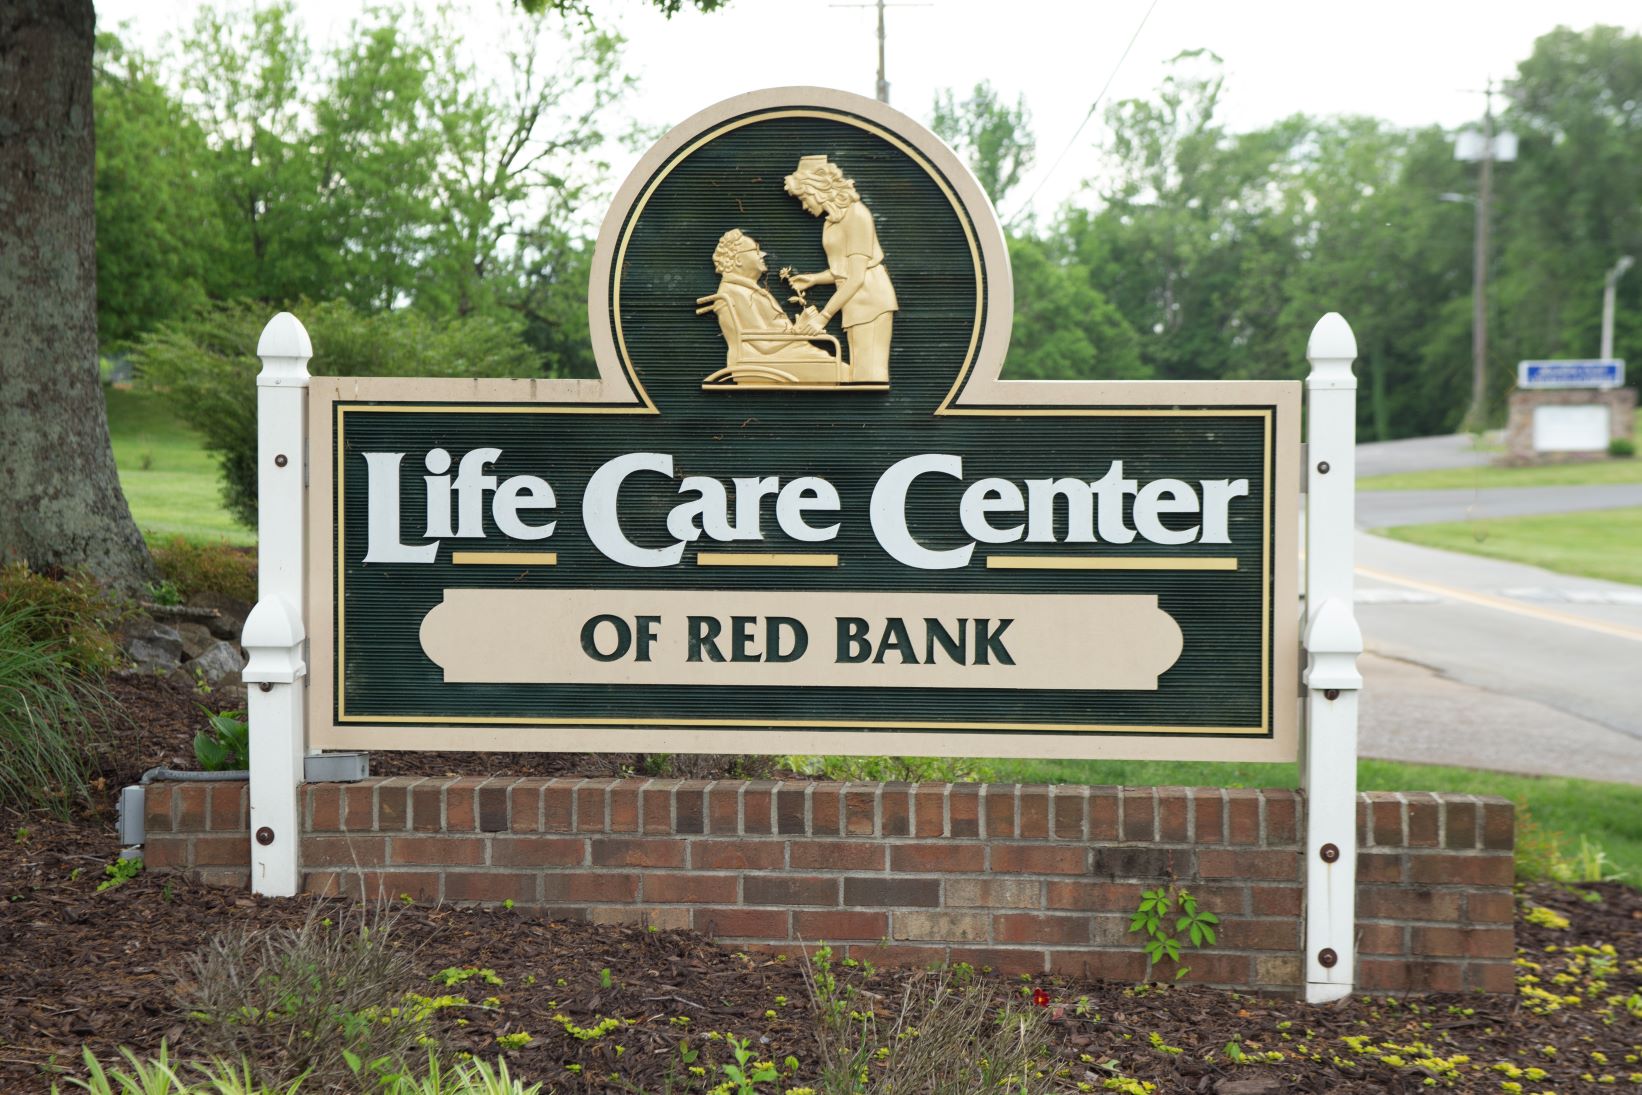
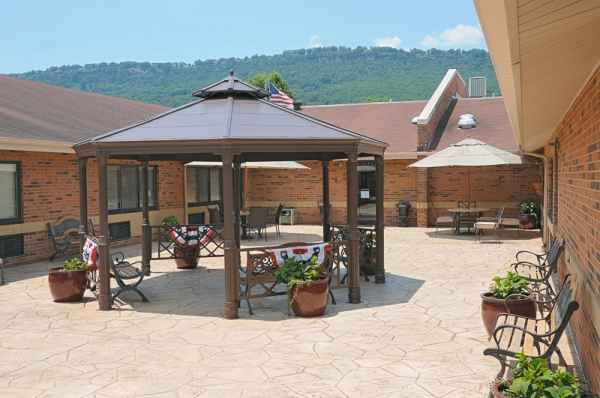
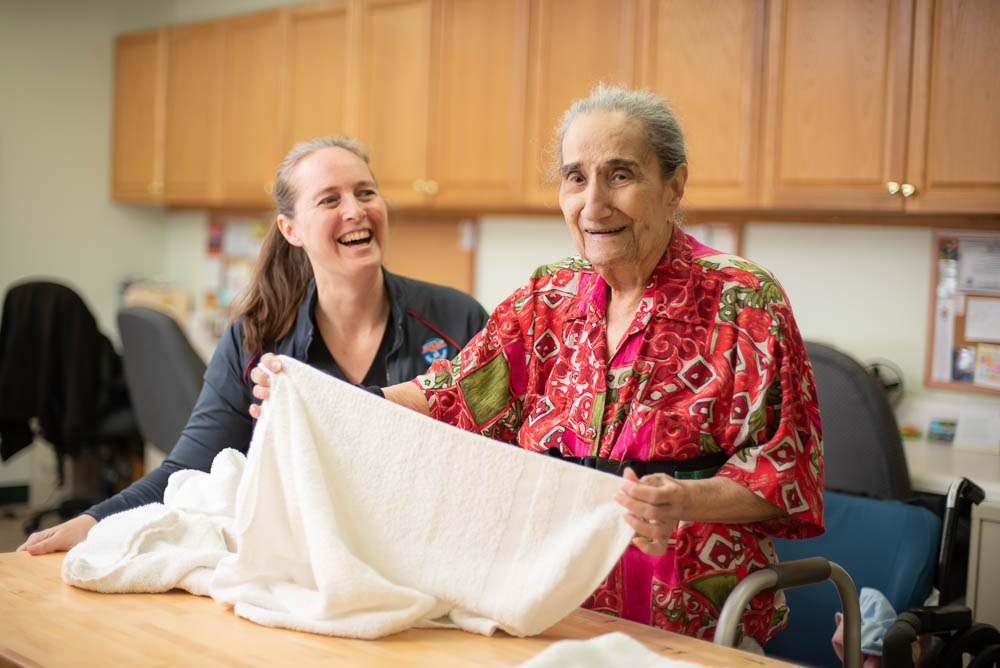
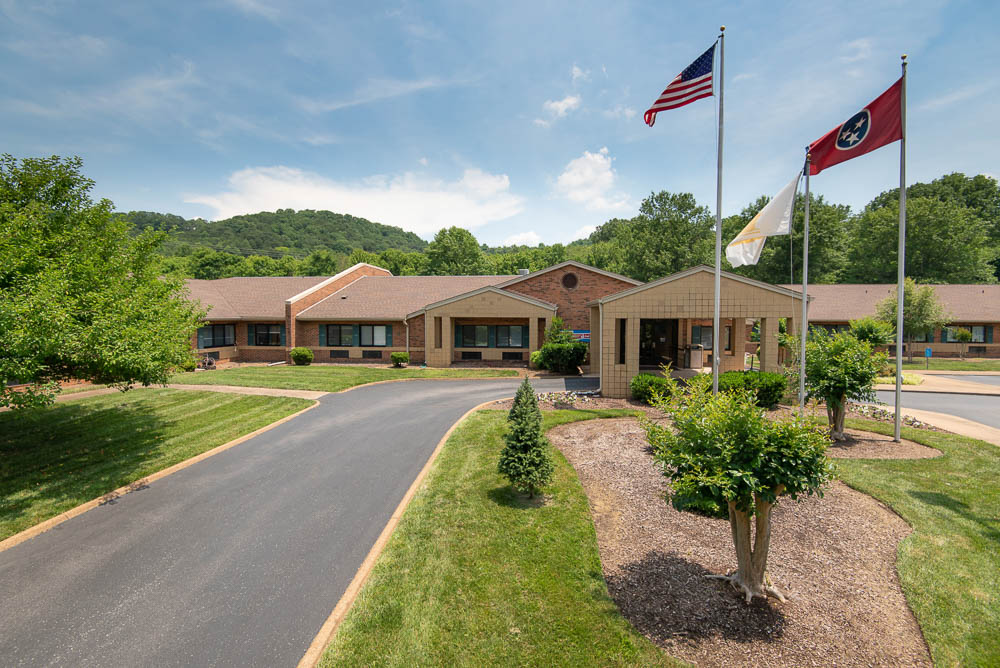
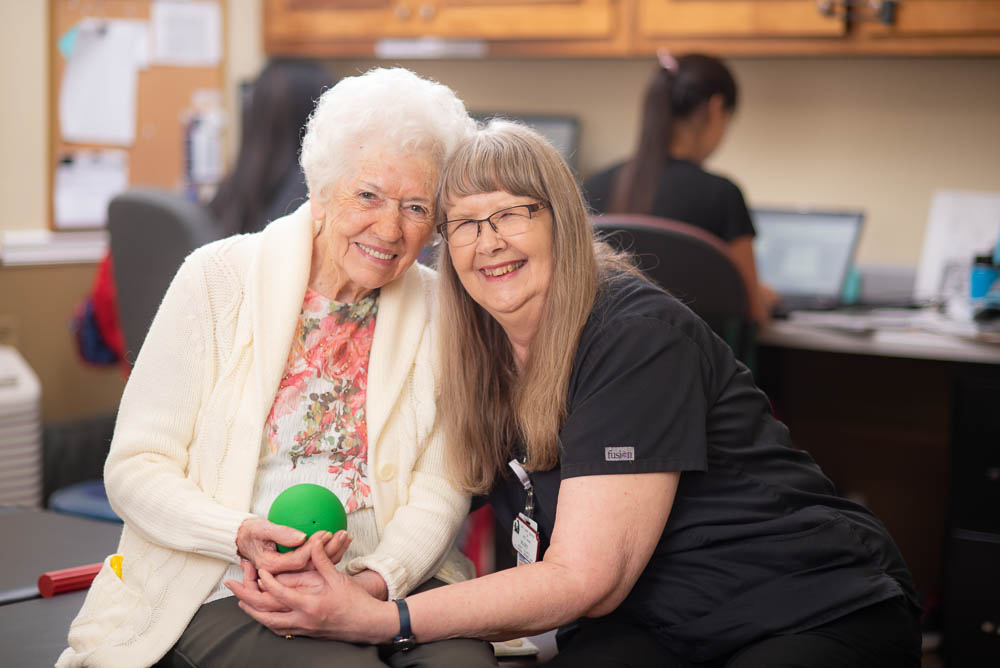
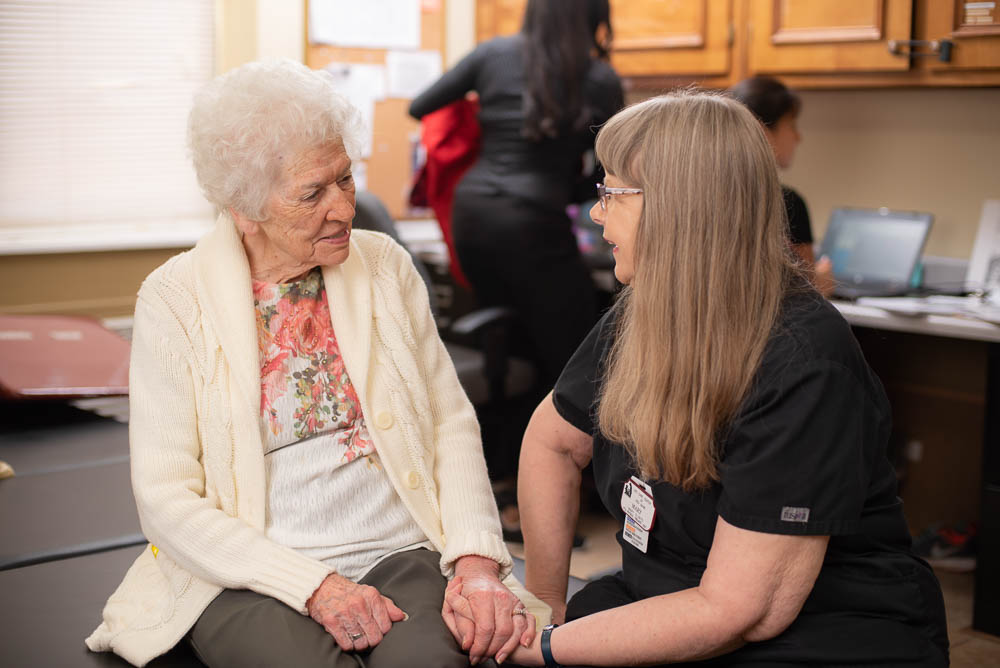
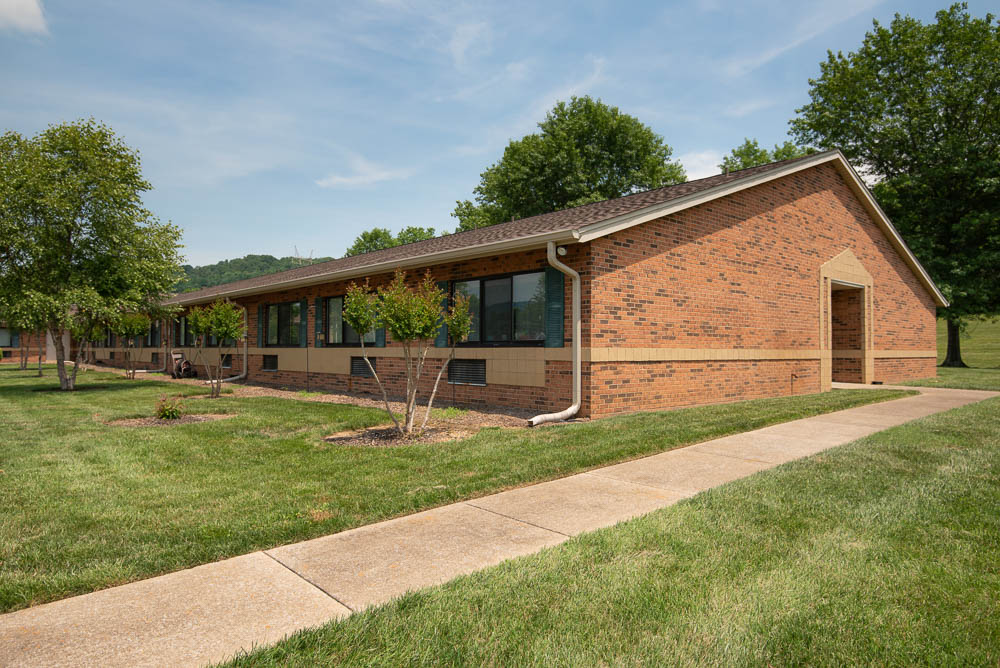
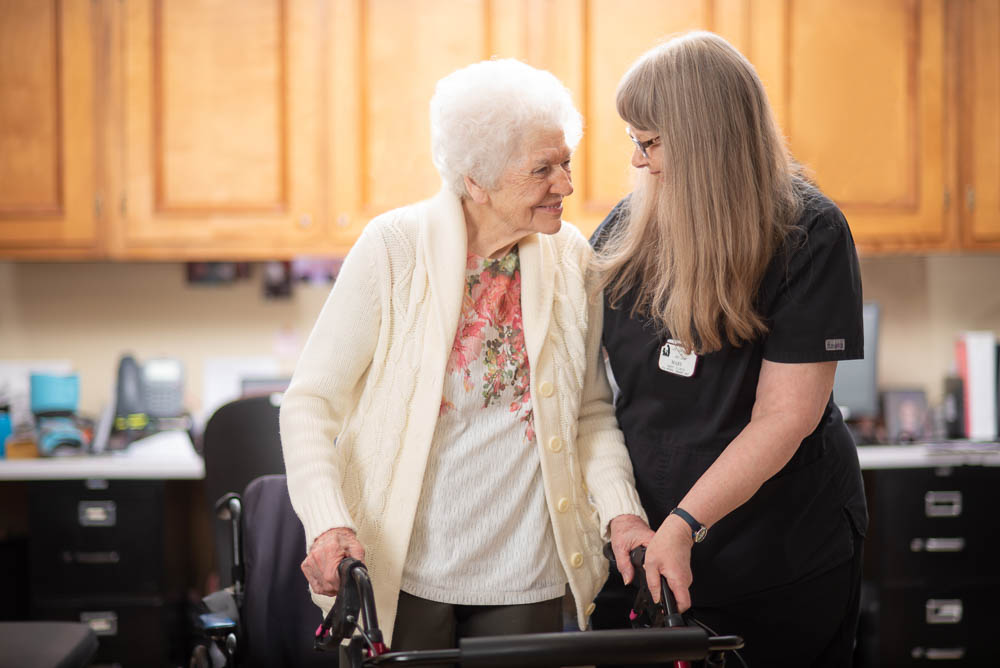
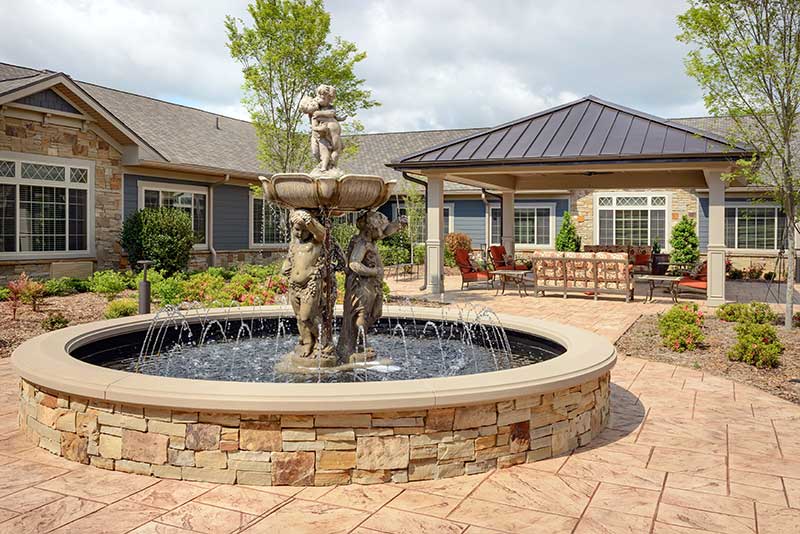
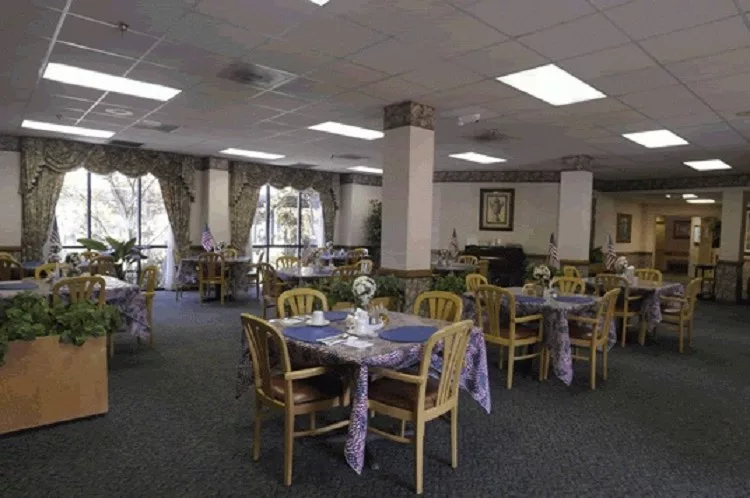
Life Care Center of Red Bank is a skilled nursing and rehabilitation center. The upscale nursing home aims to change the meaning of skilled nursing and rehabilitation for seniors through the exceptional care delivered by their patient-friendly staff to offer the best care possible for their residents. Life Care Center can be trusted as a safe and secure community that cares for every patient’s needs.
Convenience and hassle-free living are the center of Life Care Center services: medication management, post-surgical care, and wound care. Their 24-hour skilled nursing care services provide compassionate care as their utmost priority. Other benefits include 24/7 easy admissions, fall prevention, IV therapy, discharge planning, and case management.

(423) 877-1155

Quality ratings

Measured by Centers for Medicare & Medicaid Services (CMS)

Overall rating Info Official CMS rating based on health inspections, staffing and quality measures.
3/5
Tennessee average: 2.8/5
Health Inspection Info Official CMS rating based on deficiencies found during state health inspections.
2/5
Tennessee average: 2.8/5
Staffing Info Official CMS rating based on nurse staffing hours per resident per day.
2/5
Tennessee average: 2.4/5
Quality Measures Info Official CMS rating based on clinical outcomes for residents.
5/5
Tennessee average: 3.4/5

Nursing care per resident

Info Average daily nursing hours per resident (adjusted for acuity). Higher values indicate more nursing time per resident.
3h 27m per day

This home provides 5% less nursing time per resident than the state average.

Tennessee average: 3h 38m per day

Staffing hours breakdown

Info Hours of care per resident per day, broken down by staff type. Data from CMS Medicare.
Staff type Facility State avg National avg
Registered Nurse (RN) Info Registered nurse hours per resident per day. 32m per day 37m per day 41m per day
LPN / LVN Info Licensed Practical Nurse / Licensed Vocational Nurse hours per resident per day. 56m per day 1h 6m per day 52m per day
Nurse Aide Info Nurse aide hours per resident per day. 2h 0m per day 2h 9m per day 2h 21m per day
Total Nursing (Weekend) Info Total number of nurse staff hours per resident per day on weekends. 3h 5m per day 3h 21m per day 3h 26m per day
Physical Therapist Info Physical therapist staff hours per resident per day. 5m per day 5m per day 4m per day
RN (Weekend) Info Registered nurse hours per resident per day on weekends. 18m per day 25m per day 29m per day

Capacity and availability

Smaller home

May offer a more intimate, personalized care environment.

Total beds 54

This home usually has availability

Lower occupancy suggests more openings may be available.

Lower demand than the Tennessee average
Occupancy rate 64%
Residents per day (avg) 83
Occupancy rate
64%
Residents per day (avg)
83

Who this home usually serves

TYPE OF STAY

Mix of rehab and long-term care

This home supports both short-term rehab and long-term care, with residents staying for a wide range of durations.

Breakdown by payment type

Medicare

26% of new residents, usually for short-term rehab.

Typical stay 28 days

Private pay

54% of new residents, often for short stays.

Typical stay 1 - 2 months

Medicaid

20% of new residents, often for long-term daily care.

Typical stay 7 - 8 months

Finances and operations

Proprietary home
Other
Home revenue
$14.0M
Profit
$357.8K
Proprietary home Other
Home revenue
$13,976,088.00
Profit
$357,849.00
Payroll costs Info The portion of the home's budget spent on staff, including nurses, caregivers, and other employees who support care and operations.
$5.7M
41% of revenue
Other operating costs Info All remaining costs needed to run the home, such as food, utilities, building maintenance, supplies and administrative expenses.
$7.9M
Total costs $13.6M
Bed community size
54-bed community
A moderately sized community that may balance personal attention with shared amenities and social activities.
Years in operation
44 years in operation
A longer operating history, which may indicate experience navigating regulations and delivering ongoing care.
Walk Score
Walk Score: 9 / 100
Car-dependent. Most errands require a car, with limited nearby walkable options.
BBB Rating
BBB Rating: A+ (Not Accredited)
An independent rating from the Better Business Bureau based on factors such as complaint history, transparency, and business practices.
How BBB ratings work

About this community

Occupancy Rate
94%
Occupied Beds
51 of 54
Percentage of available beds currently in use by residents.
License Status
Licensed
Facility Type
Nursing Home
License Date
January 7, 1992
License Expiration
April 3, 2026

Additional licensing details

License number: 00000108
County: Giles

Ownership & operating entity

Life Care Center of Red Bank is legally operated by Red Bank Operations, LLC, and administrated by Emily Boshears.

Staffing

Key information about the people who lead and staff this community.

Leadership

Contact: Ms. Emily Boshears, Director of Administration

Staff Composition

Total Employees
19
Full-Time Employees
19

Care Services

Nursing Services
Rehabilitation Services
Skilled Nursing
Licensed Nurses/CNAs
24-Hour Staffing

All Levels of Care

Skilled Nursing
Rehabilitation

Amenities & Lifestyle

24-hour security and fire safety systems
Beauty salon and barber shop
Bedside and bathroom call lights
Certified dietitian
Community re-entry program
Complimentary wireless Internet
Daily activity schedule
Family/resident councils
Fine dining program
Flat-screen TVs
Flexible visiting hours
Full-time
certified activity director
Homelike setting
Housekeeping and laundry services
Landscaped grounds and courtyards
Library
Non-smoking facility
Pet visitors allowed
Private and semiprivate rooms
Private bathrooms
Religious services
Patient/family education program
Telephone and cable television hookups
Transportation services

Programs & Activities

Specific Programs
Skilled Nursing, Rehabilitation, Alzheimer's & Dementia Care, Independent & Assisted Living
Contact Life Care Center of Red Bank

Residents information

Stay stats

Average length of stay
234 days
Total residents
43
Total admissions (2024)
26
Total discharges (2024)
25

Discharges

  • To hospital 6
  • To Private Residence or Home 1

Demographics

GENDER

  • Female Residents 51.2%
  • Male Residents 48.8%

AGE DISTRIBUTION

  • Under 60 4.7%
  • 60-64 2.3%
  • 65-69 14%
  • 70-74 16.3%
  • 75-79 2.3%
  • 80-84 14%
  • 85-89 11.6%
  • 90 or more 34.9%

ETHNICITY

  • Black Residents 4.7%
  • White Residents 95.3%

Compare Nursing Homes around Chattanooga

The information below is reported by the Tennessee Department of Health, Division of Health Care Facilities.
The Health Center at Standifer Place
SNF

Nursing Home 24/7 care needed

AL

Assisted Living For seniors needing help with daily tasks but not full-time nursing.

Chattanooga
509
No
A+
38
COVENANT HEALTH SERVICES LLC
100.0%
$55,654,488.00
$25,733,336.00
46.2%
364.10
5/5
3.4514
4/5
2/5
5/5
-
16
-
-12%
-5%
+37%
Life Care Center of East Ridge
SNF

Nursing Home 24/7 care needed

AL

Assisted Living For seniors needing help with daily tasks but not full-time nursing.

East Ridge
108
No
-
31
CENTER, PARKER
61.7%
$14,421,760.00
$6,174,676.00
42.8%
82.50
4/5
3.7050
4/5
4/5
4/5
-
15
-
-8%
+2%
-15%
NHC HealthCare Chattanooga
SNF

Nursing Home 24/7 care needed

AL

Assisted Living For seniors needing help with daily tasks but not full-time nursing.

Chattanooga (Glenwood)
200
No
A+
34
RAFFA, ANTHONY J
90.1%
$22,070,542.00
$10,229,144.00
46.3%
181.30
4/5
3.2430
3/5
2/5
5/5
-
10
-
-23%
-11%
+23%
Life Care Center of Red Bank
SNF

Nursing Home 24/7 care needed

AL

Assisted Living For seniors needing help with daily tasks but not full-time nursing.

Chattanooga (Mountain Creek)
148
No
A+
9
BROOM, SHERRY
94.4%
$13,501,873.00
$5,727,862.00
42.4%
83.10
3/5
3.4531
2/5
2/5
5/5
1
27
5
+37%
-5%
+29%
Consulate Health Care of Chattanooga
AL

Assisted Living For seniors needing help with daily tasks but not full-time nursing.

IL

Independent Living For self-sufficient seniors seeking community and minimal assistance.

MC

Memory Care Specialized care for those with Memory Loss, Alzheimer's, or dementia, ensuring safety and support.

SNF

Nursing Homes 24/7 care needed

Chattanooga (East Brainerd)
127
No
-
17
CHATTANOOGA ONE OP HOLDINGS LLC
35.1%
$4,812,407.00
$3,604,257.00
74.9%
63.60
2/5
3.5946
2/5
2/5
4/5
1
23
-
+21%
-1%
-52%

Places of interest near Life Care Center of Red Bank

Address 4.3 miles from city center — 1.4 miles to nearest hospital (Erlanger North Hospital)
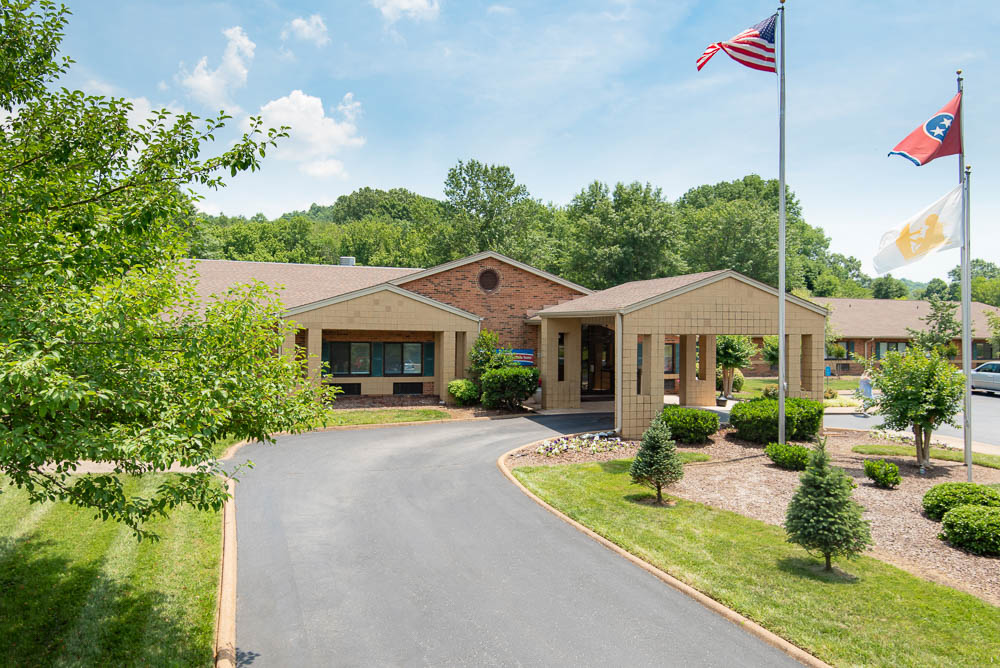
Address 1020 Runyan Dr, Chattanooga, TN 37405

Calculate Travel Distance to Life Care Center of Red Bank

Add your location

Address

Staffing Data

Source: CMS Payroll-Based Journal (Q2 2025)

126
Total Staff
120
Employees
6
Contractors
33,000
Total Hours (Quarter)
44
Avg Staff/Day
8.2
Avg Shift (hrs)
Nursing Staff Breakdown
Role Count Avg Shift (hrs) Uses Contractors?
Registered Nurse158.1 No
Licensed Practical Nurse209.7 No
Certified Nursing Assistant518.5 No
Staff by Category
Administration
2 staff
8.2hs shift avg
Nursing Staff
88 staff
8.7hs shift avg
Physicians & Practitioners
6 staff
7.7hs shift avg
Therapy Services
23 staff
6.5hs shift avg
Activities & Recreation
0 staff
0hs shift avg
Social Services
3 staff
7.4hs shift avg
Dietary Services
2 staff
5.9hs shift avg
Other Services
2 staff
8.2hs shift avg
Contractor Analysis
0.8%
of total hours from contractors
260 contractor hours this quarter
Occupational Therapy Aide: 2 Medical Director: 1 Occupational Therapy Assistant: 3
Role Employees Contractors Total Staff Total Hours Days Worked % of Days Avg Shift (hrs)
Certified Nursing Assistant5105116,29091100%8.5
Licensed Practical Nurse200206,22891100%9.7
Registered Nurse150152,55591100%8.1
Physical Therapy Aide4048856875%6.8
Speech Language Pathologist5058577178%6
Clinical Nurse Specialist5058016369%7.4
Respiratory Therapy Technician6066726673%6.8
Dental Services Staff1015526673%8.4
Physical Therapy Assistant3035446875%6.4
Nurse Practitioner1015306470%8.3
Administrator1015206571%8
RN Director of Nursing2025186369%8.2
Mental Health Service Worker1015036369%8
Qualified Social Worker3034725965%7.4
Other Dietary Services Staff1014607481%6.2
Dietitian1013546470%5.5
Occupational Therapy Aide0221812527%7.2
Occupational Therapy Assistant0334467%7.3
Medical Director0113533%11.5

Health Inspection History

Inspections
Total health inspections 5

Tennessee average 3.5


Last Health inspection on Jul 2024

Total health citations 27
Citations per inspection
5.4

Health citations are formal notices following inspections when they fail to comply with safety and care standards.

20 of 27 citations resulted from standard inspections; and 7 of 27 resulted from complaint investigations.

Breakdown of citation severity (last 3 years)
Critical Health citations More info 0
100% better than Tennessee average

Tennessee average: 1.1


Serious Health citations More info 5
733% worse than Tennessee average

Tennessee average: 0.6

0 critical citations More info Tennessee average: 1.1

5 serious citations More info Tennessee average: 0.6

22 moderate citations More info Tennessee average: 13.7

0 minor citations More info Tennessee average: 0.1
Citations history (last 3 years)
Infection Control moderate citation Jul 17, 2024
Corrected

Nutrition moderate citation Jul 17, 2024
Corrected

Nutrition moderate citation Jul 17, 2024
Corrected

Quality of Care moderate citation Jul 17, 2024
Corrected

Facility Characteristics

Source: CMS Long-Term Care Facility Characteristics (Data as of Jan 2026)

Ownership: For-Profit Corporation
Part of: Life Care Centers of America, Inc.
Resident Census by Payment Source
85 Total Residents
Medicare 5 (5.9%)
Medicaid 58 (68.2%)
Private Pay/Other 22 (25.9%)
Programs & Services
Residents' Group
Family Engagement

Active councils help families stay involved in care decisions and facility operations.

Quality of care over time

These measures show how residents usually do over time at this home, based on health outcomes and preventive care.

High-risk clinical events score Info A composite score based on pressure ulcers, falls with injury, weight loss, walking ability decline, and activities of daily living decline. 7.3
31% better than Tennessee average

Tennessee average: 10.5

Functional decline score Info A composite score based on activities of daily living decline, walking ability decline, and incontinence. 16.4
16% better than Tennessee average

Tennessee average: 19.5

Long-stay resident measures
Need for Help with Daily Activities Increased Info Percent of long-stay residents whose need for help with daily activities has increased 9.9%
38% better than Tennessee average

Tennessee average: 16.0%

Walking Ability Worsened Info Percent of long-stay residents whose ability to move independently worsened 17.1%
21% better than Tennessee average

Tennessee average: 21.7%

Low Risk Residents with Bowel/Bladder Incontinence Info Percent of low risk long-stay residents who lose control of their bowels or bladder 22.2%
7% worse than Tennessee average

Tennessee average: 20.7%

Falls with Major Injury Info Percent of long-stay residents experiencing one or more falls with major injury 0.0%
100% better than Tennessee average

Tennessee average: 3.7%

High Risk Residents with Pressure Ulcers Info Percent of long-stay high risk residents with pressure ulcers 8.0%
47% worse than Tennessee average

Tennessee average: 5.4%

Urinary Tract Infection Info Percent of long-stay residents with a urinary tract infection 0.4%
82% better than Tennessee average

Tennessee average: 2.1%

Lost Too Much Weight Info Percent of long-stay residents who lose too much weight 1.4%
79% better than Tennessee average

Tennessee average: 6.3%

Depressive Symptoms Info Percent of long-stay residents who have depressive symptoms 6.3%
43% better than Tennessee average

Tennessee average: 11.0%

Antipsychotic Use Info Percent of long-stay residents who received an antipsychotic medication 15.5%
6% better than Tennessee average

Tennessee average: 16.5%

Pneumococcal Vaccine Info Percent of long-stay residents assessed and appropriately given the pneumococcal vaccine 58.2%
35% worse than Tennessee average

Tennessee average: 89.9%

Influenza Vaccine Info Percent of long-stay residents assessed and appropriately given the seasonal influenza vaccine 91.6%
In line with Tennessee average

Tennessee average: 94.5%

Hospitalizations per 1,000 days Info Number of hospitalizations per 1,000 long-stay resident days. 1.96
24% worse than Tennessee average

Tennessee average: 1.58

ED visits per 1,000 days Info Number of outpatient emergency department visits per 1,000 long-stay resident days. 1.88
20% worse than Tennessee average

Tennessee average: 1.57

Short-stay resident measures
Pneumococcal Vaccine Info Percent of short-stay residents assessed and appropriately given the pneumococcal vaccine 51.3%
36% worse than Tennessee average

Tennessee average: 79.7%

Antipsychotic medication increase Info Percent of short-stay residents who newly received an antipsychotic medication 2.4%
39% worse than Tennessee average

Tennessee average: 1.7%

Influenza Vaccine Info Percent of short-stay residents assessed and appropriately given the seasonal influenza vaccine 94.5%
18% better than Tennessee average

Tennessee average: 79.8%

Re-hospitalized after SNF stay Info Percentage of short-stay residents who were re-hospitalized after their nursing home admission. 15.0%
32% better than Tennessee average

Tennessee average: 22.2%

Emergency department visits Info Percentage of short-stay residents who had an outpatient emergency department visit. 6.6%
41% better than Tennessee average

Tennessee average: 11.2%

Falls with major injury Info Percentage of SNF residents who experience falls with major injury during their stay. 0.0%
100% better than Tennessee average

Tennessee average: 0.8%

Ability to care for self at discharge Info Percentage of residents at or above expected ability to care for themselves at discharge. 55.6%
In line with Tennessee average

Tennessee average: 53.7%

Successful return to home or community Info Rate of successful return to home or community from a skilled nursing facility. 51.3%
In line with Tennessee average

Tennessee average: 50.6%

Penalties and fines

Federal penalties imposed by CMS for regulatory violations, including civil money penalties (fines) and denials of payment for new Medicare/Medicaid admissions.

Source: CMS Penalties Database (Data as of Jan 2026)

Total fines amount $9K
90% lower than Tennessee average

Tennessee average: $86K

Number of fines 1
43% fewer fines than Tennessee average

Tennessee average: 1.7

Payment Denials Info Serious action where Medicare and/or Medicaid temporarily stops payments for new residents until issues are fixed. 0
100% fewer payment denials than Tennessee average

Tennessee average: 0.5

Fines amount comparison
This facility $9K
Tennessee average $86K
Penalty History

Penalties are imposed by CMS for violations of federal nursing home regulations.

Civil Money Penalty Info Fines imposed for noncompliance, which can be assessed per day or per instance of violation. Feb 29, 2024
$9K

Last updated: Jan 2026

Guides for Better Senior Living

Care Cost Calculator: See Prices in Your Area

Nursing Home Data Explorer

Don’t Wait Too Long: 7 Red Flag Signs Your Parent Needs Assisted Living Now

The True Cost of Assisted Living in 2025 – And How Families Are Paying For It

Understanding Senior Living Costs: Pricing Models, Discounts & Financial Assistance

Financial Aid for Tennessee Seniors

Get financial aid guidance

CHOICES Program

TN Medicaid CHOICES

Age 65+ or disabled, Tennessee resident, Medicaid-eligible, nursing home-level care need.

~$2,829/month (300% FBR, individual).

$2,000 (individual), $3,000 (couple).

Managed care model; high rural demand.

Tennessee Options for Community Living

TN Options

Age 60+, Tennessee resident, at risk of nursing home.

~$2,000/month (individual, varies).

$5,000 (individual).

Limited funding; rural/urban balance.

Medicare Savings Program (MSP)

Tennessee Medicare Savings Program

Age 65+ or disabled, TN resident, Medicare Part A/B.

~$2,510/month (QMB), ~$3,380/month (SLMB), ~$3,598/month (QI)—individual.

$9,430 (individual), $14,130 (couple).

Three tiers; includes Extra Help for Part D; no waitlist.

Low-Income Home Energy Assistance Program (LIHEAP)

Tennessee LIHEAP

Age 60+ prioritized, TN resident, low-income household.

~$3,970/month (individual, 185% FPL).

Not assessed; income-focused.

Covers gas, electric, propane; emergency aid available.

Family Caregiver Support Program (FCSP)

Tennessee Family Caregiver Support Program

Caregivers of 60+ needing care or 55+ caregivers of others; TN resident; functional needs (2+ ADLs).

No strict cap; prioritizes low-income (~$24,980/year).

Not assessed; need-based.

Includes grandparent caregivers; high rural demand.

Senior Community Service Employment Program (SCSEP)

Tennessee SCSEP

Age 55+, unemployed, low-income, TN resident.

~$1,983/month (125% FPL).

Not specified; income-focused.

Priority for veterans, rural residents; AARP/Goodwill partnership.

VA Aid and Attendance (A&A) and Housebound Benefits

Tennessee VA Aid and Attendance/Housebound

Age 65+ or disabled veteran/spouse, TN resident, wartime service, need for ADL help (A&A) or homebound.

Net income < ~$1,984/month (veteran with dependent, A&A); pension offsets income.

~$155,356 (net worth limit).

High veteran population; supports rural/urban care needs.

Elderly Nutrition Program

Tennessee Elderly Nutrition Program

Age 60+, TN resident; no income limit but prioritizes low-income.

None; donations encouraged.

Not assessed.

Serves ~50,000 annually; 200+ congregate sites plus Meals on Wheels.

Property Tax Relief Program

Tennessee Property Tax Relief Program

Age 65+, TN resident, homeowner/renter (or widow/er 50+, disabled 18+).

~$45,000/year (household, excludes half of Social Security).

Not assessed; income-focused.

Rebates up to $1,000; serves ~100,000 annually.

Who we are

Your Senior Care Partner, Every Step of the Way

We help families find affordable senior communities and unlock same day discounts, Medicaid, and Medicare options tailored to your needs.

Contact us Today
Tour Icon
Planning a tour? Check our touring checklist.
Chat Icon
Thinking of living here? We can help you speak to a current resident