Life Care Center of Red Bank
Nursing Home · Chattanooga, TN
CMS overall rating Info The Overall CMS Rating is scored from 1 to 5 stars and combines results from health inspections, staffing levels, and quality measures. Health inspections carry the most weight. Staffing and quality scores can increase or decrease the final rating based on performance compared to state and national standards.

Life Care Center of Red Bank

Nursing Home · Chattanooga, TN
CMS overall rating Info The Overall CMS Rating is scored from 1 to 5 stars and combines results from health inspections, staffing levels, and quality measures. Health inspections carry the most weight. Staffing and quality scores can increase or decrease the final rating based on performance compared to state and national standards.
Calculator: See prices in your area
Life Care Center of Red Bank accepts Medicare, Medicaid, and private pay.

Overview of Life Care Center of Red Bank

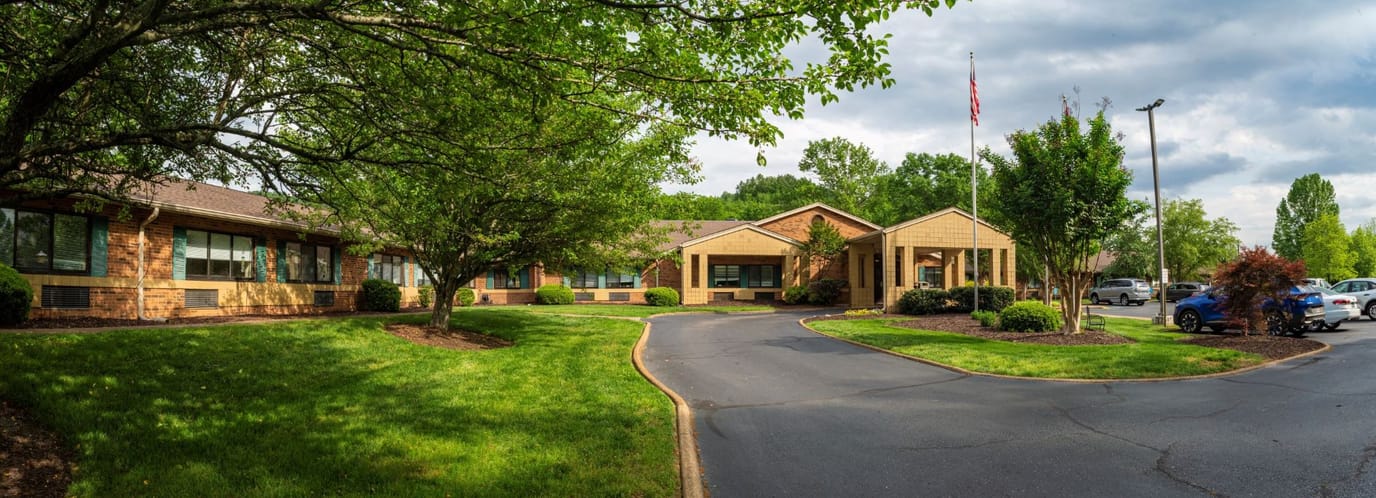
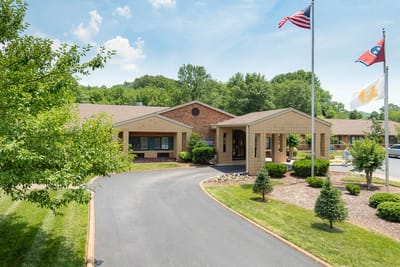
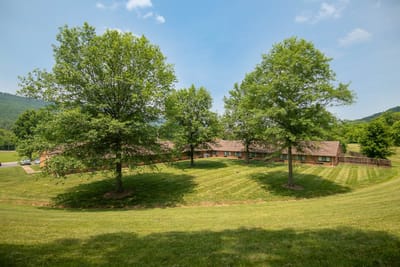
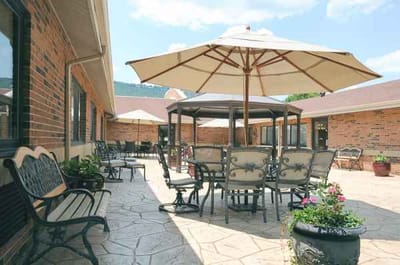
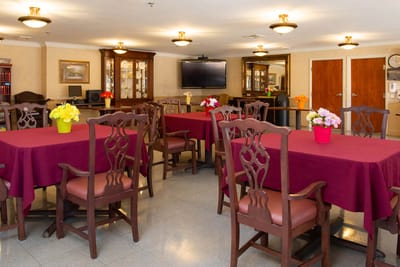
Life Care Center of Red Bank is a skilled nursing and rehabilitation center. The upscale nursing home aims to change the meaning of skilled nursing and rehabilitation for seniors through the exceptional care delivered by their patient-friendly staff to offer the best care possible for their residents. Life Care Center can be trusted as a safe and secure community that cares for every patient’s needs.
Convenience and hassle-free living are the center of Life Care Center services: medication management, post-surgical care, and wound care. Their 24-hour skilled nursing care services provide compassionate care as their utmost priority. Other benefits include 24/7 easy admissions, fall prevention, IV therapy, discharge planning, and case management.

(423) 877-1155

Quality ratings

Measured by Centers for Medicare & Medicaid Services (CMS)

Overall rating Info The Overall CMS Rating combines results from health inspections, staffing levels and quality measures. Health inspections carry the most weight. Staffing and quality scores can increase or decrease the final rating based on performance compared to state and national standards.
▼ 2.0% Below TN avg. ▼ 2.0% Below TN avg.Click the badge to see the full State ranking.Click here to see the full State ranking.
Health Inspection Info Based on the results of the facility's three most recent standard inspections and any complaint investigations. CMS reviews the number, scope, and severity of deficiencies, with more recent findings weighted more heavily.
▼ 31.5% Below TN avg. ▼ 31.5% Below TN avg.Click the badge to see the full State ranking.Click here to see the full State ranking.
Staffing Info Measures average nursing staff hours per resident per day, including Registered Nurses (RNs) and total nursing staff. Ratings are adjusted based on the level of care residents require and are compared to state and national benchmarks.
▼ 18.4% Below TN avg. ▼ 18.4% Below TN avg.Click the badge to see the full State ranking.Click here to see the full State ranking.
Quality Measures Info Based on clinical and physical health indicators reported to CMS, such as hospital readmissions, falls, pressure ulcers, and improvements in mobility. These measures reflect how well residents' health needs are being managed.
▲ 34.0% Above TN avg. ▲ 34.0% Above TN avg.Click the badge to see the full State ranking.Click here to see the full State ranking.

Staffing hours breakdown

Info Daily nursing hours per resident by staff type, reported to CMS. Higher is generally better — compare this facility to state and national averages to see where staffing stands.

Hours per resident per day — compared to Tennessee state averages

Total nursing care / resident Info This home is ranked 69th out of 172 homes in Tennessee. Total adjusted nursing hours per resident per day, combining RN, LPN, and aide time. CMS adjusts this for case-mix so facilities can be fairly compared.
3h 27m per day
Rank #69 / 172Nurse hours — State benchmarkedThis home is ranked 69th out of 172 homes in Tennessee. Shows adjusted nurse hours per resident per day benchmarked to the Tennessee average, with a ranking across 172 Tennessee SNFs. More hours mean more direct care. The national average is about 3.5 hrs; below 3.0 is a red flag.Click the rank badge to see the full State ranking.Click here to see the full State ranking.
This facility Tennessee avg (3h 40m per day)
vs Tennessee avg
-6%

5 of 6 metrics below state avg

Staff typeHours / Day / Residentvs state avg
Registered Nurse (RN) Info RNs hold the highest nursing license and can assess residents, interpret test results, and direct care plans. More RN hours per day often signals stronger clinical oversight and faster response to health changes. 32m per day ▼ 14% State avg: 37m per day · National avg: 41m per day
LPN / LVN Info Licensed Practical Nurses (LPNs) or Licensed Vocational Nurses (LVNs) deliver routine hands-on care — medication administration, wound dressing, and monitoring vital signs. They work under RN supervision and make up a large share of daily bedside care. 56m per day ▼ 15% State avg: 1h 6m per day · National avg: 52m per day
Nurse Aide Info Certified Nurse Aides (CNAs) provide the most direct day-to-day assistance: bathing, dressing, feeding, and mobility. Nurse aide hours are typically the largest staffing category and directly affect residents' quality of life. 2h 0m per day ▼ 7% State avg: 2h 9m per day · National avg: 2h 21m per day
Total Nursing (Weekend) Info Combined nursing hours (RN + LPN + Nurse Aide) per resident per day on weekends. Staffing often drops on weekends — this figure reveals whether the facility maintains adequate coverage outside of weekday hours. 3h 4m per day ▼ 8% State avg: 3h 21m per day · National avg: 3h 26m per day
Physical Therapist Info Hours per resident per day provided by licensed Physical Therapists (PTs) or PT Assistants. PT services help residents recover mobility after injury or illness and are especially important for post-acute (short-stay) rehabilitation. 5m per day ■ Avg State avg: 5m per day · National avg: 4m per day
RN (Weekend) Info Registered nurse hours specifically on weekends. Facilities sometimes reduce RN presence on Saturdays and Sundays — a low weekend RN figure compared to weekday hours can indicate reduced clinical oversight when most administrative staff are absent. 18m per day ▼ 28% State avg: 25m per day · National avg: 29m per day

Capacity and availability

Avg. Length of Stay
74 days
Bed community size
54-bed community Rank #148 / 180Bed count — State benchmarkedThis home is ranked 148th out of 180 homes in Tennessee. Shows this facility's certified or reported bed count compared to other Tennessee SNFs. Larger communities may offer more amenities, programs, and on-site services for residents and families.Click the rank badge to see the full State ranking.Click here to see the full State ranking.
A moderately sized community that may balance personal attention with shared amenities and social activities.
Years in operation
44 years in operation Rank #16 / 153Years in operation — State benchmarkedThis home is ranked 16th out of 153 homes in Tennessee. Shows how long this facility has been in operation compared to other Tennessee SNFs. Longer operating histories may benefit residents, families, and staff.Click the rank badge to see the full State ranking.Click here to see the full State ranking.
A longer operating history, which may indicate experience navigating regulations and delivering ongoing care.
Walk Score
Walk Score: 9 / 100 Rank #143 / 180Walk Score — State benchmarkedThis home is ranked 143rd out of 180 homes in Tennessee. Shows how walkable this facility's neighborhood is compared to the average Walk Score across Tennessee SNFs. Higher scores benefit residents, families, and staff.Click the rank badge to see the full State ranking.Click here to see the full State ranking.
Car-dependent. Most errands require a car, with limited nearby walkable options.
BBB Rating
BBB Rating: A+ (Not Accredited)
An independent rating from the Better Business Bureau based on factors such as complaint history, transparency, and business practices.
How BBB ratings work

About this community

Occupancy

Occupancy rate
94%
Rank #1 / 177Occupancy rate — State benchmarkedThis home is ranked 1st out of 177 homes in Tennessee. Shows this facility's occupancy rate versus the Tennessee average, with its Statewide rank out of 177. Higher occupancy signals strong local demand and financial stability.Click the rank badge to see the full State ranking.Click here to see the full State ranking.
Higher than the Tennessee average: 71.6%
Occupied beds
51 / 54
Average residents per home in Tennessee 82 per day

License Details

Facility TypeNursing Home
StatusLicensed
IssuanceJanuary 7, 1992
ExpirationApril 3, 2026
CountyGiles
License Number00000108

Ownership & Operating Entity

Life Care Center of Red Bank is legally operated by Red Bank Operations, LLC, and administrated by Emily Boshears.

Staffing

Key information about the people who lead and staff this community.

Leadership

ContactMs. Emily Boshears, Director of Administration

Staff Composition

Total Employees
19
Full-Time Employees
19

Therapy & Rehabilitation

1 service
Rehabilitation Services

Staffing & Medical

1 service
24-Hour Staffing

Amenities & Lifestyle

24-Hour Security And Fire Safety Systems
Beauty Salon And Barber Shop
Bedside And Bathroom Call Lights
Certified Dietitian
Community Re-Entry Program
Complimentary Wireless Internet
Daily Activity Schedule
Family/Resident Councils
Fine Dining Program
Flat-Screen Tvs
Flexible Visiting Hours
Full-Time
Certified Activity Director
Homelike Setting
Housekeeping And Laundry Services
Landscaped Grounds And Courtyards
Library
Non-Smoking Facility
Pet Visitors Allowed
Private And Semiprivate Rooms
Private Bathrooms
Religious Services
Patient/Family Education Program
Telephone And Cable Television Hookups
Transportation Services
Specific ProgramsAlzheimer's & Dementia Care, Independent & Assisted Living

Contact Life Care Center of Red Bank

Inspection History

In Tennessee, the Department of Health, Division of Health Care Facilities performs unannounced inspections and investigations to ensure facilities provide high-quality resident care.

Since 2019 · 7 years of data 26 citations

Inspection Scorecard Info This scorecard compares key inspection, citation, and complaint metrics at this facility against the Tennessee state average. Metrics rated ≥15% worse than average are highlighted in red; those ≥15% better are highlighted in green.

Since 2019 vs. Tennessee state average
Overall vs. TN average 2 Worse Metrics worse than Tennessee average:
• Total citations (550% above)
• Citations per year (517% above)
0 Better No metrics in this bucket.
Latest Inspection July 17, 2024 Routine

Citations Info Citations are formal regulatory issues recorded during state inspections.

This FacilityTN Averagevs. TN Avg
Total citations Info Formal regulatory issues recorded by inspectors across all inspection types. 264 This facility has 550% more total citations than a typical Tennessee nursing home (26 vs. TN avg 4).↑ 550% worse
Citations per year Info Average citations per year since 2019. 3.70.6 This facility has 517% more citations per year than a typical Tennessee nursing home (3.7 vs. TN avg 0.6).↑ 517% worse

Inspection Reports Summary Info An editor-reviewed summary of the themes and findings across this facility's recent inspection reports.

The most recent inspection on July 17, 2024, identified multiple deficiencies related to resident privacy, timely notification of condition changes, assessment accuracy, PASARR resubmissions, feeding tube care, respiratory equipment storage, food safety, garbage sanitation, and infection control precautions. Earlier inspections showed a mix of issues including care plan implementation, fall prevention, medication management, abuse reporting, and food safety, with some resulting in actual harm to residents. Inspectors cited recurring themes around care coordination, documentation, and environmental sanitation. Complaint investigations mostly found deficiencies related to care plan adherence, fall injuries, medication safety, and abuse reporting, with corrective actions verified but no fines or license actions listed in the available reports. The inspection history shows ongoing challenges with regulatory compliance, with no clear pattern of improvement in recent findings.

Read the full inspection reports for this facility, including detailed findings and corrective actions.

Show Inspection Reports

Residents information

Stay stats

Average length of stay
234 days
Total residents
43
Total admissions (2024)
26
Total discharges (2024)
25

Discharges

  • To hospital 6
  • To Private Residence or Home 1

Demographics

GENDER

  • Female Residents 51.2%
  • Male Residents 48.8%

AGE DISTRIBUTION

  • Under 60 4.7%
  • 60-64 2.3%
  • 65-69 14%
  • 70-74 16.3%
  • 75-79 2.3%
  • 80-84 14%
  • 85-89 11.6%
  • 90 or more 34.9%

ETHNICITY

  • Black Residents 4.7%
  • White Residents 95.3%

Health Inspection History

Inspections Since 2019
Total health inspections 5

Tennessee average 3.5


Last Health inspection on Jul 2024

Total health citations
27 Rank #157 / 176Health citations — State benchmarkedThis home is ranked 157th out of 176 homes in Tennessee. Shows this facility's total health deficiency citations benchmarked to the Tennessee State average, with a ranking across all 176 TN SNFs. Lower citation counts earn a better rank.Click the rank badge to see the full State ranking.Click here to see the full State ranking.

Tennessee average 15.4

Citations per inspection
5.4 Rank #137 / 176Citations per inspection — State benchmarkedThis home is ranked 137th out of 176 homes in Tennessee. Shows average deficiency citations per CMS inspection for this facility versus the Tennessee mean across 176 SNFs with citation data. Lower is better.Click the rank badge to see the full State ranking.Click here to see the full State ranking.

Tennessee average 4.39


Health citations are formal notices following inspections when they fail to comply with safety and care standards.

20 of 27 citations resulted from standard inspections; and 7 of 27 resulted from complaint investigations.

Breakdown of citation severity (last 7 years)
Critical Health citations
0
100% better than Tennessee average

Tennessee average: 1.1


Serious Health citations
5 Rank #47 / 50Serious citations (G–I) — State benchmarkedThis home is ranked 47th out of 50 homes in Tennessee. Shows G–I scope serious health citations for this facility versus other Tennessee SNFs. Lower counts rank better.Click the rank badge to see the full State ranking.Click here to see the full State ranking.
733% worse than Tennessee average

Tennessee average: 0.6

0 critical citations Tennessee average: 1.1

5 serious citations Tennessee average: 0.6

22 moderate citations Tennessee average: 13.7

0 minor citations Tennessee average: 0.1
Citations history (last 7 years)
Infection Control moderate citation Jul 17, 2024
Corrected

Nutrition moderate citation Jul 17, 2024
Corrected

Nutrition moderate citation Jul 17, 2024
Corrected

Quality of Care moderate citation Jul 17, 2024
Corrected

Staffing Data

Reporting period: October 1 – December 31, 2025 (Q4 2025). Source: CMS Payroll-Based Journal report.

Total staff 118
Employees 112
Contractors 6
Staff to resident ratio 1.39:1
23% worse than Tennessee average
Tennessee average ratio: 1.79:1 Tennessee average ratio: 1.79:1See full Tennessee ranking
Avg staff/day 43
Average shift 8.2 hours
0% compared with Tennessee average
Tennessee average: 8.3 hours Tennessee average shift: 8.3 hoursSee full Tennessee ranking
Total staff hours (quarter) 32,631

Nursing staff breakdown

Q4 2025 · Oct 1 – Dec 31 More info This data comes from the CMS Payroll-Based Journal report covering October 1 – December 31, 2025.
Registered Nurse

Manages medical care and health needs.

Total count 8
Average shift length Info Average shift length. Calculated as total hours divided by days worked and average staff per day. 8.7 hours

No contractors work on this role.

Licensed Practical Nurse

Assists with medical care and medications.

Total count 18
Average shift length Info Average shift length. Calculated as total hours divided by days worked and average staff per day. 9.2 hours

No contractors work on this role.

Certified Nursing Assistant

Helps with daily care and mobility.

Total count 59
Average shift length Info Average shift length. Calculated as total hours divided by days worked and average staff per day. 8.6 hours

No contractors work on this role.

Contractor staffing

Q4 2025 · Oct 1 – Dec 31 More info This data comes from the CMS Payroll-Based Journal report covering October 1 – December 31, 2025.

Total hours from contractors

0.6%

205 contractor hours this quarter

Occupational Therapy Assistant: 3 Occupational Therapy Aide: 2 Medical Director: 1

Staff by category

Q4 2025 · Oct 1 – Dec 31 More info This data comes from the CMS Payroll-Based Journal report covering October 1 – December 31, 2025.
Certified Nursing Assistant5905915,24392100%8.6
Licensed Practical Nurse180186,33092100%9.2
Registered Nurse8082,33292100%8.7
Clinical Nurse Specialist3031,2847379%7.8
RN Director of Nursing2029767683%7.6
Speech Language Pathologist3037796975%5.9
Physical Therapy Aide3037787278%6
Dietitian1016277683%8.3
Respiratory Therapy Technician4045966874%7.2
Administrator1015286672%8
Nurse Practitioner1015056470%7.9
Mental Health Service Worker1014706571%7.2
Other Dietary Services Staff1014557582%6.1
Qualified Social Worker2024546470%7.1
Physical Therapy Assistant2024546571%6.6
Dental Services Staff1014486368%7.1
Nurse Aide in Training2021672123%8
Occupational Therapy Aide0221292325%5.4
Occupational Therapy Assistant0334267%6.9
Medical Director0113533%11.5
59 Certified Nursing Assistant
% of Days 100%
18 Licensed Practical Nurse
% of Days 100%
8 Registered Nurse
% of Days 100%
3 Clinical Nurse Specialist
% of Days 79%
2 RN Director of Nursing
% of Days 83%
3 Speech Language Pathologist
% of Days 75%
3 Physical Therapy Aide
% of Days 78%
1 Dietitian
% of Days 83%
4 Respiratory Therapy Technician
% of Days 74%
1 Administrator
% of Days 72%
1 Nurse Practitioner
% of Days 70%
1 Mental Health Service Worker
% of Days 71%
1 Other Dietary Services Staff
% of Days 82%
2 Qualified Social Worker
% of Days 70%
2 Physical Therapy Assistant
% of Days 71%
1 Dental Services Staff
% of Days 68%
2 Nurse Aide in Training
% of Days 23%
2 Occupational Therapy Aide
% of Days 25%
3 Occupational Therapy Assistant
% of Days 7%
1 Medical Director
% of Days 3%

Penalties and fines

Includes penalties issued in 2024

Federal penalties imposed by CMS for regulatory violations, including civil money penalties (fines) and denials of payment for new Medicare/Medicaid admissions.

Source: CMS Penalties Database (Data as of Jan 2026)

Total fines amount $9K Rank #120 / 177Federal fines — State benchmarkedThis home is ranked 120th out of 177 homes in Tennessee. Shows this facility's cumulative CMS federal fine dollars versus the Tennessee average among facilities with fines, and where it ranks among 177 skilled nursing facilities in the pool. Lower total dollars mean a better rank.Click the rank badge to see the full State ranking.Click here to see the full State ranking.
90% lower than Tennessee average

Tennessee average: $86K

Number of fines 1
43% fewer fines than Tennessee average

Tennessee average: 1.7

Payment Denials Info Serious action where Medicare and/or Medicaid temporarily stops payments for new residents until issues are fixed. 0
100% fewer payment denials than Tennessee average

Tennessee average: 0.5

Fines amount comparison
This facility $9K
Tennessee average $86K
Penalty History

Penalties are imposed by CMS for violations of federal nursing home regulations.

1 penalty in the past 3 years

Feb 29, 2024 · $9K

Civil Money Penalty Info Fines imposed for noncompliance, which can be assessed per day or per instance of violation. Feb 29, 2024
$9K

Last updated: Jan 2026

Quality of care over time

These measures show how residents usually do over time at this home, based on health outcomes and preventive care.

High-risk clinical events score Info A composite score based on pressure ulcers, falls with injury, weight loss, walking ability decline, and activities of daily living decline. 7.3
31% better than Tennessee average

Tennessee average: 10.5

Functional decline score Info A composite score based on activities of daily living decline, walking ability decline, and incontinence. 16.4
16% better than Tennessee average

Tennessee average: 19.5

Long-stay resident measures
Above average Tennessee avg: 3.7 Info CMS star rating based on long-stay quality measure performance. 5 stars = significantly above average, 1 star = significantly below average.
Need for Help with Daily Activities Increased Info Percent of long-stay residents whose need for help with daily activities has increased 9.9%
38% better than Tennessee average

Tennessee average: 16.0%

Walking Ability Worsened Info Percent of long-stay residents whose ability to move independently worsened 17.1%
21% better than Tennessee average

Tennessee average: 21.7%

Low Risk Residents with Bowel/Bladder Incontinence Info Percent of low risk long-stay residents who lose control of their bowels or bladder 22.2%
7% worse than Tennessee average

Tennessee average: 20.7%

Falls with Major Injury Info Percent of long-stay residents experiencing one or more falls with major injury 0.0%
100% better than Tennessee average

Tennessee average: 3.7%

High Risk Residents with Pressure Ulcers Info Percent of long-stay high risk residents with pressure ulcers 8.0%
47% worse than Tennessee average

Tennessee average: 5.4%

Urinary Tract Infection Info Percent of long-stay residents with a urinary tract infection 0.4%
82% better than Tennessee average

Tennessee average: 2.1%

Lost Too Much Weight Info Percent of long-stay residents who lose too much weight 1.4%
79% better than Tennessee average

Tennessee average: 6.3%

Depressive Symptoms Info Percent of long-stay residents who have depressive symptoms 6.3%
43% better than Tennessee average

Tennessee average: 11.0%

Antipsychotic Use Info Percent of long-stay residents who received an antipsychotic medication 15.5%
6% better than Tennessee average

Tennessee average: 16.5%

Pneumococcal Vaccine Info Percent of long-stay residents assessed and appropriately given the pneumococcal vaccine 58.2%
35% worse than Tennessee average

Tennessee average: 89.9%

Influenza Vaccine Info Percent of long-stay residents assessed and appropriately given the seasonal influenza vaccine 91.6%
In line with Tennessee average

Tennessee average: 94.5%

Hospitalizations per 1,000 days Info Number of hospitalizations per 1,000 long-stay resident days. 1.96
24% worse than Tennessee average

Tennessee average: 1.58

ED visits per 1,000 days Info Number of outpatient emergency department visits per 1,000 long-stay resident days. 1.88
20% worse than Tennessee average

Tennessee average: 1.57

Short-stay resident measures
Significantly above average Tennessee avg: 3.4 Info CMS star rating based on short-stay quality measure performance. 5 stars = much above average, 1 star = much below average.
Pneumococcal Vaccine Info Percent of short-stay residents assessed and appropriately given the pneumococcal vaccine 51.3%
36% worse than Tennessee average

Tennessee average: 79.7%

Antipsychotic medication increase Info Percent of short-stay residents who newly received an antipsychotic medication 2.4%
39% worse than Tennessee average

Tennessee average: 1.7%

Influenza Vaccine Info Percent of short-stay residents assessed and appropriately given the seasonal influenza vaccine 94.5%
18% better than Tennessee average

Tennessee average: 79.8%

Re-hospitalized after SNF stay Info Percentage of short-stay residents who were re-hospitalized after their nursing home admission. 15.0%
32% better than Tennessee average

Tennessee average: 22.2%

Emergency department visits Info Percentage of short-stay residents who had an outpatient emergency department visit. 6.6%
41% better than Tennessee average

Tennessee average: 11.2%

Falls with major injury Info Percentage of SNF residents who experience falls with major injury during their stay. 0.0%
100% better than Tennessee average

Tennessee average: 0.8%

Ability to care for self at discharge Info Percentage of residents at or above expected ability to care for themselves at discharge. 55.6%
In line with Tennessee average

Tennessee average: 53.7%

Successful return to home or community Info Rate of successful return to home or community from a skilled nursing facility. 51.3%
In line with Tennessee average

Tennessee average: 50.6%

Breakdown by payment type

Medicare

26% of new residents, usually for short-term rehab.

Typical stay 28 days

Private pay

54% of new residents, often for short stays.

Typical stay 1 - 2 months

Medicaid

20% of new residents, often for long-term daily care.

Typical stay 7 - 8 months

Facility Characteristics

Source: CMS Long-Term Care Facility Characteristics (Data as of Jan 2026)

Total residents 85
Medicare
5
5.9% of residents
Medicaid
58
68.2% of residents
Private pay or other
22
25.9% of residents
Programs & Services
Residents Group

Residents meet regularly to discuss policies, care quality, and activities

Active Resident Council

Organized group of residents that meets regularly to discuss facility policies, quality of life, and activities.

Finances and operations

Privately-owned community
Home revenue
$14.0M
Profit
$357.8K
Privately-owned community
Home revenue
$14.0M Rank #71 / 176Revenue — State benchmarkedThis home is ranked 71st out of 176 homes in Tennessee. Shows this facility's annual revenue compared to the Tennessee SNF average. Higher revenue generally means more resources for staffing and capital — read alongside Payroll %.Click the rank badge to see the full State ranking.Click here to see the full State ranking.
Profit
$357.8K
Payroll costs Info The portion of the home's budget spent on staff, including nurses, caregivers, and other employees who support care and operations. Rank #59 / 176Payroll — State benchmarkedThis home is ranked 59th out of 176 homes in Tennessee. Shows total annual staff payroll benchmarked to the Tennessee average. Higher payroll investment relative to peers often signals better staffing and less reliance on cheaper contract labor.Click the rank badge to see the full State ranking.Click here to see the full State ranking.
$6.9M
49.5% of revenue Rank #61 / 176Payroll % — State benchmarkedThis home is ranked 61st out of 176 homes in Tennessee. Shows payroll as a percentage of revenue versus the Tennessee average. Well-run Tennessee SNFs typically land around 50–60% — the top third Statewide. Below 25% may signal understaffing or heavy agency use — read with Staffing ratings.Click the rank badge to see the full State ranking.Click here to see the full State ranking.
Other operating costs Info All remaining costs needed to run the home, such as food, utilities, building maintenance, supplies and administrative expenses.
$6.7M
Total costs $13.6M

Who this home usually serves

TYPE OF STAY

Mix of rehab and long-term care

This home supports both short-term rehab and long-term care, with residents staying for a wide range of durations.

Places of interest near Life Care Center of Red Bank

Address 4.3 miles from city center Info Estimated distance in miles from Chattanooga's city center to Life Care Center of Red Bank's address, calculated via Google Maps. — 1.4 miles to nearest hospital (Erlanger North Hospital)

Calculate Travel Distance to Life Care Center of Red Bank

Add your location

Address

Financial Assistance for
Nursing Home in Tennessee

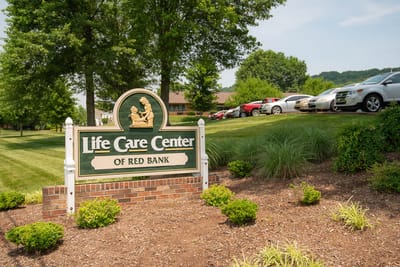
Life Care Center of Red Bank is located in Chattanooga, Tennessee.
Here are the financial assistance programs available to residents in Tennessee.

Get Financial aid guidance

CHOICES Program

TN Medicaid CHOICES

Age 65+ or disabled
General Tennessee resident, Medicaid-eligible, nursing home-level care need.
Income Limits (2025) ~$2,829/month 300% FBR, individual
Asset Limits $2,000 (individual), $3,000 (couple).
TN

Managed care model; high rural demand.

Benefits
Personal care (5-7 hours/day) Respite (240 hours/year) Adult day care ($65/day) Home modifications ($1,500 avg.)

Tennessee Options for Community Living

TN Options

Age 60+
General Tennessee resident, at risk of nursing home.
Income Limits ~$2,000/month individual, varies
Asset Limits $5,000 individual
TN

Limited funding; rural/urban balance.

Benefits
In-home care (3-5 hours/week) Respite (up to 10 days/year) Transportation (~5 trips/month)

Medicare Savings Program (MSP)

Tennessee Medicare Savings Program

Age 65+ or disabled
General TN resident, Medicare Part A/B.
Income Limits (2025) ~$2,510/month (QMB), ~$3,380/month (SLMB), ~$3,598/month (QI)—individual.
Asset Limits $9,430 (individual), $14,130 (couple).
TN

Three tiers; includes Extra Help for Part D; no waitlist.

Benefits
Covers Part B premiums ($174.70/month) Deductibles ($240/year) Copays (~20%)

Family Caregiver Support Program (FCSP)

Tennessee Family Caregiver Support Program

Age
General Caregivers of 60+ needing care or 55+ caregivers of others; TN resident; functional needs (2+ ADLs).
Income Limits (2025) No strict cap; prioritizes low-income ~$24,980/year
Asset Limits Not assessed; need-based.
TN

Includes grandparent caregivers; high rural demand.

Benefits
Respite (4-6 hours/week or 5 days/year) Adult day care ($60/day) Training Supplies (~$500/year)

VA Aid and Attendance (A&A) and Housebound Benefits

Tennessee VA Aid and Attendance/Housebound

Age 65+ or disabled veteran/spouse
General TN resident, wartime service, need for ADL help (A&A) or homebound.
Income Limits (2025) Net income < ~$1,984/month (veteran with dependent, A&A); pension offsets income.
Asset Limits ~$155,356 net worth limit
TN

High veteran population; supports rural/urban care needs.

Benefits
Cash (~$1,433-$2,642/month veteran, ~$951-$1,318 spouse) for care costs (e.g., in-home, assisted living)

Elderly Nutrition Program

Tennessee Elderly Nutrition Program

Age 60+
General TN resident; no income limit but prioritizes low-income.
Income Limits (2025) None; donations encouraged.
Asset Limits Not assessed.
TN

Serves ~50,000 annually; 200+ congregate sites plus Meals on Wheels.

Benefits
Congregate meals ($5-$7/meal value) at senior centers Home-delivered meals ($5-$7/meal)

Property Tax Relief Program

Tennessee Property Tax Relief Program

Age 65+
General TN resident, homeowner/renter (or widow/er 50+, disabled 18+).
Income Limits (2025) ~$45,000/year household, excludes half of Social Security
Asset Limits Not assessed; income-focused.
TN

Rebates up to $1,000; serves ~100,000 annually.

Benefits
Tax rebates (~$250-$1,000 based on income; e.g., $1,000 if income < $8,000)

Frequently Asked Questions about Life Care Center of Red Bank

What neighborhood is Life Care Center of Red Bank in?

Life Care Center of Red Bank is in the Mountain Creek neighborhood of Chattanooga.

Who is the owner of Life Care Center of Red Bank?

The legal owner and operator of Life Care Center of Red Bank is Red Bank Operations, LLC.

Is Life Care Center of Red Bank in a walkable area?

Life Care Center of Red Bank has a walk score of 9. Car-dependent. Most errands require a car, with limited nearby walkable options.

What is the license number of Life Care Center of Red Bank?

According to TN state health department records, Life Care Center of Red Bank's license number is 00000108.

When does Life Care Center of Red Bank's license expire?

According to TN state health department records, Life Care Center of Red Bank's license expires on April 3, 2026.

What is the occupancy rate at Life Care Center of Red Bank?

Life Care Center of Red Bank's occupancy is 94%.

Who is the administrator of Life Care Center of Red Bank?

Emily Boshears is the administrator of Life Care Center of Red Bank.

Guides for Better Senior Living

Care Cost Calculator: See Prices in Your Area

Nursing Home Data Explorer

Don’t Wait Too Long: 7 Red Flag Signs Your Parent Needs Assisted Living Now

The True Cost of Assisted Living in 2025 – And How Families Are Paying For It

Understanding Senior Living Costs: Pricing Models, Discounts & Financial Assistance

Explore Open Rooms
1 Contact details
2 What type of senior care service are you looking for?
3 What budget do you have in mind for senior care?
4 How soon do you need to find care?
5 Additional details

Thank you for your interest!

Our team will be in touch shortly to help with next steps.