Longwood Health and Rehabilitation Center
Nursing Home, Hospice Care & Respite Care · Longwood, FL
CMS overall rating Info CMS (the Centers for Medicare & Medicaid Services) is the federal agency that rates nursing home quality. Its Overall Rating runs from 1 to 5 stars, combining health inspections, staffing, and quality measures, with inspections weighted most heavily.

Longwood Health and Rehabilitation Center

Nursing Home, Hospice Care & Respite Care · Longwood, FL
CMS overall rating Info CMS (the Centers for Medicare & Medicaid Services) is the federal agency that rates nursing home quality. Its Overall Rating runs from 1 to 5 stars, combining health inspections, staffing, and quality measures, with inspections weighted most heavily.
Calculator: See prices in your area
Longwood Health and Rehabilitation Center accepts Medicare, Medicaid, and private pay.

Overview of Longwood Health and Rehabilitation Center

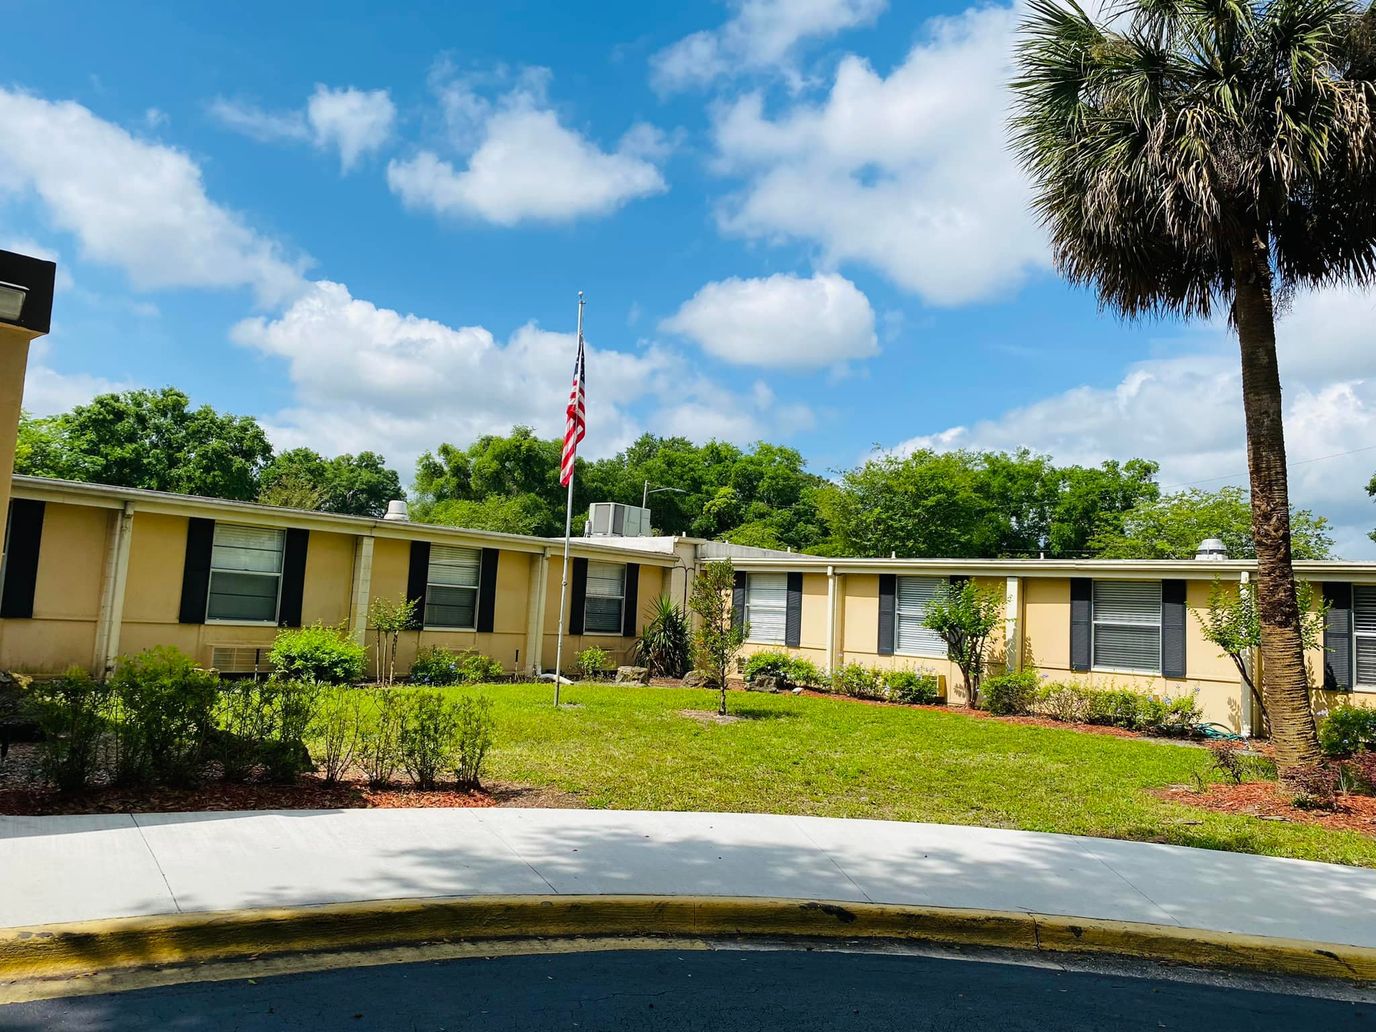
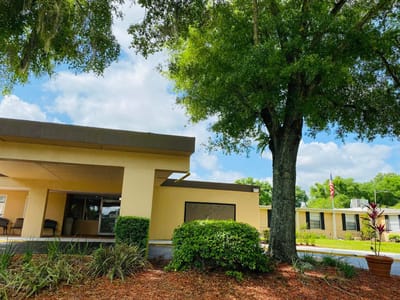
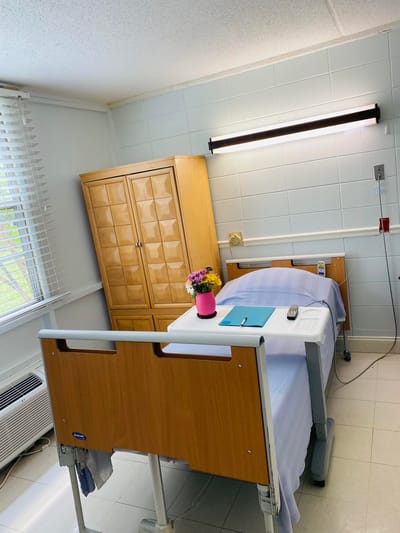
Longwood Health and Rehabilitation Center is a nursing home in Longwood, FL, offering long-term care, hospice care, rehabilitation, and respite care. With a caring and supportive environment, the community ensures older adults are treated well throughout their stay. Residents also receive exceptional services, including 24-hour care, nutritious meals, and comprehensive therapies, to help them with their recovery. Through a personal approach to care, the community goes above and beyond to meet residents’ needs and preferences.

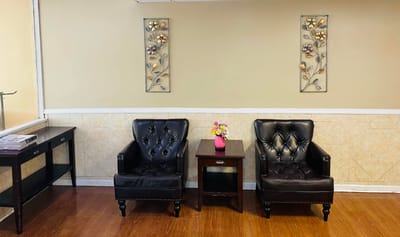
Exercises, social events, and various activities encourage residents to make friends and live actively. Accessible hallways and spacious gathering areas also ensure residents can rest and move around comfortably. Residents also have quick access to necessities and leisure, as it is located near Lake Fairy and HCA Florida Casselberry Emergency. This nursing home is a great choice for senior living in Florida, especially with its exceptional quality of care.

Quality ratings

Measured by Centers for Medicare & Medicaid Services (CMS)

Overall rating Info The Overall CMS Rating combines results from health inspections, staffing levels and quality measures. Health inspections carry the most weight. Staffing and quality scores can increase or decrease the final rating based on performance compared to state and national standards.
▼ 68.5% Below FL avg. ▼ 68.5% Below FL avg.FL average: 3.2Click the badge to see the full State ranking.Click here to see the full State ranking.
Health Inspection Info Based on the results of the facility's three most recent standard inspections and any complaint investigations. CMS reviews the number, scope, and severity of deficiencies, with more recent findings weighted more heavily.
▼ 64.4% Below FL avg. ▼ 64.4% Below FL avg.FL average: 2.8Click the badge to see the full State ranking.Click here to see the full State ranking.
Staffing Info Measures average nursing staff hours per resident per day, including Registered Nurses (RNs) and total nursing staff. Ratings are adjusted based on the level of care residents require and are compared to state and national benchmarks.
▲ 18.2% Above FL avg. ▲ 18.2% Above FL avg.FL average: 3.4Click the badge to see the full State ranking.Click here to see the full State ranking.
Quality Measures Info Based on clinical and physical health indicators reported to CMS, such as hospital readmissions, falls, pressure ulcers, and improvements in mobility. These measures reflect how well residents' health needs are being managed.
▼ 26.1% Below FL avg. ▼ 26.1% Below FL avg.FL average: 4.1Click the badge to see the full State ranking.Click here to see the full State ranking.

Staffing hours breakdown

Info Daily nursing hours per resident by staff type, reported to CMS. Higher is generally better — compare this facility to state and national averages to see where staffing stands.

Hours per resident per day — compared to Florida state averages

Total nursing care / resident Info This home is ranked 50th out of 253 homes in Florida for nurse hours. Total adjusted nursing hours per resident per day, combining RN, LPN, and aide time. CMS adjusts this for case-mix so facilities can be fairly compared.
4h 38m per day
Rank #50 / 253Nurse hours — State benchmarkedThis home is ranked 50th out of 253 homes in Florida. Shows adjusted nurse hours per resident per day benchmarked to the Florida average, with a ranking across 253 Florida facilities. More hours mean more direct care. The national average is about 3.5 hrs; below 3.0 is a red flag.Rankings are based only on facilities in Florida that report data for that category. Facilities without available data are excluded from the ranking.Click the rank badge to see the full State ranking.Click here to see the full State ranking.
This facility Florida avg (4h 2m per day)
vs Florida avg
+15%

2 of 6 metrics below state avg

Standout metric Nurse Aide is +35% above state avg
Staff typeHours / Day / Residentvs state avg
Registered Nurse (RN) Info RNs hold the highest nursing license and can assess residents, interpret test results, and direct care plans. More RN hours per day often signals stronger clinical oversight and faster response to health changes. 48m per day ▲ 9% State avg: 44m per day · National avg: 41m per day
LPN / LVN Info Licensed Practical Nurses (LPNs) or Licensed Vocational Nurses (LVNs) deliver routine hands-on care — medication administration, wound dressing, and monitoring vital signs. They work under RN supervision and make up a large share of daily bedside care. 33m per day ▼ 31% State avg: 47m per day · National avg: 52m per day
Nurse Aide Info Certified Nurse Aides (CNAs) provide the most direct day-to-day assistance: bathing, dressing, feeding, and mobility. Nurse aide hours are typically the largest staffing category and directly affect residents' quality of life. 3h 10m per day ▲ 35% State avg: 2h 20m per day · National avg: 2h 20m per day
Weekend Total Nursing Info Combined nursing hours (RN + LPN + Nurse Aide) per resident per day on weekends. Staffing often drops on weekends — this figure reveals whether the facility maintains adequate coverage outside of weekday hours. 4h 13m per day ▲ 19% State avg: 3h 32m per day · National avg: 3h 27m per day
Physical Therapist Info Hours per resident per day provided by licensed Physical Therapists (PTs) or PT Assistants. PT services help residents recover mobility after injury or illness and are especially important for post-acute (short-stay) rehabilitation. 4m per day ▼ 36% State avg: 6m per day · National avg: 4m per day
Weekend RN Info Registered nurse hours specifically on weekends. Facilities sometimes reduce RN presence on Saturdays and Sundays — a low weekend RN figure compared to weekday hours can indicate reduced clinical oversight when most administrative staff are absent. 38m per day ▲ 20% State avg: 32m per day · National avg: 29m per day

Capacity and availability

This home usually has limited availability

Higher occupancy than the Florida average: 84.3%
Occupancy rate
91.8% Rank #87 / 258Occupancy rate — State benchmarkedThis home is ranked 87th out of 258 homes in Florida. Shows this facility's occupancy rate versus the Florida average, with its Statewide rank out of 258. Higher occupancy signals strong local demand and financial stability.Rankings are based only on facilities in Florida that report data for that category. Facilities without available data are excluded from the ranking.Click the rank badge to see the full State ranking.Click here to see the full State ranking.
Avg. Length of Stay
73 days
Bed community size
120-bed community Rank #256 / 1074Bed count — State benchmarkedThis home is ranked 256th out of 1074 homes in Florida. Shows this facility's certified or reported bed count compared to other Florida facilities. Larger communities may offer more amenities, programs, and on-site services for residents and families.Rankings are based only on facilities in Florida that report data for that category. Facilities without available data are excluded from the ranking.Click the rank badge to see the full State ranking.Click here to see the full State ranking.
A larger shared setting that may offer more common spaces and organized community services.
Walk Score
Walk Score: 49 / 100 Rank #540 / 1486Walk Score — State benchmarkedThis home is ranked 540th out of 1486 homes in Florida. Shows how walkable this facility's neighborhood is compared to the average Walk Score across Florida facilities. Higher scores benefit residents, families, and staff.Rankings are based only on facilities in Florida that report data for that category. Facilities without available data are excluded from the ranking.Click the rank badge to see the full State ranking.Click here to see the full State ranking.
Somewhat walkable. A few nearby services may be reachable on foot, but most trips require transportation.

Contact Longwood Health and Rehabilitation Center

Staffing Data

Reporting period: October 1 – December 31, 2025 (Q4 2025). Source: CMS Payroll-Based Journal report.

Total staff 207
Employees 156
Contractors 51
Staff to resident ratio 1.97 : 1
34% more staff per resident than Florida average
Florida average ratio: 1.47 : 1 Florida average ratio: 1.47 : 1See full Florida ranking
Avg staff/day 65
Average shift 8.1 hours
0% compared with Florida average
Florida average: 7.9 hours Florida average shift: 7.9 hoursSee full Florida ranking
Total staff hours (quarter) 48,451

Nursing staff breakdown

Q4 2025 · Oct 1 – Dec 31 More info This data comes from the CMS Payroll-Based Journal report covering October 1 – December 31, 2025.
Registered Nurse

Manages medical care and health needs.

RN Staff Info All 27 RN Staff are full-time employees. No contractors work on this role. 27
Average shift length Info Average shift length. Calculated as total hours divided by days worked and average staff per day. 8.6 hours
Licensed Practical Nurse

Assists with medical care and medications.

LPN Staff Info 42 total: 23 full-time employees and 19 contractors. 42
Average shift length Info Average shift length. Calculated as total hours divided by days worked and average staff per day. 9 hours
Certified Nursing Assistant

Helps with daily care and mobility.

CNA Staff Info All 86 CNA Staff are full-time employees. No contractors work on this role. 86
Average shift length Info Average shift length. Calculated as total hours divided by days worked and average staff per day. 8.2 hours

Contractor staffing

Q4 2025 · Oct 1 – Dec 31 More info This data comes from the CMS Payroll-Based Journal report covering October 1 – December 31, 2025.

Total hours from contractors

6.6%

3,213 contractor hours this quarter

Licensed Practical Nurse: 19 Speech Language Pathologist: 9 Physical Therapy Aide: 7 Respiratory Therapy Technician: 7 Qualified Social Worker: 4 Occupational Therapy Assistant: 2 Physical Therapy Assistant: 2 Medical Director: 1

Staff by category

Q4 2025 · Oct 1 – Dec 31 More info This data comes from the CMS Payroll-Based Journal report covering October 1 – December 31, 2025.
Certified Nursing Assistant8608630,18492100%8.2
Registered Nurse270275,98992100%8.6
Licensed Practical Nurse2319425,20792100%9
Clinical Nurse Specialist4041,2127177%7.5
Physical Therapy Aide0771,0108289%6.3
Other Dietary Services Staff8088638390%8
Respiratory Therapy Technician0775866267%6.3
Speech Language Pathologist0995567177%5.9
Administrator1015286672%8
Dietitian1014816368%7.6
Nurse Practitioner2023855054%7.7
Mental Health Service Worker2023615459%6.7
Physical Therapy Assistant0223616874%5.3
Dental Services Staff2023204043%8
Qualified Social Worker0442154448%4.9
Occupational Therapy Assistant0221551921%5.2
Medical Director011403639%1.1
86 Certified Nursing Assistant
% of Days 100%
27 Registered Nurse
% of Days 100%
42 Licensed Practical Nurse
% of Days 100%
4 Clinical Nurse Specialist
% of Days 77%
7 Physical Therapy Aide
% of Days 89%
8 Other Dietary Services Staff
% of Days 90%
7 Respiratory Therapy Technician
% of Days 67%
9 Speech Language Pathologist
% of Days 77%
1 Administrator
% of Days 72%
1 Dietitian
% of Days 68%
2 Nurse Practitioner
% of Days 54%
2 Mental Health Service Worker
% of Days 59%
2 Physical Therapy Assistant
% of Days 74%
2 Dental Services Staff
% of Days 43%
4 Qualified Social Worker
% of Days 48%
2 Occupational Therapy Assistant
% of Days 21%
1 Medical Director
% of Days 39%

Penalties and fines

Includes penalties issued in 2024

Federal penalties imposed by CMS for regulatory violations, including civil money penalties (fines) and denials of payment for new Medicare/Medicaid admissions.

Source: CMS Penalties Database (Data as of Jan 2026)

Total fines amount $79K Rank #195 / 258Federal fines — State benchmarkedThis home is ranked 195th out of 258 homes in Florida. Shows this facility's cumulative CMS federal fine dollars versus the Florida average among facilities with fines, and where it ranks among 258 facilities in the pool. Lower total dollars mean a better rank.Rankings are based only on facilities in Florida that report data for that category. Facilities without available data are excluded from the ranking.Click the rank badge to see the full State ranking.Click here to see the full State ranking.
9% higher than Florida average

Florida average: $72K

Number of fines 3
14% more fines than Florida average

Florida average: 2.6

Payment Denials Info Serious action where Medicare and/or Medicaid temporarily stops payments for new residents until issues are fixed. 0
100% fewer payment denials than Florida average

Florida average: 0.1

Fines amount comparison
This facility $79K
Florida average $72K
Penalty History

Penalties are imposed by CMS for violations of federal nursing home regulations.

2 penalties in the past 3 years

Multiple penalties were reported in the last 3 years.

Civil Money Penalty Info Fines imposed for noncompliance, which can be assessed per day or per instance of violation. Nov 22, 2024
$8K
Civil Money Penalty Info Fines imposed for noncompliance, which can be assessed per day or per instance of violation. Nov 22, 2024
$8K

Last updated: Jan 2026

Quality of care over time

These measures show how residents usually do over time at this home, based on health outcomes and preventive care.

High-risk clinical events score Info A composite score based on pressure ulcers, falls with injury, weight loss, walking ability decline, and activities of daily living decline. 9.4
27% worse than Florida average

Florida average: 7.4

Functional decline score Info A composite score based on activities of daily living decline, walking ability decline, and incontinence. 17.0
37% worse than Florida average

Florida average: 12.4

Long-stay resident measures
Need for Help with Daily Activities Increased Info Percent of long-stay residents whose need for help with daily activities has increased 12.5%
19% worse than Florida average

Florida average: 10.5%

Walking Ability Worsened Info Percent of long-stay residents whose ability to move independently worsened 17.5%
35% worse than Florida average

Florida average: 12.9%

Low Risk Residents with Bowel/Bladder Incontinence Info Percent of low risk long-stay residents who lose control of their bowels or bladder 21.0%
55% worse than Florida average

Florida average: 13.5%

Falls with Major Injury Info Percent of long-stay residents experiencing one or more falls with major injury 1.9%
30% better than Florida average

Florida average: 2.6%

High Risk Residents with Pressure Ulcers Info Percent of long-stay high risk residents with pressure ulcers 3.9%
27% better than Florida average

Florida average: 5.4%

Urinary Tract Infection Info Percent of long-stay residents with a urinary tract infection 0.3%
69% better than Florida average

Florida average: 0.9%

Lost Too Much Weight Info Percent of long-stay residents who lose too much weight 11.3%
88% worse than Florida average

Florida average: 6.0%

Depressive Symptoms Info Percent of long-stay residents who have depressive symptoms 0.0%
100% better than Florida average

Florida average: 3.3%

Antipsychotic Use Info Percent of long-stay residents who received an antipsychotic medication 6.9%
14% better than Florida average

Florida average: 8.0%

Pneumococcal Vaccine Info Percent of long-stay residents assessed and appropriately given the pneumococcal vaccine 99.7%
In line with Florida average

Florida average: 97.7%

Influenza Vaccine Info Percent of long-stay residents assessed and appropriately given the seasonal influenza vaccine 100.0%
In line with Florida average

Florida average: 99.2%

Short-stay resident measures
Pneumococcal Vaccine Info Percent of short-stay residents assessed and appropriately given the pneumococcal vaccine 95.0%
In line with Florida average

Florida average: 94.0%

Antipsychotic medication increase Info Percent of short-stay residents who newly received an antipsychotic medication 0.0%
100% better than Florida average

Florida average: 1.5%

Influenza Vaccine Info Percent of short-stay residents assessed and appropriately given the seasonal influenza vaccine 95.9%
In line with Florida average

Florida average: 94.7%

Breakdown by payment type

Medicare

15% of new residents, usually for short-term rehab.

Typical stay 30 days

Private pay

63% of new residents, often for short stays.

Typical stay 1 - 2 months

Medicaid

22% of new residents, often for long-term daily care.

Typical stay 7 - 8 months

Facility Characteristics

Source: CMS Long-Term Care Facility Characteristics (Data as of Jan 2026)

Total residents 105
Medicare
25
23.8% of residents
Medicaid
71
67.6% of residents
Private pay or other
9
8.6% of residents
Programs & Services
Residents Group

Residents meet regularly to discuss policies, care quality, and activities

Active Resident Council

Organized group of residents that meets regularly to discuss facility policies, quality of life, and activities.

Finances and operations

Based on CMS SNF Cost Report for fiscal year ending in 12/2023.

For-profit
LLC
Net patient revenue Info Net patient revenue — what the home actually collects for resident care, after contractual allowances, bad debt and discounts are subtracted from its gross charges (CMS cost report, Worksheet G-3). It covers resident care only; money the home earns from other sources is shown separately as "Other income."
$12.4M
Net patient income Info Net patient income: net patient revenue minus the home's total operating expenses. A positive figure means it earns more from resident care than it spends to deliver it; a negative figure means the opposite. It excludes non-operating "other income."
-$118.1K
For-profit LLC
Net patient revenue Info Net patient revenue — what the home actually collects for resident care, after contractual allowances, bad debt and discounts are subtracted from its gross charges (CMS cost report, Worksheet G-3). It covers resident care only; money the home earns from other sources is shown separately as "Other income."
$12.4M Rank #188 / 257Revenue — State benchmarkedThis home is ranked 188th out of 257 homes in Florida. Shows this facility's annual revenue compared to the Florida average. Higher revenue generally means more resources for staffing and capital — read alongside Payroll %.Rankings are based only on facilities in Florida that report data for that category. Facilities without available data are excluded from the ranking.Click the rank badge to see the full State ranking.Click here to see the full State ranking.
Net patient income Info Net patient income: net patient revenue minus the home's total operating expenses. A positive figure means it earns more from resident care than it spends to deliver it; a negative figure means the opposite. It excludes non-operating "other income."
-$118.1K
Other income Info Money the home earns outside of resident care — such as investments, grants, rentals and other non-operating sources (CMS cost report, Worksheet G-3). It is tracked separately from net patient revenue: it is not part of that figure, and it is not included in net patient income.
-$403.7K
Payroll costs Info Staff salaries plus wage-related costs — benefits such as payroll taxes, health insurance and retirement — from the home's own accounting records (CMS cost report, Worksheet A). Contract or agency labor is counted separately, under other operating costs. Rank #195 / 257Payroll — State benchmarkedThis home is ranked 195th out of 257 homes in Florida. Shows total annual staff payroll benchmarked to the Florida average. Higher payroll investment relative to peers often signals better staffing and less reliance on cheaper contract labor.Rankings are based only on facilities in Florida that report data for that category. Facilities without available data are excluded from the ranking.Click the rank badge to see the full State ranking.Click here to see the full State ranking.
$4.9M 39.4% of net patient revenue Info Payroll as a share of revenue: staff salaries and wage-related benefits divided by net patient revenue. A higher figure means more of each revenue dollar goes to staff pay. Rank #122 / 257Payroll % — State benchmarkedThis home is ranked 122nd out of 257 homes in Florida. Shows payroll as a percentage of revenue versus the Florida average. Well-run Florida facilities typically land around 49–56% — the top third Statewide. Below 25% may signal understaffing or heavy agency use — read with Staffing ratings.Rankings are based only on facilities in Florida that report data for that category. Facilities without available data are excluded from the ranking.Click the rank badge to see the full State ranking.Click here to see the full State ranking.
Other operating costs Info Everything it costs to run the home apart from payroll — food, utilities, supplies, maintenance, contract labor and administration. Calculated as total operating expense minus payroll (staff salaries and wage-related benefits).
$7.7M
Total costs Info The home's total operating expense for the year — all the costs of running it, salaries included (CMS cost report, Worksheet G-3).
$12.6M

What does this home offer?

Building type icon
Building type icon

Building Type: Single-story

Personal care icon
Personal care icon

Personal Care Assistance

On-site medical care and health services icon

On-site Medical Care and Health Services

Who this home usually serves

TYPE OF STAY

Primarily long-term care, limited rehab

Most residents stay long-term, while a smaller portion are admitted for short-term rehab.

Most new residents arrive under private pay (63% of admissions), and a typical private pay stay runs around 1 - 2 months.

Admissions
541 total

Coverage residents most often arrive under.

Medicare 15%
Private pay 63%
Medicaid 22%
Discharges
551 total

Coverage residents most often leave under.

Medicare 11%
Private pay 58%
Medicaid 32%

Places of interest near Longwood Health and Rehabilitation Center

Address 1.2 miles from city center Info Estimated distance in miles from Longwood's city center to Longwood Health and Rehabilitation Center's address, calculated via Google Maps.

Calculate Travel Distance to Longwood Health and Rehabilitation Center

Add your location

Address

Compare Nursing Homes around Longwood

The information below is reported by the Florida Agency for Health Care Administration (AHCA).

3 facilities compared · CMS & FL Dept. of Health data

Island Lake Center
NH
PC
RC
Longwood
120
Facility 120
FL AVG 89
Rank #256 / 1074
95.9%
Facility 95.9%
FL AVG 84.3%
Rank #13 / 258
+14%
3.49
Facility 3.49
FL AVG 4.04
Rank #216 / 253
-40%-13%
$0
Facility $0
FL AVG $78.9k
Rank #1 / 258
-
10
Facility 10
FL AVG 19.7
Rank #48 / 252
3.3
Facility 3.3
FL AVG 4.5
Rank #73 / 252
-114-
49
Facility 49
FL AVG 40
Rank #540 / 1486
Stephanie Norsen
$15.2M
Facility $15.2M
FL AVG $15.7M
Rank #171 / 257
$6.4M
Facility $6.4M
FL AVG $6.1M
Rank #150 / 257
42.1%
Facility 42.1%
FL AVG 39.8%
Rank #84 / 257
105643
Life Care Center of Altamonte Springs
NH
Altamonte Springs
228
Facility 228
FL AVG 89
Rank #23 / 1074
95.9%
Facility 95.9%
FL AVG 84.3%
Rank #13 / 258
+14%
4.06
Facility 4.06
FL AVG 4.04
Rank #91 / 253
-25%+1%
$83.5k
Facility $83.5k
FL AVG $78.9k
Rank #231 / 258
-
27
Facility 27
FL AVG 19.7
Rank #190 / 252
5.4
Facility 5.4
FL AVG 4.5
Rank #192 / 252
8217-
62
Facility 62
FL AVG 40
Rank #323 / 1486
Francisco Gonzalez
$22.0M
Facility $22.0M
FL AVG $15.7M
Rank #37 / 257
$14.7M
Facility $14.7M
FL AVG $6.1M
Rank #26 / 257
66.8%
Facility 66.8%
FL AVG 39.8%
Rank #114 / 257
105365
Longwood Health and Rehabilitation Center
NH
HC
RC
Longwood
120
Facility 120
FL AVG 89
Rank #256 / 1074
91.8%
Facility 91.8%
FL AVG 84.3%
Rank #87 / 258
+9%
4.63
Facility 4.63
FL AVG 4.04
Rank #50 / 253
+8%+15%
$16.8k
Facility $16.8k
FL AVG $78.9k
Rank #195 / 258
-
35
Facility 35
FL AVG 19.7
Rank #235 / 252
5.0
Facility 5.0
FL AVG 4.5
Rank #164 / 252
6104-
49
Facility 49
FL AVG 40
Rank #540 / 1486
Longwood Operations Holdings LLC
$12.4M
Facility $12.4M
FL AVG $15.7M
Rank #188 / 257
$4.9M
Facility $4.9M
FL AVG $6.1M
Rank #195 / 257
39.4%
Facility 39.4%
FL AVG 39.8%
Rank #122 / 257
105377

Financial Assistance for
Nursing Home in Florida

Longwood Health and Rehabilitation Center is located in Longwood, Florida.
Here are the financial assistance programs available to residents in Florida.

Get Financial aid guidance

Long-Term Care Waiver

Florida Medicaid LTC Waiver

Age 65+ or 21+ disabled
General Florida resident, Medicaid- eligible, nursing home-level care need.
Income Limits (2025) ~$2,829/month 300% FBR, individual
Asset Limits $2,000 (individual), $3,000 (couple).
FL

High demand; waitlists common.

Benefits
In-home care (6-8 hours/day) Assisted living Respite (240 hours/year) Case management

Community Care for the Elderly (CCE)

Florida CCE

Age 60+
General Florida resident, at risk of nursing home.
Income Limits ~$2,000/month varies
Asset Limits $5,000 individual
FL

Limited funding; regional variation.

Benefits
Homemaker services (3-5 hours/week) Adult day care (~$60/day) Respite (up to 10 days/year)

Home Care for the Elderly (HCE)

Florida Home Care for the Elderly

Age 60+
General Florida resident, at risk of nursing home placement; caregiver must be approved.
Income Limits (2025) ~$2,829/month individual, aligned with Medicaid thresholds
Asset Limits ~$2,000 (individual); varies by case manager discretion.
FL

Limited funding (~3,500 served annually); prioritizes low-income frail seniors.

Benefits
Basic subsidy (~$160/month) for housing/medical costs; special subsidies for supplies/services (e.g., incontinence supplies, ~$50-$200/month)

Program of All-Inclusive Care for the Elderly (PACE)

Florida Medicaid PACE

Age 55+
General Florida resident, nursing home-level care need, safe with PACE support.
Income Limits (2025) ~$2,829/month 300% FBR
Asset Limits $2,000 (individual), $3,000 (couple).
FL

Limited to specific counties (e.g., Hillsborough, Miami-Dade); ~10 sites statewide.

Benefits
Personal care (5-7 hours/day) Medical care Meals Transportation Therapy

Optional State Supplementation (OSS)

Florida Optional State Supplementation

Age 65+ or disabled
General Florida resident, living in approved facility, receiving SSI or low-income.
Income Limits (2025) ~$1,004/month individual, including SSI
Asset Limits $2,000 (individual), $3,000 (couple).
FL

Limited to specific facility types; ~$78.40/month max supplement.

Benefits
Cash payment (~$78.40/month) for room/board or personal needs in facilities

Frequently Asked Questions about Longwood Health and Rehabilitation Center

Is Longwood Health and Rehabilitation Center in a walkable area?

Longwood Health and Rehabilitation Center has a walk score of 49. Somewhat walkable. A few nearby services may be reachable on foot, but most trips require transportation.

What is the occupancy rate at Longwood Health and Rehabilitation Center?

Longwood Health and Rehabilitation Center's occupancy is 91.8%.

What is the best email address for Longwood Health and Rehabilitation Center?

The team at Longwood Health and Rehabilitation Center can be reached at ashtomas@longwoodhrc.com.

Does Longwood Health and Rehabilitation Center operate as a for-profit or non-profit?

Longwood Health and Rehabilitation Center is registered as a for-profit.

Are there photos of Longwood Health and Rehabilitation Center?

Yes — there are 4 photos of Longwood Health and Rehabilitation Center in the photo gallery on this page.

What is the address of Longwood Health and Rehabilitation Center?

Longwood Health and Rehabilitation Center is located at 1520 S Grant St, Longwood, FL 32750.

What is the phone number of Longwood Health and Rehabilitation Center?

(407) 339-9200 will put you in contact with the team at Longwood Health and Rehabilitation Center.

Guides for Better Senior Living

Care Cost Calculator: See Prices in Your Area

Nursing Home Data Explorer

Don’t Wait Too Long: 7 Red Flag Signs Your Parent Needs Assisted Living Now

The True Cost of Assisted Living in 2025 – And How Families Are Paying For It

Understanding Senior Living Costs: Pricing Models, Discounts & Financial Assistance