Explore Open Rooms

1 Contact details
2 What type of senior care service are you looking for?
3 What budget do you have in mind for senior care?
4 How soon do you need to find care?
5 Additional details

Thank you for your interest!

Our team will be in touch shortly to help with next steps.

Nursing Home

Lorien Columbia

Nursing Home

Lorien Columbia

6334 Cedar Ln, Columbia, MD 21044 View map
Overview of Lorien Columbia

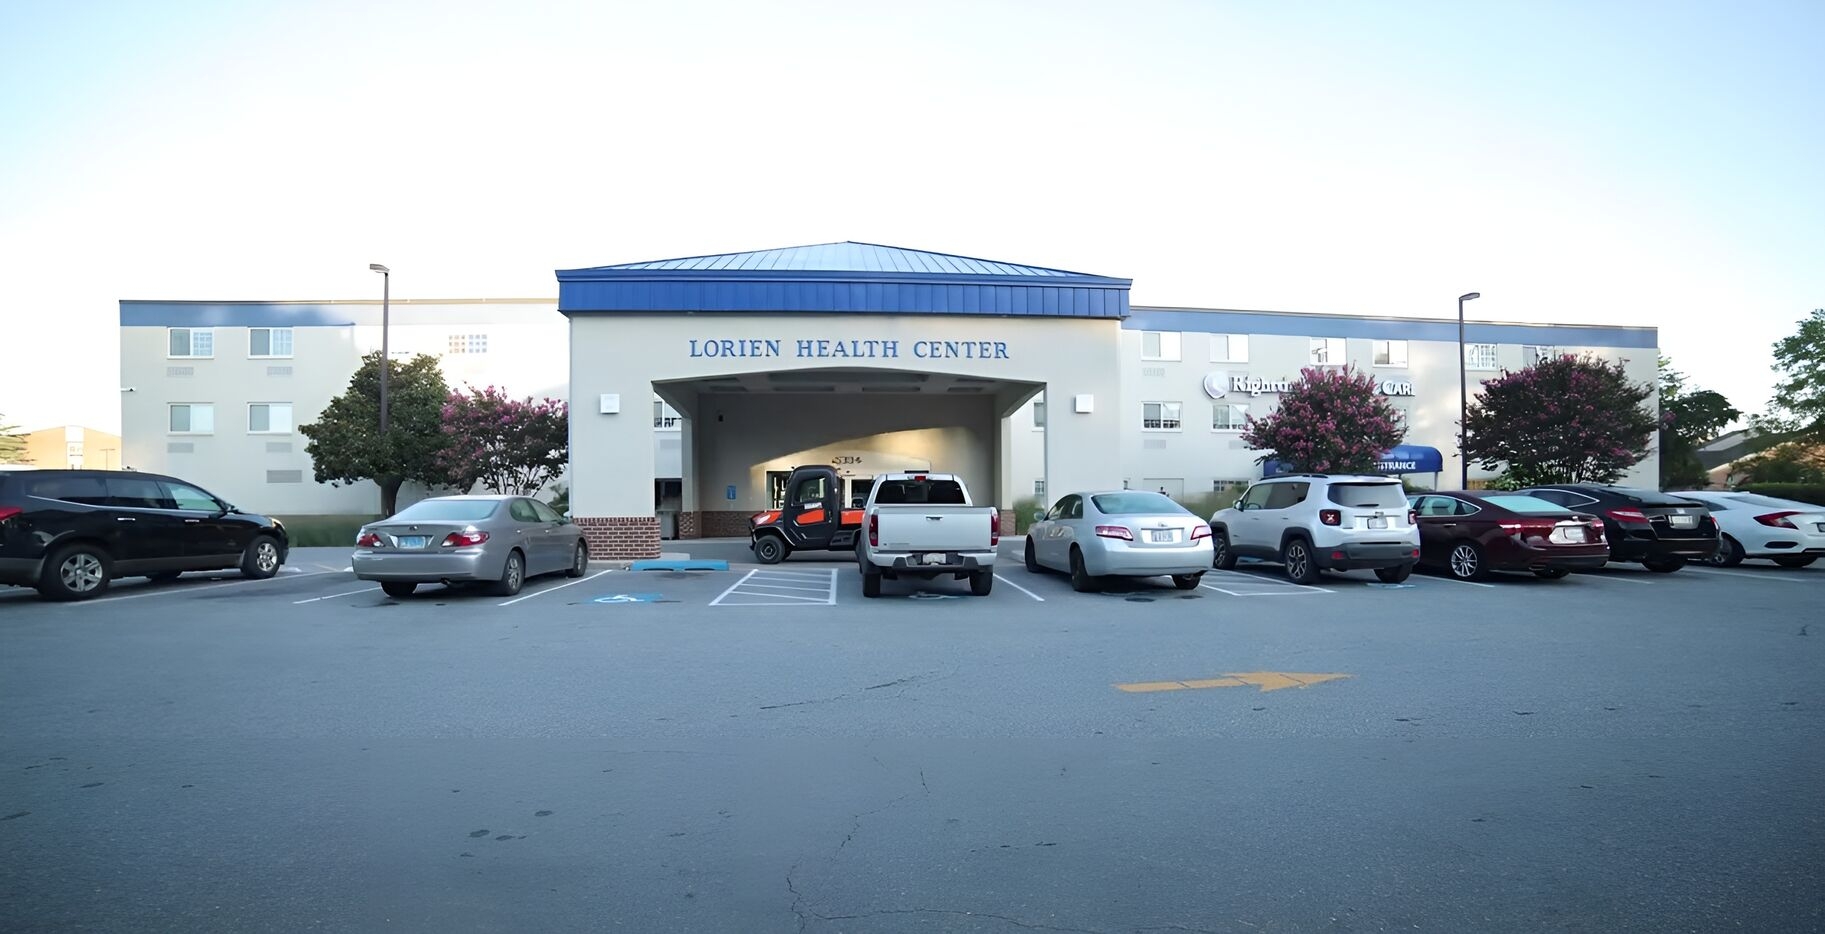
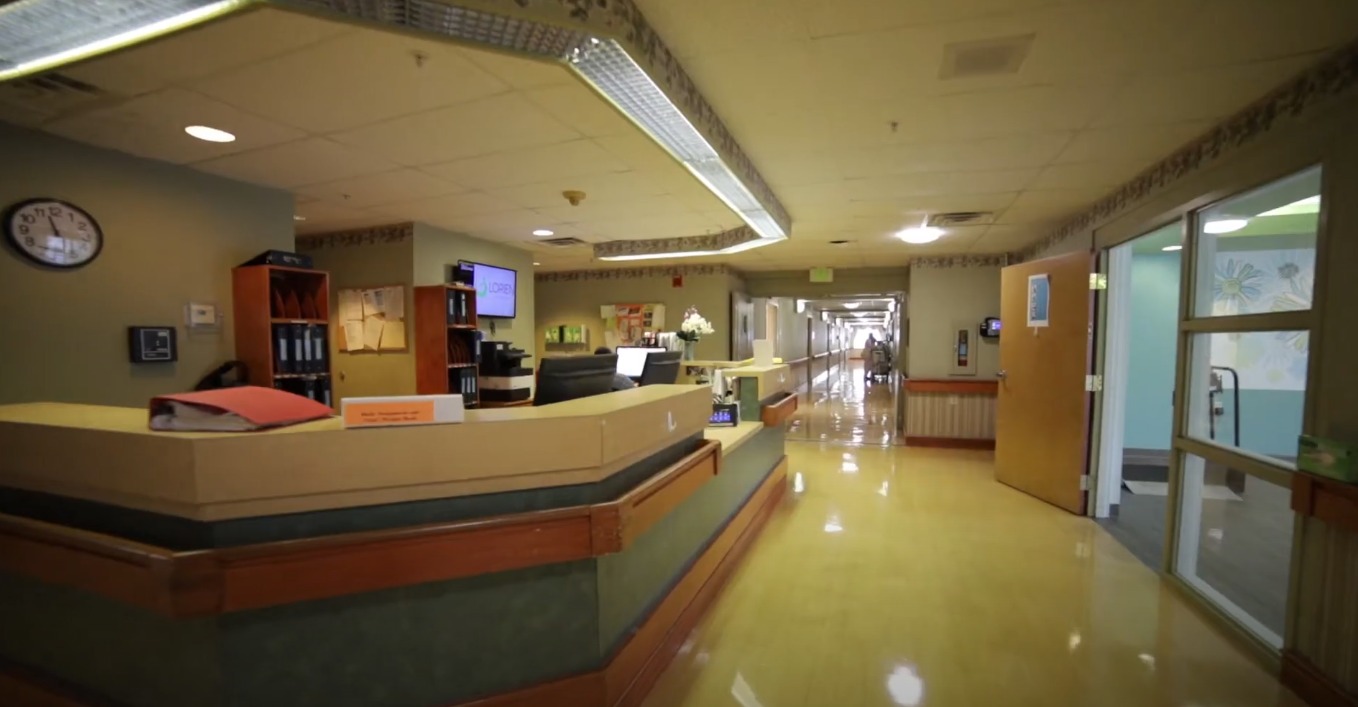
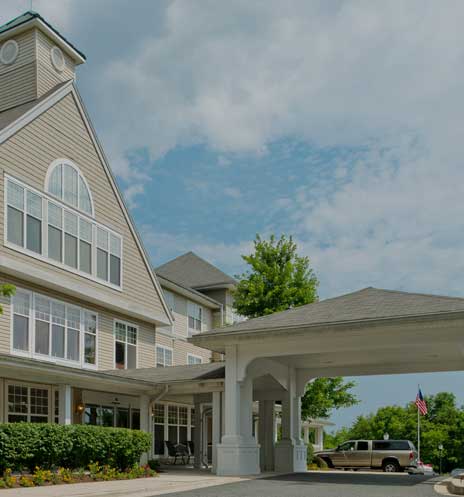
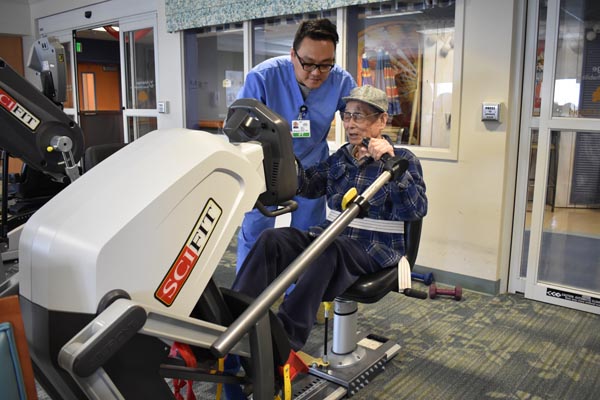
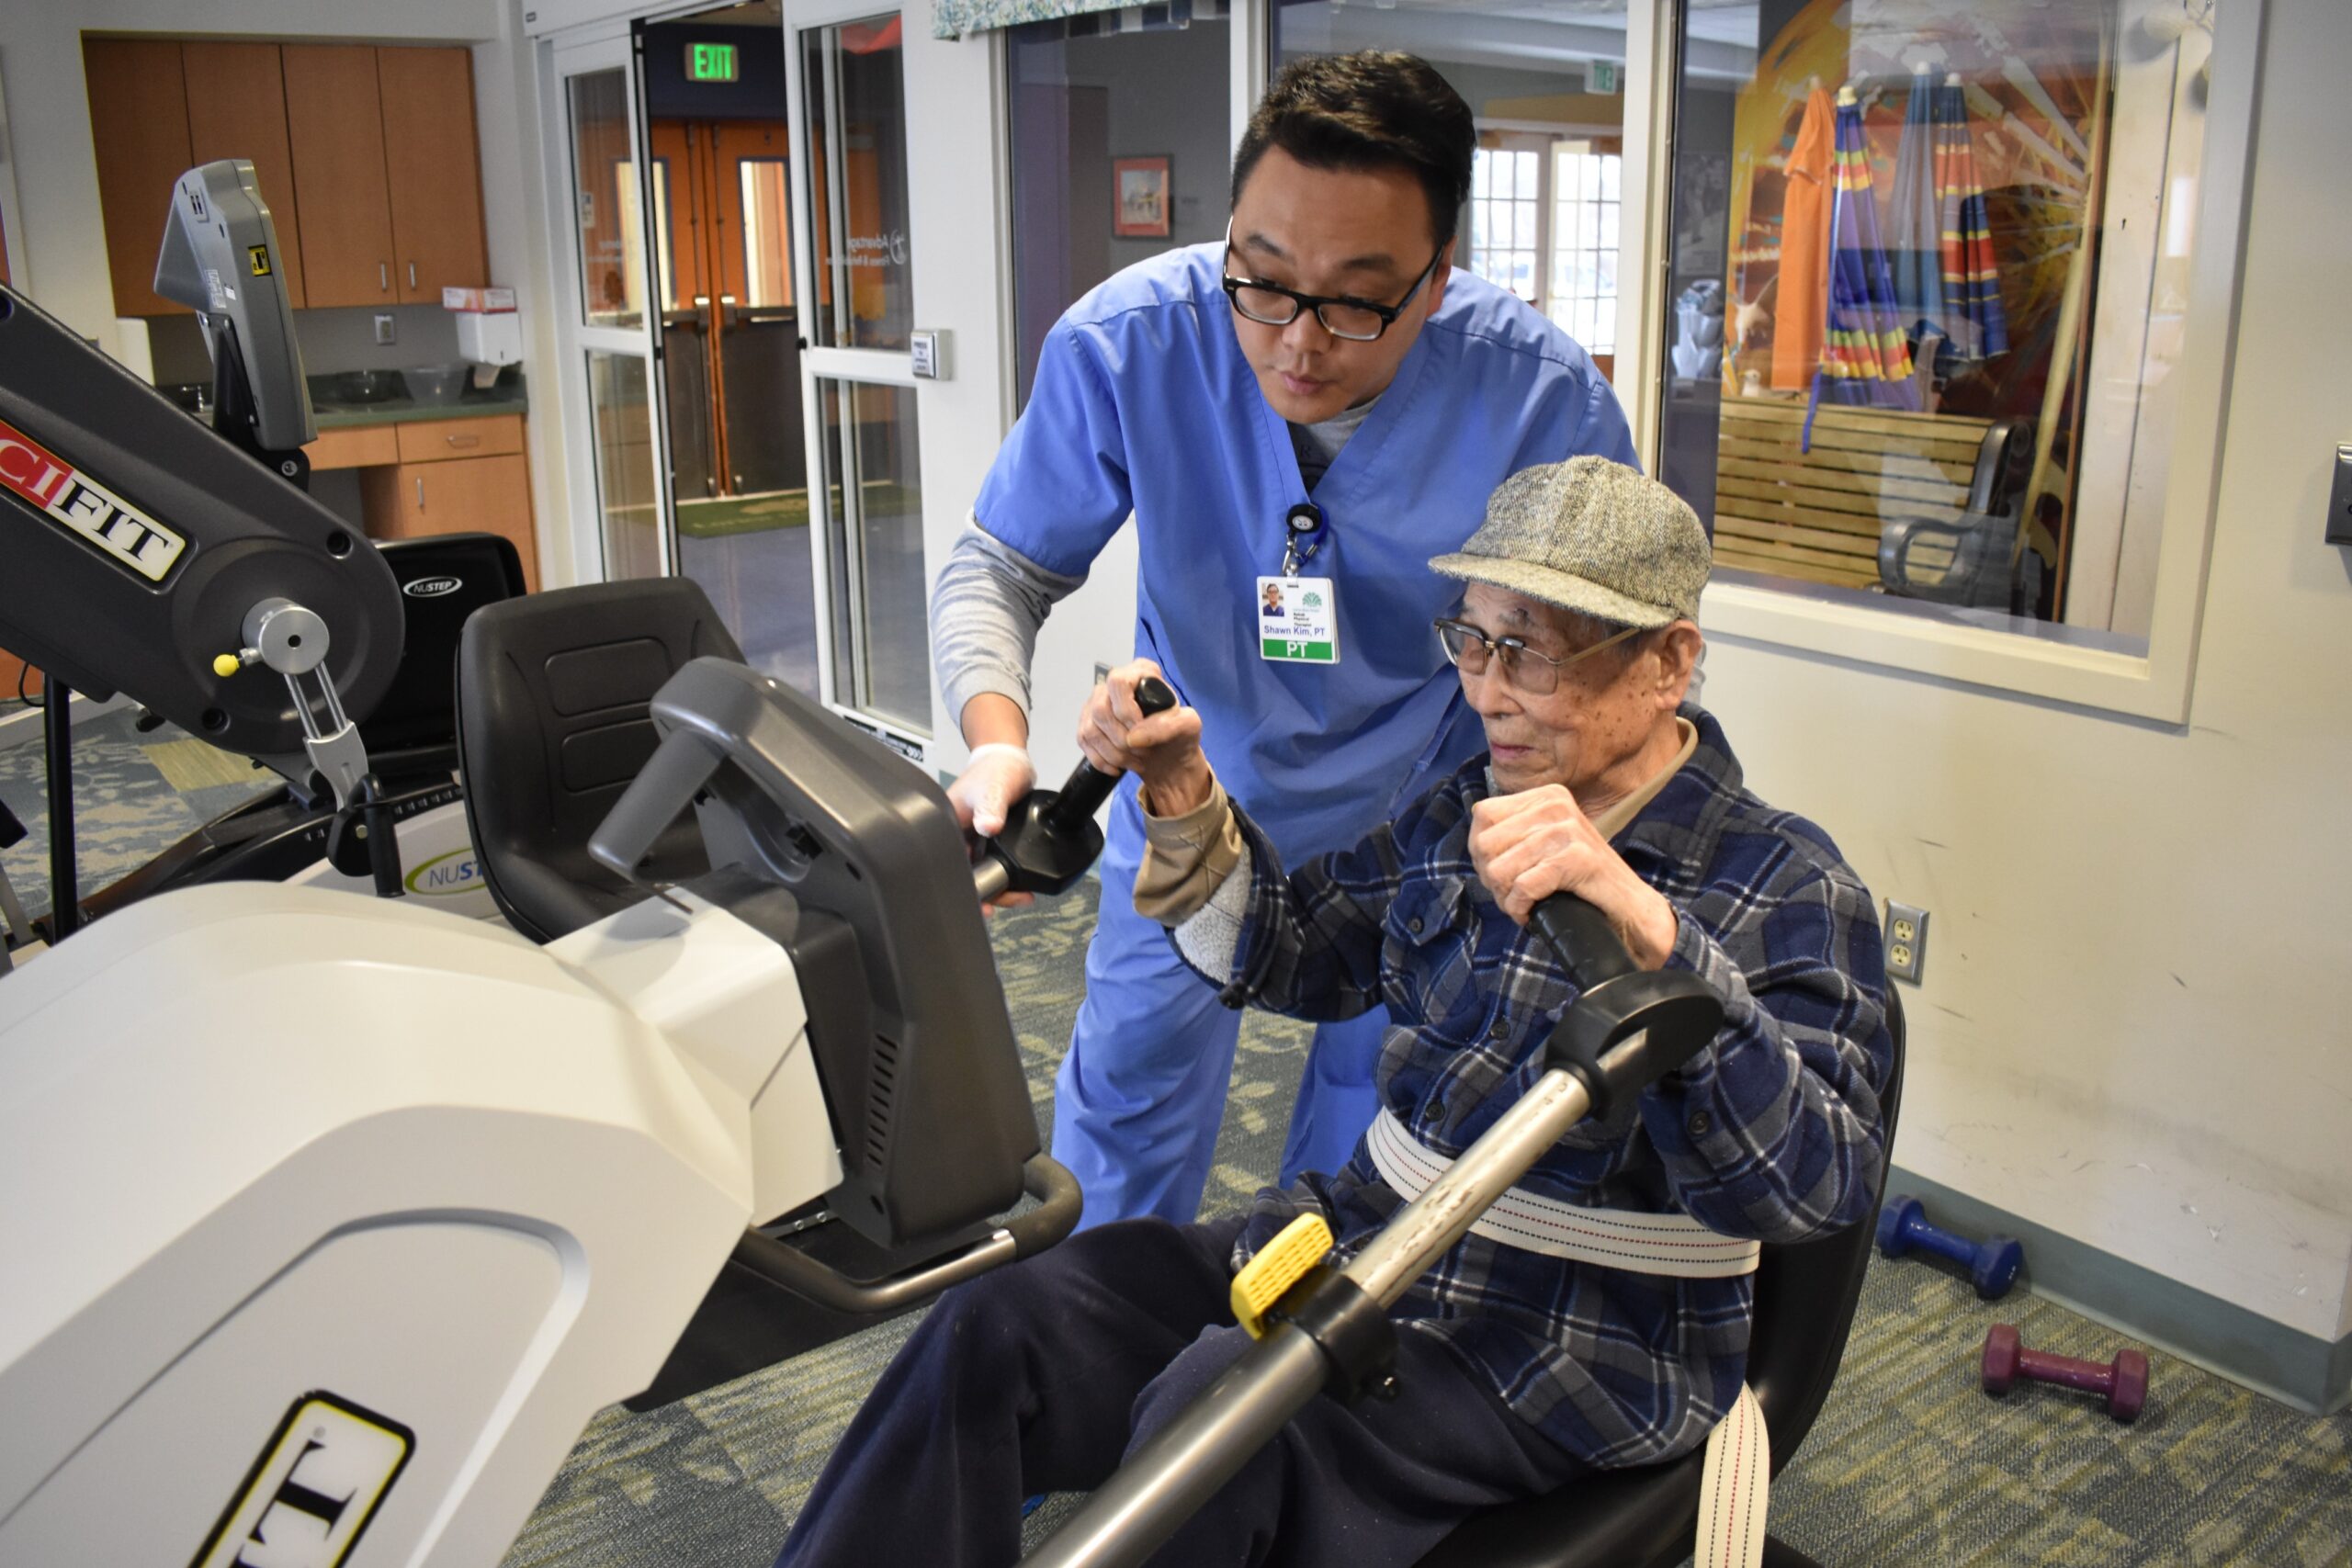
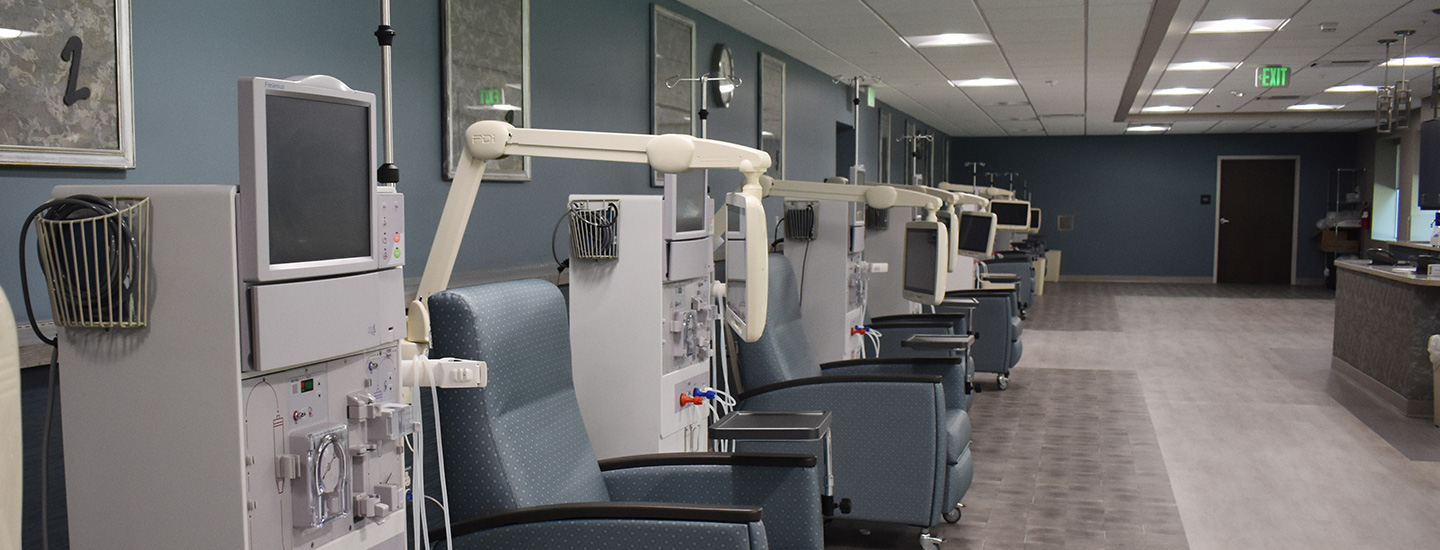
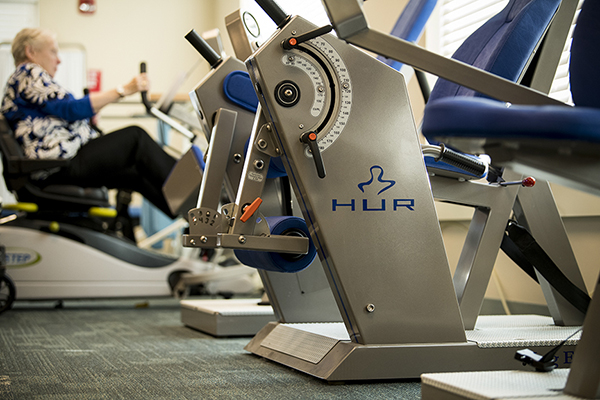
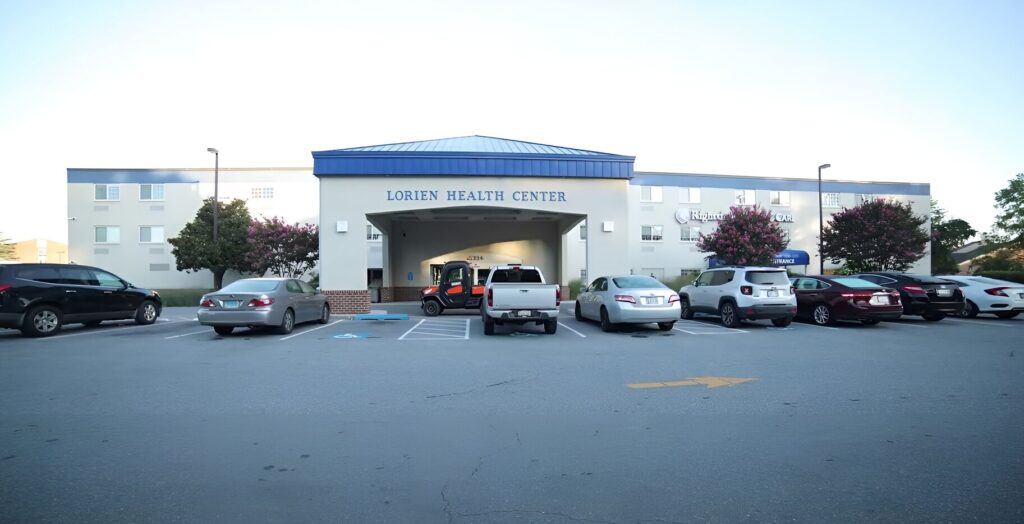
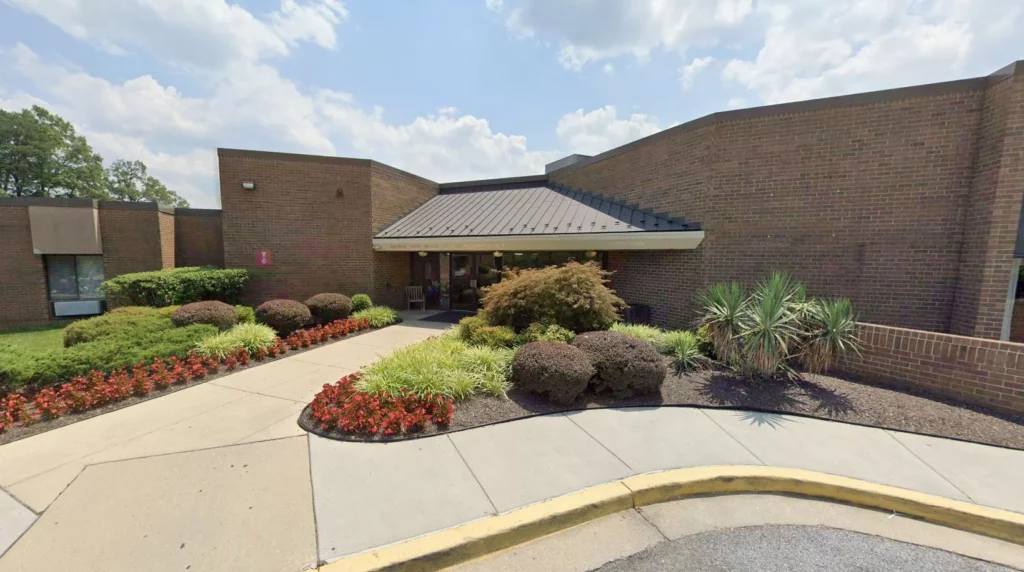
Lorien Columbia set in the quiet Cedar Lane, Columbia, MD, is a community that focuses on assisted living and skilled nursing. The community provides 24-hour care, alongside other services like physical, occupational, and speech therapy, for those who need them. Residents find the care they need with the community’s comprehensive services.

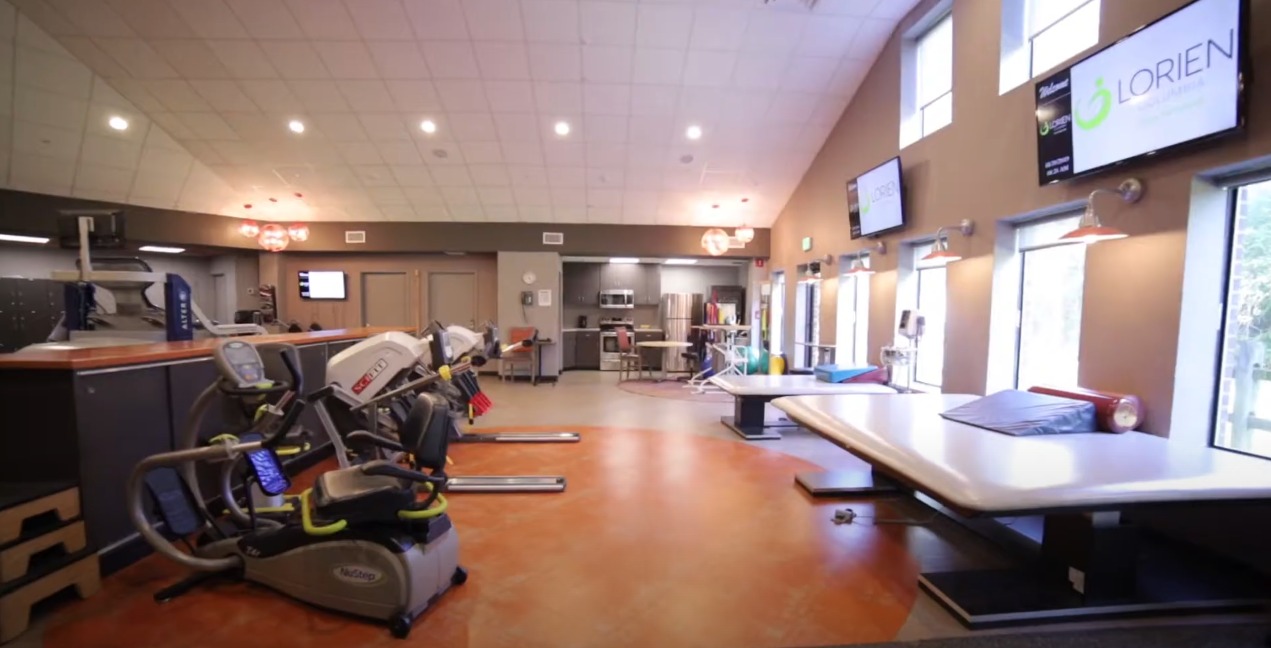
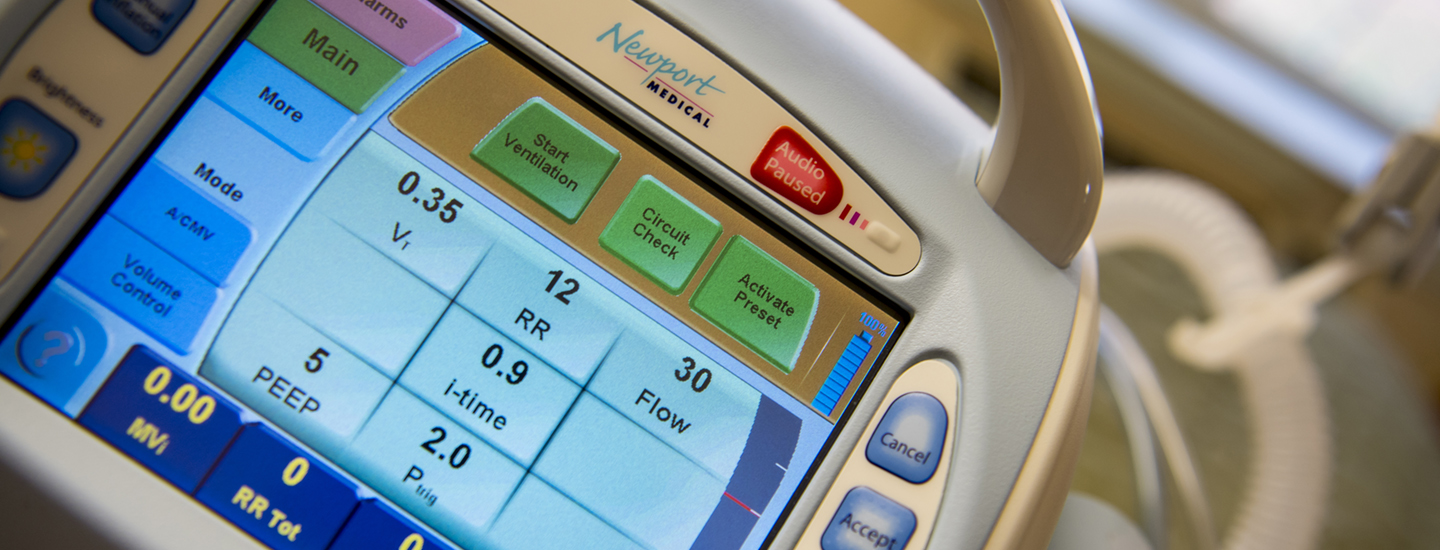
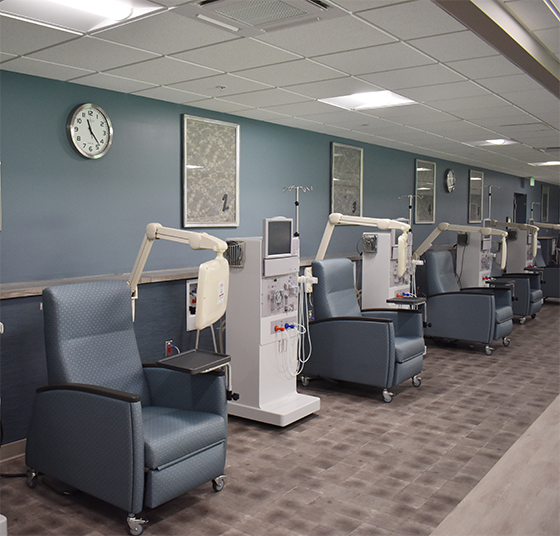
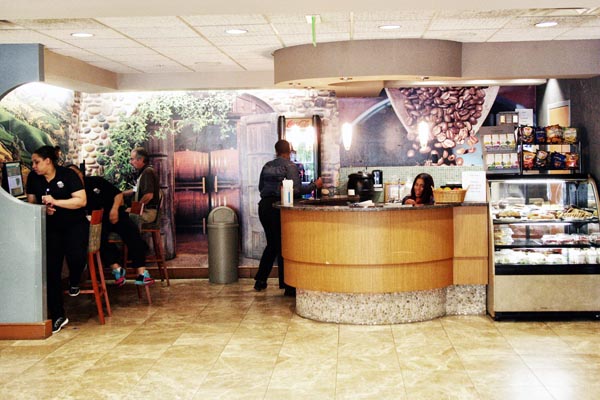
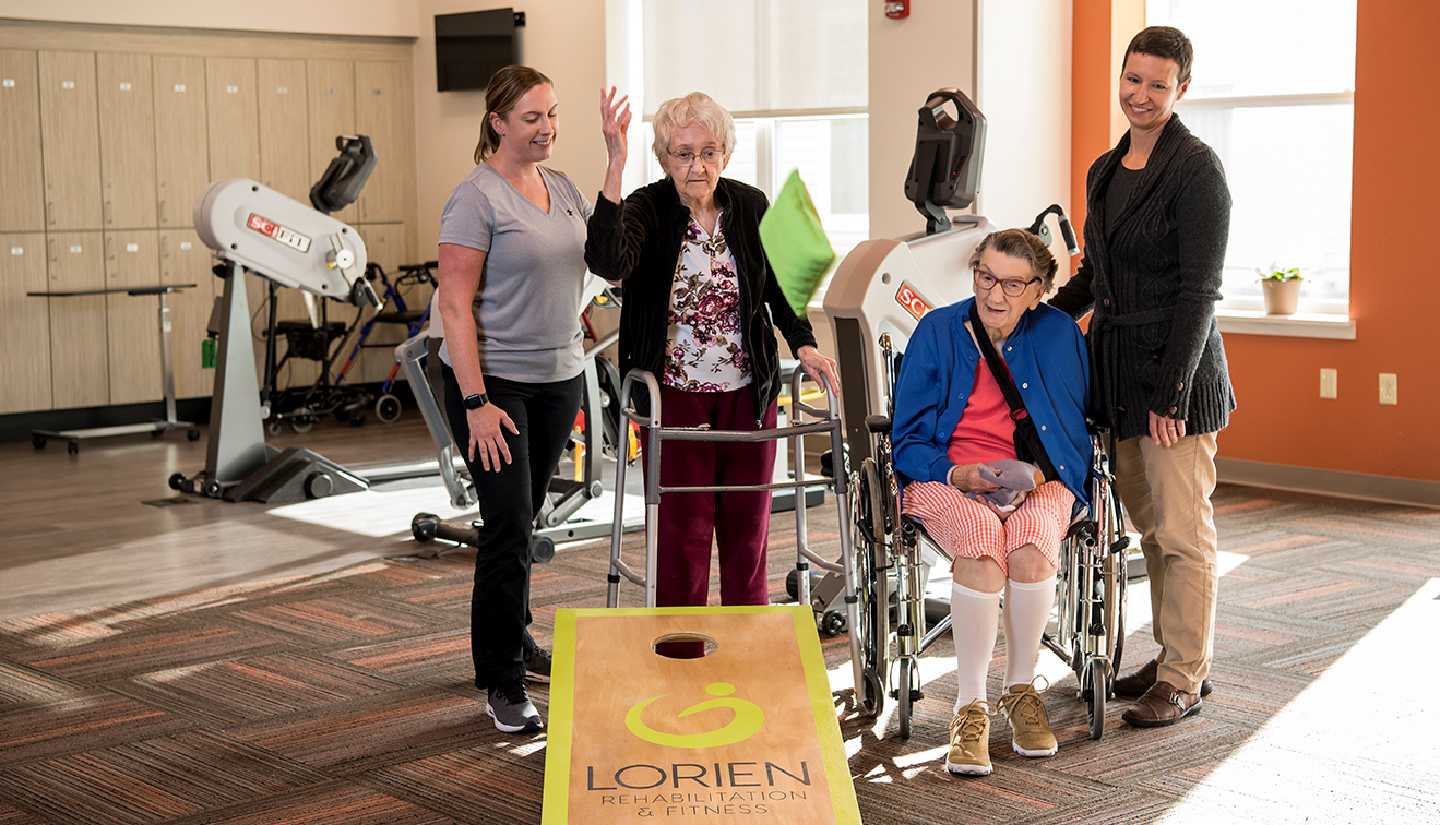
Here, residents are encouraged to participate in activities and trips curated for their wellness. Respite care, wound care, onsite dialysis, tracheotomy care, IV therapy, and dialysis are also available onsite to meet residents’ specific needs. With restaurant-style dining, residents’ special diets are accommodated while meeting their tastes with diverse dining options. Amenities include a cafe, a gym, a salon, and furnished accommodations.

Quality ratings

Measured by Centers for Medicare & Medicaid Services (CMS)

Overall rating Info The Overall CMS Rating combines results from health inspections, staffing levels and quality measures. Health inspections carry the most weight. Staffing and quality scores can increase or decrease the final rating based on performance compared to state and national standards.
3/5
Maryland average: 3.0/5
Health Inspection Info Based on the results of the facility's three most recent standard inspections and any complaint investigations. CMS reviews the number, scope, and severity of deficiencies, with more recent findings weighted more heavily.
3/5
Maryland average: 2.8/5
Staffing Info Measures average nursing staff hours per resident per day, including Registered Nurses (RNs) and total nursing staff. Ratings are adjusted based on the level of care residents require and are compared to state and national benchmarks.
4/5
Maryland average: 3.0/5
Quality Measures Info Based on clinical and physical health indicators reported to CMS, such as hospital readmissions, falls, pressure ulcers, and improvements in mobility. These measures reflect how well residents' health needs are being managed.
2/5
Maryland average: 3.7/5

Nursing care per resident

Info This shows how many total hours of nursing staff time are available per resident each day. Higher numbers usually mean more staff support.
3h 47m per day

This home provides 0% more nursing time per resident than the Maryland average.

Maryland average: 3h 46m per day

Staffing hours breakdown

Info Hours of care per resident per day, broken down by staff type. Data from CMS Medicare.
Staff type Facility State avg National avg
Registered Nurse (RN) Info Registered nurse hours per resident per day. 50m per day 50m per day 41m per day
Nurse Aide Info Nurse aide hours per resident per day. 2h 6m per day 2h 10m per day 2h 21m per day
Total Nursing (Weekend) Info Total number of nurse staff hours per resident per day on weekends. 3h 44m per day 3h 29m per day 3h 26m per day
Physical Therapist Info Physical therapist staff hours per resident per day. 2m per day 5m per day 4m per day
RN (Weekend) Info Registered nurse hours per resident per day on weekends. 35m per day 37m per day 29m per day

Capacity and availability

This home usually has limited availability

Occupancy is moderate, suggesting balanced demand.

Similar demand to the Maryland average
Occupancy rate 90.8%
Residents per day (avg) 195
Occupancy rate
90.8%
Residents per day (avg)
195

Who this home usually serves

TYPE OF STAY

Mostly short-term rehab stays

Most residents typically stay for a few weeks or months before returning home or moving on.

Might be optimal for
Short stays Recovery Medicare-covered care

Breakdown by payment type

Medicare

55% of new residents, usually for short-term rehab.

Typical stay 23 days

Private pay

30% of new residents, often for short stays.

Typical stay 26 days

Medicaid

15% of new residents, often for long-term daily care.

Typical stay 9 - 10 months

Finances and operations

Privately-owned community
Operated by a business corporation.
Home revenue
$35.7M
Profit
$522.2K
Privately-owned community Operated by a business corporation.
Home revenue
$35,675,740.00
Profit
$522,209.00
Payroll costs Info The portion of the home's budget spent on staff, including nurses, caregivers, and other employees who support care and operations.
$13.2M
37% of revenue
Other operating costs Info All remaining costs needed to run the home, such as food, utilities, building maintenance, supplies and administrative expenses.
$22.0M
Total costs $35.2M
Walk Score
Walk Score: 52 / 100
Moderately walkable. Some errands can be accomplished on foot, with a mix of nearby amenities.

About this community

Additional licensing details

Awards: Best Nursing Home for 2018-19 by the US News and World Report, Top Winner in the 2025 Daily Record Reader Rankings, Purple Flag accreditation in Maryland.

Care Services

Nursing Services
Rehabilitation Services
Respite Care
Skilled Nursing
24-Hour Staffing

Pricing & Financial Information

Dining & Nutrition

Food Description
Restaurant style dining and café available.
Special Diets
Yes

What does this home offer?

Accepts Medicaid icon

Accept Medicaid: Yes, Accept

Total residents icon

Total Residents: 205 Residents

Housing options icon

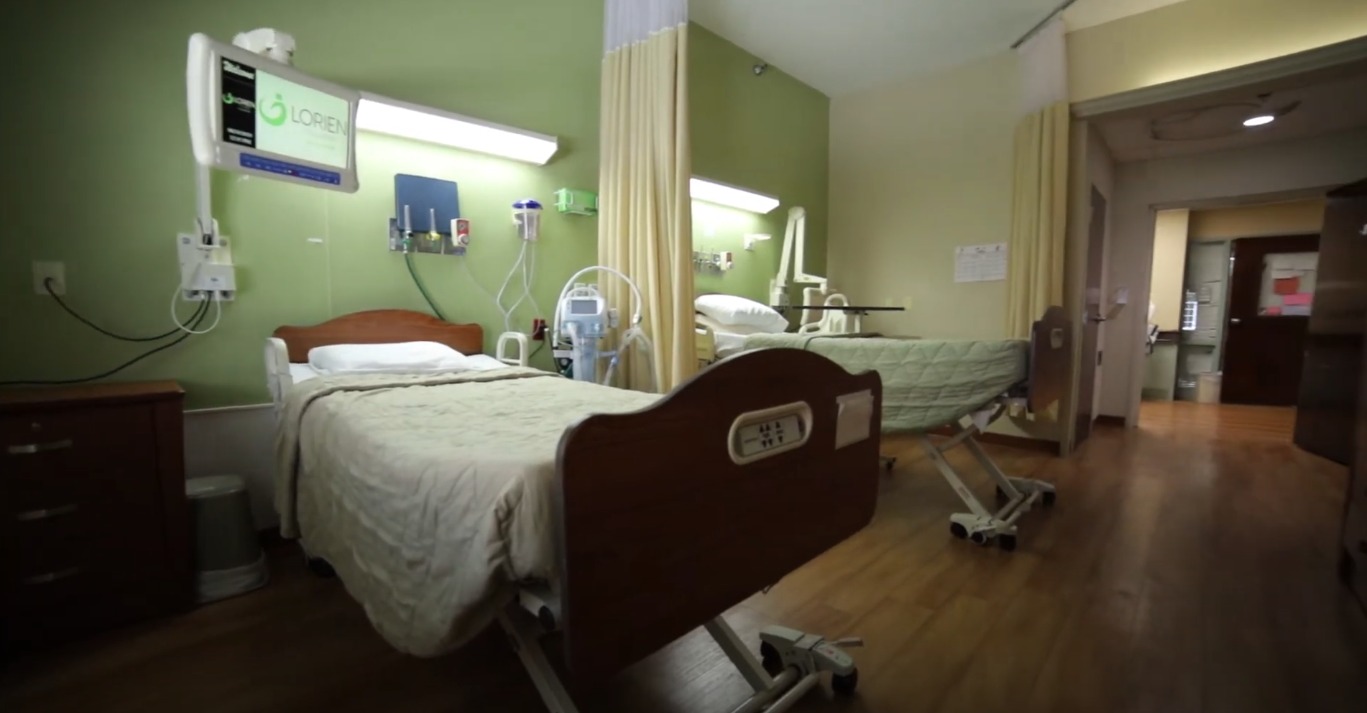
Housing Options: Private / Semi-Private Rooms

Building type icon
Building type icon

Building Type: 3-story
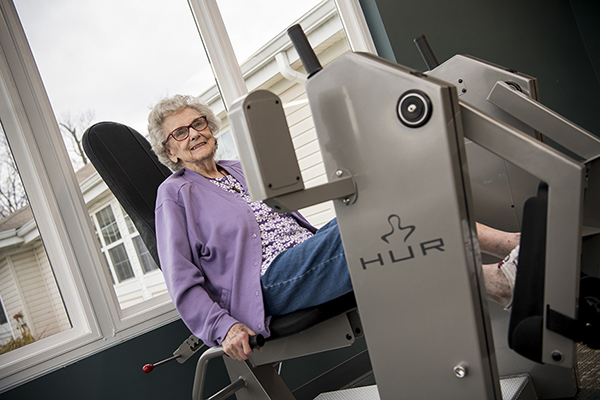
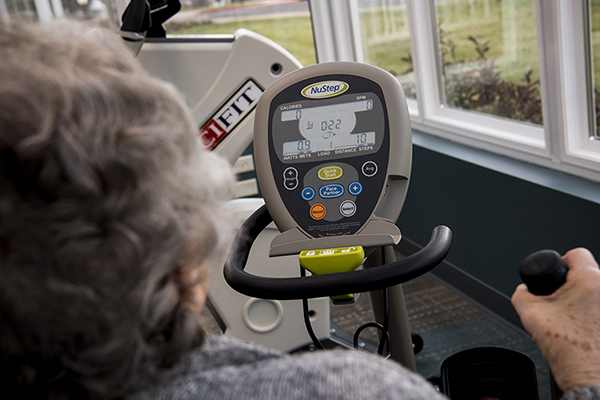
Wellness program icon

Wellness Program

Types of Care at Lorien Columbia

Nursing Home Skilled Nursing Assisted Living
Contact Lorien Columbia
icon Rare Find!

This senior community typically operates at full capacity. Congratulations! Secure your reservation now!

Reserve Now

Health Inspection History

Inspections
Total health inspections 4

Maryland average 3.9


Last Health inspection on Sep 2025

Total health citations 36

Maryland average 49.9

Citations per inspection
9

Maryland average 12.81


Health citations are formal notices following inspections when they fail to comply with safety and care standards.

23 of 36 citations resulted from standard inspections; 10 of 36 resulted from complaint investigations; and 3 of 36 came from combined inspections (standard and complaint).

Breakdown of citation severity (last 3 years)
Critical Health citations More info 1
100% worse than Maryland average

Maryland average: 0.5


Serious Health citations More info 0
100% better than Maryland average

Maryland average: 0.6

1 critical citation More info Maryland average: 0.5

0 serious citations More info Maryland average: 0.6

35 moderate citations More info Maryland average: 47.2

0 minor citations More info Maryland average: 1.7
Citations history (last 3 years)
Abuse/Neglect moderate citation Info Issues related to protecting resident's from harm, including abuse, neglect, or mistreatment. Sep 29, 2025

Pharmacy moderate citation Info Issues related to medication management, including how drugs are stored, administered, and monitored. Sep 29, 2025

Quality of Care moderate citation Info Issues related to how well residents receive appropriate treatment and support for their medical and daily care needs. Sep 29, 2025

Quality of Care moderate citation Info Issues related to how well residents receive appropriate treatment and support for their medical and daily care needs. Sep 29, 2025

Compare Nursing Homes around Columbia The information below is reported by the Maryland Department of Health, Office of Health Care Quality.

3 facilities compared · CMS & MD Dept. of Health data · Updated Mar 2026

Lorien Columbia
AL

Assisted Living A licensed, long-term care setting for seniors or individuals with disabilities who need help with daily activities — like bathing, dressing, and medication management — but not 24-hour skilled nursing. Offers housing, meals, and around-the-clock support while aiming to maximize resident independence.

IL

Independent Living Lifestyle-focused communities for older adults offering dining, activities, and transportation with minimal personal care. Best for active, independent seniors who want community without medical support.

MC

Memory Care Secured, specialized care for people living with Alzheimer's or dementia. Staff trained in cognitive impairment, with higher staff-to-resident ratios and an environment designed to reduce confusion and wandering risk.

NH

Nursing Home Licensed facility providing 24/7 skilled nursing care for residents with complex, ongoing medical needs. Staffed by RNs, LPNs, and CNAs. Inspected and star-rated annually by CMS. Accepts Medicare (short-term rehab) and Medicaid (long-term care).

Columbia (Hickory Ridge)
205
90.8%
+10%
3.79
-36%
0%
1
36
1
195
52
Collison, Michele
$35,6M
$13,2M
37%
215112
Private / Semi-Private Rooms
Autumn Lake Healthcare at Patuxent River
HC

Home Care Professional care delivered in the person's own home — from companionship and errands to skilled nursing and therapy. Allows seniors to age in place. Medicare covers skilled home health when medically necessary.

NH

Nursing Home Licensed facility providing 24/7 skilled nursing care for residents with complex, ongoing medical needs. Staffed by RNs, LPNs, and CNAs. Inspected and star-rated annually by CMS. Accepts Medicare (short-term rehab) and Medicaid (long-term care).

Beltsville
153
86.4%
+5%
3.17
+32%
-16%
1
56
1
130
22
14200 Laurel Park Drive Holdco Llc
$19,9M
$1,1M
5.7%
215141
Private / Semi-Private Rooms
Cedar Place
-
IL

Independent Living Lifestyle-focused communities for older adults offering dining, activities, and transportation with minimal personal care. Best for active, independent seniors who want community without medical support.

MC

Memory Care Secured, specialized care for people living with Alzheimer's or dementia. Staff trained in cognitive impairment, with higher staff-to-resident ratios and an environment designed to reduce confusion and wandering risk.

NH

Nursing Home Licensed facility providing 24/7 skilled nursing care for residents with complex, ongoing medical needs. Staffed by RNs, LPNs, and CNAs. Inspected and star-rated annually by CMS. Accepts Medicare (short-term rehab) and Medicaid (long-term care).

Columbia
-
-
-
-
-
-
-
-
-
0
0
0
-
-
-
-
-
-
-
Private / Semi-Private Rooms

Places of interest near Lorien Columbia

Address 4.0 miles from city center

Address 6334 Cedar Ln, Columbia, MD 21044

Calculate Travel Distance to Lorien Columbia

Add your location

Address

Staffing Data (Q2 2025)

This data corresponds to Q2 2025 and is based on CMS Payroll-Based Journal.

Total staff 413
Employees 231
Contractors 182
Staff to resident ratio 2.16:1
20% better than Maryland average

Maryland average ratio: 1.81:1

Avg staff/day 123
Average shift 7.8 hours
0% compared with Maryland average

Maryland average: 8 hours

Total staff hours (quarter) 87,742
Nursing staff breakdown
Registered Nurse

Manages medical care and health needs.

Total count 35
Average shift length Info Average shift length. Calculated as total hours divided by days worked and average staff per day. 8.2 hours

No contractors work on this role.

Licensed Practical Nurse

Assists with medical care and medications.

Total count 86
Average shift length Info Average shift length. Calculated as total hours divided by days worked and average staff per day. 8.4 hours

This role is partially covered by contractors.

Certified Nursing Assistant

Helps with daily care and mobility.

Total count 173
Average shift length Info Average shift length. Calculated as total hours divided by days worked and average staff per day. 7.7 hours

This role is partially covered by contractors.

Contractor staffing

Total hours from contractors

17.6%

15,409 contractor hours this quarter

Certified Nursing Assistant: 97 Licensed Practical Nurse: 39 Physical Therapy Assistant: 9 Physical Therapy Aide: 8 Respiratory Therapy Technician: 8 Qualified Activities Professional: 6 Speech Language Pathologist: 6 Qualified Social Worker: 6 Medication Aide/Technician: 1 Medical Director: 1 Occupational Therapy Assistant: 1
Staff by category
Certified Nursing Assistant769717333,03191100%7.7
Licensed Practical Nurse47398618,58291100%8.4
Registered Nurse3503511,23391100%8.2
Clinical Nurse Specialist150153,8768796%7.4
Nurse Aide in Training110112,79091100%7.7
Other Dietary Services Staff8082,77091100%7.8
Qualified Activities Professional106162,47491100%8.4
Medication Aide/Technician111121,7348998%7.8
RN Director of Nursing6061,7058897%9
Mental Health Service Worker5051,5916774%7.6
Physical Therapy Assistant0991,4217481%7.3
Speech Language Pathologist0661,3546875%7.3
Occupational Therapy Aide3031,0936369%7.6
Physical Therapy Aide0881,0258391%7
Qualified Social Worker0667826976%6.2
Respiratory Therapy Technician0887317582%6.7
Nurse Practitioner1014966470%7.7
Dietitian1014776571%7.3
Administrator1013845358%7.2
Dental Services Staff1011041314%8
Occupational Therapy Assistant0115467%9
Medical Director011351516%2.3
173 Certified Nursing Assistant
% of Days 100%
86 Licensed Practical Nurse
% of Days 100%
35 Registered Nurse
% of Days 100%
15 Clinical Nurse Specialist
% of Days 96%
11 Nurse Aide in Training
% of Days 100%
8 Other Dietary Services Staff
% of Days 100%
16 Qualified Activities Professional
% of Days 100%
12 Medication Aide/Technician
% of Days 98%
6 RN Director of Nursing
% of Days 97%
5 Mental Health Service Worker
% of Days 74%
9 Physical Therapy Assistant
% of Days 81%
6 Speech Language Pathologist
% of Days 75%
3 Occupational Therapy Aide
% of Days 69%
8 Physical Therapy Aide
% of Days 91%
6 Qualified Social Worker
% of Days 76%
8 Respiratory Therapy Technician
% of Days 82%
1 Nurse Practitioner
% of Days 70%
1 Dietitian
% of Days 71%
1 Administrator
% of Days 58%
1 Dental Services Staff
% of Days 14%
1 Occupational Therapy Assistant
% of Days 7%
1 Medical Director
% of Days 16%

Facility Characteristics

Source: CMS Long-Term Care Facility Characteristics (Data as of Jan 2026)

Total census
191 residents
Residents by payment source
Medicare
45 residents (23.6%)
Medicaid
137 residents (71.7%)
Private pay or other
9 residents (4.7%)
Programs & Services
Residents' Group

Residents meet regularly to discuss policies, care quality, and activities

Active Resident Council

Organized group of residents that meets regularly to discuss facility policies, quality of life, and activities.

Quality of care over time

These measures show how residents usually do over time at this home, based on health outcomes and preventive care.

High-risk clinical events score Info A composite score based on pressure ulcers, falls with injury, weight loss, walking ability decline, and activities of daily living decline. 17.5
35% worse than Maryland average

Maryland average: 12.9

Functional decline score Info A composite score based on activities of daily living decline, walking ability decline, and incontinence. 27.8
8% worse than Maryland average

Maryland average: 25.7

Long-stay resident measures
Below average Maryland avg: 3.8 Info CMS star rating based on long-stay quality measure performance. 5 stars = significantly above average, 1 star = significantly below average.
Need for Help with Daily Activities Increased Info Percent of long-stay residents whose need for help with daily activities has increased 24.3%
In line with Maryland average

Maryland average: 23.7%

Walking Ability Worsened Info Percent of long-stay residents whose ability to move independently worsened 40.6%
47% worse than Maryland average

Maryland average: 27.7%

Low Risk Residents with Bowel/Bladder Incontinence Info Percent of low risk long-stay residents who lose control of their bowels or bladder 18.4%
29% better than Maryland average

Maryland average: 25.9%

Falls with Major Injury Info Percent of long-stay residents experiencing one or more falls with major injury 2.2%
5% better than Maryland average

Maryland average: 2.3%

High Risk Residents with Pressure Ulcers Info Percent of long-stay high risk residents with pressure ulcers 8.3%
27% worse than Maryland average

Maryland average: 6.5%

Urinary Tract Infection Info Percent of long-stay residents with a urinary tract infection 2.9%
79% worse than Maryland average

Maryland average: 1.6%

Lost Too Much Weight Info Percent of long-stay residents who lose too much weight 12.0%
107% worse than Maryland average

Maryland average: 5.8%

Depressive Symptoms Info Percent of long-stay residents who have depressive symptoms 1.3%
94% better than Maryland average

Maryland average: 20.2%

Antipsychotic Use Info Percent of long-stay residents who received an antipsychotic medication 8.0%
38% better than Maryland average

Maryland average: 12.9%

Pneumococcal Vaccine Info Percent of long-stay residents assessed and appropriately given the pneumococcal vaccine 95.7%
In line with Maryland average

Maryland average: 92.0%

Influenza Vaccine Info Percent of long-stay residents assessed and appropriately given the seasonal influenza vaccine 98.8%
In line with Maryland average

Maryland average: 96.6%

Hospitalizations per 1,000 days Info Number of hospitalizations per 1,000 long-stay resident days. 1.63
23% worse than Maryland average

Maryland average: 1.32

ED visits per 1,000 days Info Number of outpatient emergency department visits per 1,000 long-stay resident days. 1.41
17% worse than Maryland average

Maryland average: 1.21

Short-stay resident measures
Average Maryland avg: 3.7 Info CMS star rating based on short-stay quality measure performance. 5 stars = much above average, 1 star = much below average.
Pneumococcal Vaccine Info Percent of short-stay residents assessed and appropriately given the pneumococcal vaccine 86.7%
11% better than Maryland average

Maryland average: 78.4%

Antipsychotic medication increase Info Percent of short-stay residents who newly received an antipsychotic medication 2.0%
43% worse than Maryland average

Maryland average: 1.4%

Influenza Vaccine Info Percent of short-stay residents assessed and appropriately given the seasonal influenza vaccine 82.9%
In line with Maryland average

Maryland average: 80.6%

Re-hospitalized after SNF stay Info Percentage of short-stay residents who were re-hospitalized after their nursing home admission. 25.7%
21% worse than Maryland average

Maryland average: 21.2%

Emergency department visits Info Percentage of short-stay residents who had an outpatient emergency department visit. 10.9%
10% worse than Maryland average

Maryland average: 9.9%

Falls with major injury Info Percentage of SNF residents who experience falls with major injury during their stay. 0.9%
19% worse than Maryland average

Maryland average: 0.8%

Ability to care for self at discharge Info Percentage of residents at or above expected ability to care for themselves at discharge. 46.5%
13% worse than Maryland average

Maryland average: 53.7%

Successful return to home or community Info Rate of successful return to home or community from a skilled nursing facility. 60.6%
20% better than Maryland average

Maryland average: 50.6%

Penalties and fines

Federal penalties imposed by CMS for regulatory violations, including civil money penalties (fines) and denials of payment for new Medicare/Medicaid admissions.

Source: CMS Penalties Database (Data as of Jan 2026)

Total fines amount $16K
74% lower than Maryland average

Maryland average: $61K

Number of fines 1
33% fewer fines than Maryland average

Maryland average: 1.5

Payment Denials Info Serious action where Medicare and/or Medicaid temporarily stops payments for new residents until issues are fixed. 0
100% fewer payment denials than Maryland average

Maryland average: 0.1

Fines amount comparison
This facility $16K
Maryland average $61K
Penalty History

Penalties are imposed by CMS for violations of federal nursing home regulations.

Civil Money Penalty Info Fines imposed for noncompliance, which can be assessed per day or per instance of violation. Jul 12, 2024
$16K

Last updated: Jan 2026

Guides for Better Senior Living

Care Cost Calculator: See Prices in Your Area

Nursing Home Data Explorer

Don’t Wait Too Long: 7 Red Flag Signs Your Parent Needs Assisted Living Now

The True Cost of Assisted Living in 2025 – And How Families Are Paying For It

Understanding Senior Living Costs: Pricing Models, Discounts & Financial Assistance

Financial Aid for Maryland Seniors

Get financial aid guidance

Community Options Waiver

Maryland Medicaid Community Options Waiver

Age 65+ or disabled, Maryland resident, Medicaid- eligible, nursing home-level care need.

~$2,829/month (300% FBR, individual).

$2,000 (individual), $3,000 (couple) (excludes home, car).

High urban demand; rural outreach efforts.

Senior Care Program

Maryland Senior Care

Age 65+, Maryland resident, at risk of nursing home placement.

~$2,000/month (individual, varies by county).

$11,000 (individual).

Limited funding; waitlists common in high-demand areas.

Maryland Nursing Home Medicaid

Maryland Medical Assistance (Medicaid) Nursing Home Program

Age 65+, Maryland resident, Medicaid-eligible, requires nursing home-level care.

$943/month (individual); most income applied to care costs.

$2,500 (individual), $3,000 (couple); spousal protections up to $155,356.

Home equity limit $636,000; estate recovery applies post-55.

Senior Assisted Living Subsidy Program

Maryland Senior Assisted Living Group Home Subsidy

Age 62+, Maryland resident, in or moving to approved assisted living, low/moderate income.

~$34,000/year (individual, varies by county).

Not strict; prioritizes low-income.

Not available statewide; facility must be licensed by MDH.

Veterans Aid and Attendance (A&A) Benefit

Maryland VA Aid and Attendance

Wartime veteran/spouse, age 65+ or disabled, needs ADL help, Maryland resident.

Net income minus medical expenses < $1,984/month (individual with A&A).

$155,356 (net worth limit).

High veteran population in suburban/rural areas.

Senior Prescription Drug Assistance Program (SPDAP)

Maryland Senior Prescription Drug Assistance Program

Age 65+, Maryland resident (6+ months), Medicare Part D enrolled.

$48,560/year (individual, 300% FPL).

None specified.

Supplements Medicare Part D; annual enrollment required.

Medicare Savings Programs (MSP)

Maryland Medicare Savings Programs

Age 65+, Maryland resident, Medicare Part A/B enrollee.

$2,014/month (QMB), $2,706/month (SLMB/QI, individual).

$9,090 (individual), $13,630 (couple).

Includes QMB, SLMB, QI categories.

Community Personal Assistance Services (CPAS)

Maryland Medicaid Community Personal Assistance Services

Age 65+, Maryland resident, Medicaid-eligible, needs ADL assistance.

$943/month (individual); spend-down available.

$2,500 (individual), $3,000 (couple).

Consumer-directed option allows hiring family caregivers.

Tour Icon
Planning a tour? Check our touring checklist.
Chat Icon
Thinking of living here? We can help you speak to a current resident