Lorien Columbia
Nursing Home, Skilled Nursing & Assisted Living · Columbia, MD
CMS overall rating Info The Overall CMS Rating is scored from 1 to 5 stars and combines results from health inspections, staffing levels, and quality measures. Health inspections carry the most weight. Staffing and quality scores can increase or decrease the final rating based on performance compared to state and national standards.

Lorien Columbia

Nursing Home, Skilled Nursing & Assisted Living · Columbia, MD
CMS overall rating Info The Overall CMS Rating is scored from 1 to 5 stars and combines results from health inspections, staffing levels, and quality measures. Health inspections carry the most weight. Staffing and quality scores can increase or decrease the final rating based on performance compared to state and national standards.
Calculator: See prices in your area
Lorien Columbia accepts Medicare, Medicaid, and private pay.

Overview of Lorien Columbia

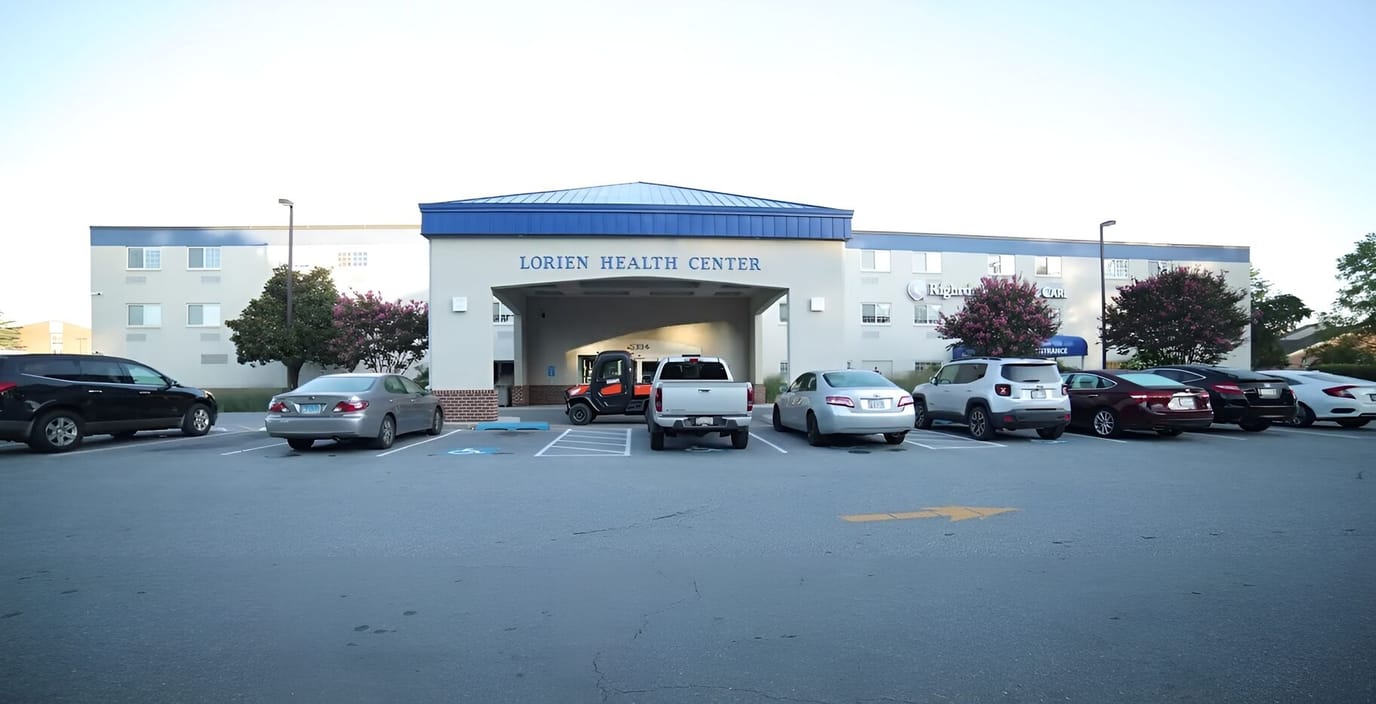
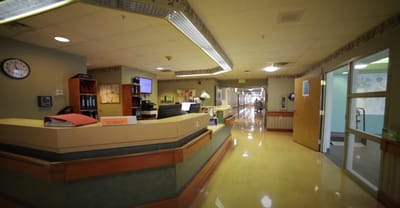
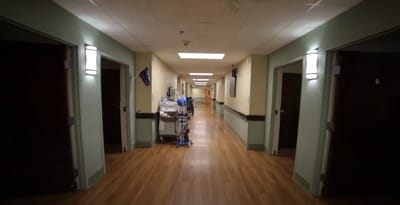
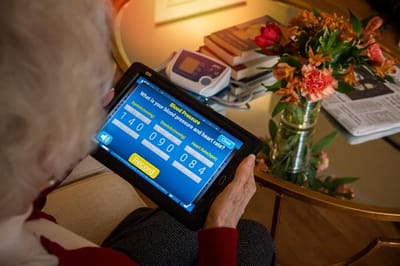
Lorien Columbia set in the quiet Cedar Lane, Columbia, MD, is a community that focuses on assisted living and skilled nursing. The community provides 24-hour care, alongside other services like physical, occupational, and speech therapy, for those who need them. Residents find the care they need with the community’s comprehensive services.

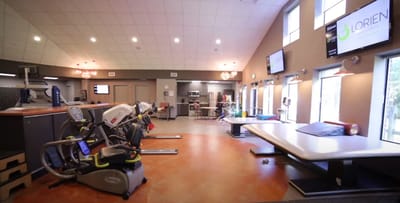
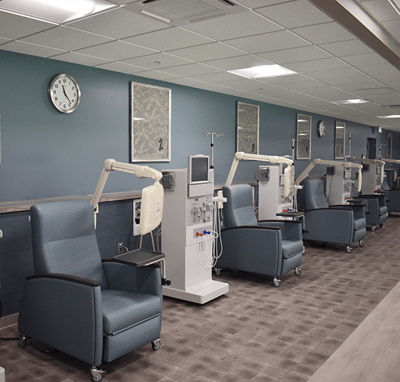
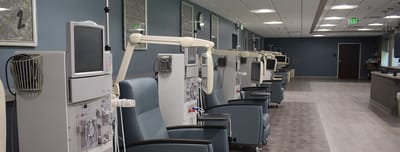
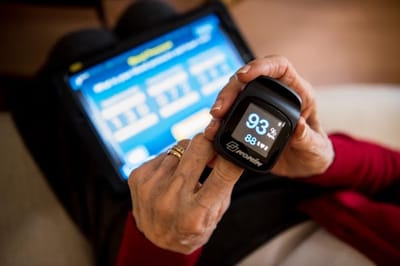
Here, residents are encouraged to participate in activities and trips curated for their wellness. Respite care, wound care, onsite dialysis, tracheotomy care, IV therapy, and dialysis are also available onsite to meet residents’ specific needs. With restaurant-style dining, residents’ special diets are accommodated while meeting their tastes with diverse dining options. Amenities include a cafe, a gym, a salon, and furnished accommodations.

Quality ratings

Measured by Centers for Medicare & Medicaid Services (CMS)

Overall rating Info The Overall CMS Rating combines results from health inspections, staffing levels and quality measures. Health inspections carry the most weight. Staffing and quality scores can increase or decrease the final rating based on performance compared to state and national standards.
At MD avg. At MD avg.Click the badge to see the full State ranking.Click here to see the full State ranking.
Health Inspection Info Based on the results of the facility's three most recent standard inspections and any complaint investigations. CMS reviews the number, scope, and severity of deficiencies, with more recent findings weighted more heavily.
▲ 6.5% Above MD avg. ▲ 6.5% Above MD avg.Click the badge to see the full State ranking.Click here to see the full State ranking.
Staffing Info Measures average nursing staff hours per resident per day, including Registered Nurses (RNs) and total nursing staff. Ratings are adjusted based on the level of care residents require and are compared to state and national benchmarks.
▲ 31.3% Above MD avg. ▲ 31.3% Above MD avg.Click the badge to see the full State ranking.Click here to see the full State ranking.
Quality Measures Info Based on clinical and physical health indicators reported to CMS, such as hospital readmissions, falls, pressure ulcers, and improvements in mobility. These measures reflect how well residents' health needs are being managed.
▼ 45.9% Below MD avg. ▼ 45.9% Below MD avg.Click the badge to see the full State ranking.Click here to see the full State ranking.

Staffing hours breakdown

Info Daily nursing hours per resident by staff type, reported to CMS. Higher is generally better — compare this facility to state and national averages to see where staffing stands.

Hours per resident per day — compared to Maryland state averages

Total nursing care / resident Info This home is ranked 36th out of 111 homes in Maryland.

Total adjusted nursing hours per resident per day, combining RN, LPN, and aide time. CMS adjusts this for case-mix so facilities can be fairly compared.
3h 47m per day
Rank #36 / 111Nurse hours — State benchmarkedThis home is ranked 36th out of 111 homes in Maryland.Shows adjusted nurse hours per resident per day benchmarked to the Maryland average, with a ranking across 111 Maryland SNFs. More hours mean more direct care. The national average is about 3.5 hrs; below 3.0 is a red flag.Click the rank badge to see the full State ranking.Click here to see the full State ranking.
This facility Maryland avg (3h 46m per day)
vs Maryland avg
+0%

3 of 6 metrics below state avg

Standout metric LPN / LVN is +26% above state avg
Staff typeHours / Day / Residentvs state avg
Registered Nurse (RN) Info RNs hold the highest nursing license and can assess residents, interpret test results, and direct care plans. More RN hours per day often signals stronger clinical oversight and faster response to health changes. 50m per day ■ Avg State avg: 50m per day · National avg: 41m per day
LPN / LVN Info Licensed Practical Nurses (LPNs) or Licensed Vocational Nurses (LVNs) deliver routine hands-on care — medication administration, wound dressing, and monitoring vital signs. They work under RN supervision and make up a large share of daily bedside care. 1h 8m per day ▲ 26% State avg: 54m per day · National avg: 52m per day
Nurse Aide Info Certified Nurse Aides (CNAs) provide the most direct day-to-day assistance: bathing, dressing, feeding, and mobility. Nurse aide hours are typically the largest staffing category and directly affect residents' quality of life. 2h 6m per day ▼ 3% State avg: 2h 10m per day · National avg: 2h 21m per day
Total Nursing (Weekend) Info Combined nursing hours (RN + LPN + Nurse Aide) per resident per day on weekends. Staffing often drops on weekends — this figure reveals whether the facility maintains adequate coverage outside of weekday hours. 3h 49m per day ▲ 10% State avg: 3h 29m per day · National avg: 3h 26m per day
Physical Therapist Info Hours per resident per day provided by licensed Physical Therapists (PTs) or PT Assistants. PT services help residents recover mobility after injury or illness and are especially important for post-acute (short-stay) rehabilitation. 2m per day ▼ 60% State avg: 5m per day · National avg: 4m per day
RN (Weekend) Info Registered nurse hours specifically on weekends. Facilities sometimes reduce RN presence on Saturdays and Sundays — a low weekend RN figure compared to weekday hours can indicate reduced clinical oversight when most administrative staff are absent. 35m per day ▼ 5% State avg: 37m per day · National avg: 29m per day

Capacity and availability

This home usually has limited availability

Occupancy between 85% and 95% suggests balanced demand.

Higher occupancy than the Maryland average: 82.4%
Occupancy rate 90.8% Rank #30 / 113Occupancy rate — State benchmarkedThis home is ranked 30th out of 113 homes in Maryland.Shows this facility's occupancy rate versus the Maryland average, with its Statewide rank out of 113. Higher occupancy signals strong local demand and financial stability.Click the rank badge to see the full State ranking.Click here to see the full State ranking.
Avg. Length of Stay 63 days
Occupancy rate
90.8% Rank #30 / 113Occupancy rate — State benchmarkedThis home is ranked 30th out of 113 homes in Maryland.Shows this facility's occupancy rate versus the Maryland average, with its Statewide rank out of 113. Higher occupancy signals strong local demand and financial stability.Click the rank badge to see the full State ranking.Click here to see the full State ranking.
Avg. Length of Stay
63 days

Who this home usually serves

TYPE OF STAY

Mostly short-term rehab stays

Most residents typically stay for a few weeks or months before returning home or moving on.

Breakdown by payment type

Medicare

55% of new residents, usually for short-term rehab.

Typical stay 23 days

Private pay

30% of new residents, often for short stays.

Typical stay 26 days

Medicaid

15% of new residents, often for long-term daily care.

Typical stay 9 - 10 months

Finances and operations

Privately-owned community
Operated by a business corporation.
Home revenue
$35.7M
Profit
$522.2K
Privately-owned community Operated by a business corporation.
Home revenue
$35.7M Rank #17 / 113Revenue — State benchmarkedThis home is ranked 17th out of 113 homes in Maryland.Shows this facility's annual revenue compared to the Maryland SNF average. Higher revenue generally means more resources for staffing and capital — read alongside Payroll %.Click the rank badge to see the full State ranking.Click here to see the full State ranking.
Profit
$522.2K
Payroll costs Info The portion of the home's budget spent on staff, including nurses, caregivers, and other employees who support care and operations. Rank #8 / 113Payroll — State benchmarkedThis home is ranked 8th out of 113 homes in Maryland.Shows total annual staff payroll benchmarked to the Maryland average. Higher payroll investment relative to peers often signals better staffing and less reliance on cheaper contract labor.Click the rank badge to see the full State ranking.Click here to see the full State ranking.
$18.7M
52.4% of revenue Rank #18 / 113Payroll % — State benchmarkedThis home is ranked 18th out of 113 homes in Maryland.Shows payroll as a percentage of revenue versus the Maryland average. Well-run Maryland SNFs typically land around 48–55% — the top third Statewide. Below 25% may signal understaffing or heavy agency use — read with Staffing ratings.Click the rank badge to see the full State ranking.Click here to see the full State ranking.
Other operating costs Info All remaining costs needed to run the home, such as food, utilities, building maintenance, supplies and administrative expenses.
$16.5M
Total costs $35.2M
Walk Score
Walk Score: 52 / 100 Rank #45 / 109Walk Score — State benchmarkedThis home is ranked 45th out of 109 homes in Maryland.Shows how walkable this facility's neighborhood is compared to the average Walk Score across Maryland SNFs. Higher scores benefit residents, families, and staff.Click the rank badge to see the full State ranking.Click here to see the full State ranking.
Moderately walkable. Some errands can be accomplished on foot, with a mix of nearby amenities.

About this community

Awards

AwardsBest Nursing Home for 2018-19 by the US News and World Report, Top Winner in the 2025 Daily Record Reader Rankings, Purple Flag accreditation in Maryland.

License Details

Therapy & Rehabilitation

2 services
Rehabilitation Services
Respite Care

Staffing & Medical

1 service
24-Hour Staffing

Dining & Nutrition

Food DescriptionRestaurant style dining and café available.

What does this home offer?

Total residents icon

Total Residents: 205 Residents

Housing options icon

Housing Options: Private / Semi-Private Rooms

Building type icon
Building type icon

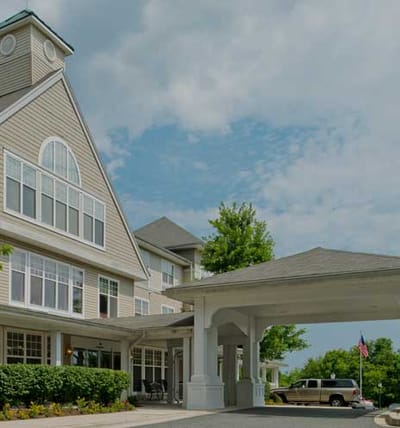
Building Type: 3-story
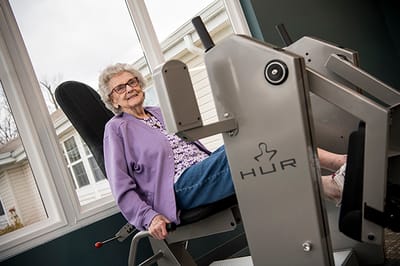
Wellness program icon

Wellness Program

Types of Care at Lorien Columbia

Nursing Home Skilled Nursing Assisted Living

Contact Lorien Columbia

icon Rare Find!

This senior community typically operates at full capacity. Congratulations! Secure your reservation now!

Reserve Now

Health Inspection History

Inspections Since 2018
Total health inspections 4

Maryland average 3.9


Last Health inspection on Sep 2025

Total health citations
36 Rank #42 / 113Health citations — State benchmarkedThis home is ranked 42nd out of 113 homes in Maryland.Shows this facility's total health deficiency citations benchmarked to the Maryland State average, with a ranking across all 113 MD SNFs. Lower citation counts earn a better rank.Click the rank badge to see the full State ranking.Click here to see the full State ranking.

Maryland average 49.9

Citations per inspection
9 Rank #37 / 113Citations per inspection — State benchmarkedThis home is ranked 37th out of 113 homes in Maryland.Shows average deficiency citations per CMS inspection for this facility versus the Maryland mean across 113 SNFs with citation data. Lower is better.Click the rank badge to see the full State ranking.Click here to see the full State ranking.

Maryland average 12.81


Health citations are formal notices following inspections when they fail to comply with safety and care standards.

23 of 36 citations resulted from standard inspections; 10 of 36 resulted from complaint investigations; and 3 of 36 came from combined inspections (standard and complaint).

Breakdown of citation severity (last 8 years)
Critical Health citations
1
100% worse than Maryland average

Maryland average: 0.5


Serious Health citations
0
100% better than Maryland average

Maryland average: 0.6

1 critical citation Maryland average: 0.5

0 serious citations Maryland average: 0.6

35 moderate citations Maryland average: 47.2

0 minor citations Maryland average: 1.7
Citations history (last 8 years)
Abuse/Neglect moderate citation Sep 29, 2025

Pharmacy moderate citation Sep 29, 2025

Quality of Care moderate citation Sep 29, 2025

Quality of Care moderate citation Sep 29, 2025

Financial Assistance for
Nursing Home in Maryland

Lorien Columbia is located in Columbia, Maryland.
Here are the financial assistance programs available to residents in Maryland.

Get Financial aid guidance

Community Options Waiver

Maryland Medicaid Community Options Waiver

Age 65+ or disabled
General Maryland resident, Medicaid- eligible, nursing home-level care need.
Income Limits (2025) ~$2,829/month 300% FBR, individual
Asset Limits $2,000 (individual), $3,000 (couple) (excludes home, car).
MD

High urban demand; rural outreach efforts.

Benefits
Personal care (5-7 hours/day, e.g., bathing, dressing) Respite care (up to 240 hours/year) Adult day care ($70/day) Home modifications ($1,500 avg.)

Senior Care Program

Maryland Senior Care

Age 65+
General Maryland resident, at risk of nursing home placement.
Income Limits ~$2,000/month individual, varies by county
Asset Limits $11,000 individual
MD

Limited funding; waitlists common in high-demand areas.

Benefits
In-home care (3-5 hours/week) Respite care (up to 10 days/year) Meals (~$6/meal) Transportation (~5 trips/month) Case management

Maryland Nursing Home Medicaid

Maryland Medical Assistance (Medicaid) Nursing Home Program

Age 65+
General Maryland resident, Medicaid-eligible, requires nursing home-level care.
Income Limits (2025) $943/month (individual); most income applied to care costs.
Asset Limits $2,500 (individual), $3,000 (couple); spousal protections up to $155,356.
MD

Home equity limit $636,000; estate recovery applies post-55.

Benefits
24/7 nursing care Meals Therapy Medications (unlimited per medical need)

Senior Assisted Living Subsidy Program

Maryland Senior Assisted Living Group Home Subsidy

Age 62+
General Maryland resident, in or moving to approved assisted living, low/moderate income.
Income Limits (2025) ~$34,000/year individual, varies by county
Asset Limits Not strict; prioritizes low-income.
MD

Not available statewide; facility must be licensed by MDH.

Benefits
Personal care Meals 24-hour supervision (up to $1,500/month subsidy typical)

Veterans Aid and Attendance (A&A) Benefit

Maryland VA Aid and Attendance

Age
General Wartime veteran/spouse, age 65+ or disabled, needs ADL help, Maryland resident.
Income Limits (2025) Net income minus medical expenses < $1,984/month individual with A&A
Asset Limits $155,356 net worth limit
MD

High veteran population in suburban/rural areas.

Benefits
Cash benefit ($1,478-$2,471/month, varies by status) for care costs

Senior Prescription Drug Assistance Program (SPDAP)

Maryland Senior Prescription Drug Assistance Program

Age 65+
General Maryland resident (6+ months), Medicare Part D enrolled.
Income Limits (2025) $48,560/year individual, 300% FPL
Asset Limits None specified.
MD

Supplements Medicare Part D; annual enrollment required.

Benefits
Up to $40/month premium subsidy Reducing drug costs

Medicare Savings Programs (MSP)

Maryland Medicare Savings Programs

Age 65+
General Maryland resident, Medicare Part A/B enrollee.
Income Limits (2025) $2,014/month (QMB), $2,706/month (SLMB/QI, individual).
Asset Limits $9,090 (individual), $13,630 (couple).
MD

Includes QMB, SLMB, QI categories.

Benefits
Covers premiums (up to $174.70/month Part B) Co-pays Deductibles

Community Personal Assistance Services (CPAS)

Maryland Medicaid Community Personal Assistance Services

Age 65+
General Maryland resident, Medicaid-eligible, needs ADL assistance.
Income Limits (2025) $943/month (individual); spend-down available.
Asset Limits $2,500 (individual), $3,000 (couple).
MD

Consumer-directed option allows hiring family caregivers.

Benefits
Personal care (hours vary, typically 20-30/week) Chores Nurse supervision

Places of interest near Lorien Columbia

Address 4.0 miles from city center Info Estimated distance in miles from Columbia's city center to Lorien Columbia's address, calculated via Google Maps.

Calculate Travel Distance to Lorien Columbia

Add your location

Address

Staffing Data

Reporting period: April 1 – June 30, 2025 (Q2 2025). Source: CMS Payroll-Based Journal report.

Total staff 413
Employees 231
Contractors 182
Staff to resident ratio 2.16:1
20% better than Maryland average
Maryland average ratio: 1.81:1 Maryland average ratio: 1.81:1See full Maryland ranking
Avg staff/day 123
Average shift 7.8 hours
0% compared with Maryland average
Maryland average: 8 hours Maryland average shift: 8 hoursSee full Maryland ranking
Total staff hours (quarter) 87,742

Nursing staff breakdown

Q2 2025 · Apr 1 – Jun 30 More info This data comes from the CMS Payroll-Based Journal report covering April 1 – June 30, 2025.
Registered Nurse

Manages medical care and health needs.

Total count 35
Average shift length Info Average shift length. Calculated as total hours divided by days worked and average staff per day. 8.2 hours

No contractors work on this role.

Licensed Practical Nurse

Assists with medical care and medications.

Total count 86
Average shift length Info Average shift length. Calculated as total hours divided by days worked and average staff per day. 8.4 hours

This role is partially covered by contractors.

Certified Nursing Assistant

Helps with daily care and mobility.

Total count 173
Average shift length Info Average shift length. Calculated as total hours divided by days worked and average staff per day. 7.7 hours

This role is partially covered by contractors.

Contractor staffing

Q2 2025 · Apr 1 – Jun 30 More info This data comes from the CMS Payroll-Based Journal report covering April 1 – June 30, 2025.

Total hours from contractors

17.6%

15,409 contractor hours this quarter

Certified Nursing Assistant: 97 Licensed Practical Nurse: 39 Physical Therapy Assistant: 9 Physical Therapy Aide: 8 Respiratory Therapy Technician: 8 Qualified Activities Professional: 6 Speech Language Pathologist: 6 Qualified Social Worker: 6 Medication Aide/Technician: 1 Medical Director: 1 Occupational Therapy Assistant: 1

Staff by category

Q2 2025 · Apr 1 – Jun 30 More info This data comes from the CMS Payroll-Based Journal report covering April 1 – June 30, 2025.
Certified Nursing Assistant769717333,03191100%7.7
Licensed Practical Nurse47398618,58291100%8.4
Registered Nurse3503511,23391100%8.2
Clinical Nurse Specialist150153,8768796%7.4
Nurse Aide in Training110112,79091100%7.7
Other Dietary Services Staff8082,77091100%7.8
Qualified Activities Professional106162,47491100%8.4
Medication Aide/Technician111121,7348998%7.8
RN Director of Nursing6061,7058897%9
Mental Health Service Worker5051,5916774%7.6
Physical Therapy Assistant0991,4217481%7.3
Speech Language Pathologist0661,3546875%7.3
Occupational Therapy Aide3031,0936369%7.6
Physical Therapy Aide0881,0258391%7
Qualified Social Worker0667826976%6.2
Respiratory Therapy Technician0887317582%6.7
Nurse Practitioner1014966470%7.7
Dietitian1014776571%7.3
Administrator1013845358%7.2
Dental Services Staff1011041314%8
Occupational Therapy Assistant0115467%9
Medical Director011351516%2.3
173 Certified Nursing Assistant
% of Days 100%
86 Licensed Practical Nurse
% of Days 100%
35 Registered Nurse
% of Days 100%
15 Clinical Nurse Specialist
% of Days 96%
11 Nurse Aide in Training
% of Days 100%
8 Other Dietary Services Staff
% of Days 100%
16 Qualified Activities Professional
% of Days 100%
12 Medication Aide/Technician
% of Days 98%
6 RN Director of Nursing
% of Days 97%
5 Mental Health Service Worker
% of Days 74%
9 Physical Therapy Assistant
% of Days 81%
6 Speech Language Pathologist
% of Days 75%
3 Occupational Therapy Aide
% of Days 69%
8 Physical Therapy Aide
% of Days 91%
6 Qualified Social Worker
% of Days 76%
8 Respiratory Therapy Technician
% of Days 82%
1 Nurse Practitioner
% of Days 70%
1 Dietitian
% of Days 71%
1 Administrator
% of Days 58%
1 Dental Services Staff
% of Days 14%
1 Occupational Therapy Assistant
% of Days 7%
1 Medical Director
% of Days 16%

Facility Characteristics

Source: CMS Long-Term Care Facility Characteristics (Data as of Jan 2026)

Total residents 191
Medicare
45
23.6% of residents
Medicaid
137
71.7% of residents
Private pay or other
9
4.7% of residents
Programs & Services
Residents Group

Residents meet regularly to discuss policies, care quality, and activities

Active Resident Council

Organized group of residents that meets regularly to discuss facility policies, quality of life, and activities.

Quality of care over time

These measures show how residents usually do over time at this home, based on health outcomes and preventive care.

High-risk clinical events score Info A composite score based on pressure ulcers, falls with injury, weight loss, walking ability decline, and activities of daily living decline. 17.5
35% worse than Maryland average

Maryland average: 12.9

Functional decline score Info A composite score based on activities of daily living decline, walking ability decline, and incontinence. 27.8
8% worse than Maryland average

Maryland average: 25.7

Long-stay resident measures
Below average Maryland avg: 3.7 Info CMS star rating based on long-stay quality measure performance. 5 stars = significantly above average, 1 star = significantly below average.
Need for Help with Daily Activities Increased Info Percent of long-stay residents whose need for help with daily activities has increased 24.3%
In line with Maryland average

Maryland average: 23.7%

Walking Ability Worsened Info Percent of long-stay residents whose ability to move independently worsened 40.6%
47% worse than Maryland average

Maryland average: 27.7%

Low Risk Residents with Bowel/Bladder Incontinence Info Percent of low risk long-stay residents who lose control of their bowels or bladder 18.4%
29% better than Maryland average

Maryland average: 25.9%

Falls with Major Injury Info Percent of long-stay residents experiencing one or more falls with major injury 2.2%
5% better than Maryland average

Maryland average: 2.3%

High Risk Residents with Pressure Ulcers Info Percent of long-stay high risk residents with pressure ulcers 8.3%
27% worse than Maryland average

Maryland average: 6.5%

Urinary Tract Infection Info Percent of long-stay residents with a urinary tract infection 2.9%
79% worse than Maryland average

Maryland average: 1.6%

Lost Too Much Weight Info Percent of long-stay residents who lose too much weight 12.0%
107% worse than Maryland average

Maryland average: 5.8%

Depressive Symptoms Info Percent of long-stay residents who have depressive symptoms 1.3%
94% better than Maryland average

Maryland average: 20.2%

Antipsychotic Use Info Percent of long-stay residents who received an antipsychotic medication 8.0%
38% better than Maryland average

Maryland average: 12.9%

Pneumococcal Vaccine Info Percent of long-stay residents assessed and appropriately given the pneumococcal vaccine 95.7%
In line with Maryland average

Maryland average: 92.0%

Influenza Vaccine Info Percent of long-stay residents assessed and appropriately given the seasonal influenza vaccine 98.8%
In line with Maryland average

Maryland average: 96.6%

Hospitalizations per 1,000 days Info Number of hospitalizations per 1,000 long-stay resident days. 1.63
23% worse than Maryland average

Maryland average: 1.32

ED visits per 1,000 days Info Number of outpatient emergency department visits per 1,000 long-stay resident days. 1.41
17% worse than Maryland average

Maryland average: 1.21

Short-stay resident measures
Average Maryland avg: 3.7 Info CMS star rating based on short-stay quality measure performance. 5 stars = much above average, 1 star = much below average.
Pneumococcal Vaccine Info Percent of short-stay residents assessed and appropriately given the pneumococcal vaccine 86.7%
11% better than Maryland average

Maryland average: 78.4%

Antipsychotic medication increase Info Percent of short-stay residents who newly received an antipsychotic medication 2.0%
43% worse than Maryland average

Maryland average: 1.4%

Influenza Vaccine Info Percent of short-stay residents assessed and appropriately given the seasonal influenza vaccine 82.9%
In line with Maryland average

Maryland average: 80.6%

Re-hospitalized after SNF stay Info Percentage of short-stay residents who were re-hospitalized after their nursing home admission. 25.7%
21% worse than Maryland average

Maryland average: 21.2%

Emergency department visits Info Percentage of short-stay residents who had an outpatient emergency department visit. 10.9%
10% worse than Maryland average

Maryland average: 9.9%

Falls with major injury Info Percentage of SNF residents who experience falls with major injury during their stay. 0.9%
19% worse than Maryland average

Maryland average: 0.8%

Ability to care for self at discharge Info Percentage of residents at or above expected ability to care for themselves at discharge. 46.5%
13% worse than Maryland average

Maryland average: 53.7%

Successful return to home or community Info Rate of successful return to home or community from a skilled nursing facility. 60.6%
20% better than Maryland average

Maryland average: 50.6%

Penalties and fines

Federal penalties imposed by CMS for regulatory violations, including civil money penalties (fines) and denials of payment for new Medicare/Medicaid admissions.

Source: CMS Penalties Database (Data as of Jan 2026)

Total fines amount $16K Rank #81 / 113Federal fines — State benchmarkedThis home is ranked 81st out of 113 homes in Maryland.Shows this facility's cumulative CMS federal fine dollars versus the Maryland average among facilities with fines, and where it ranks among 113 skilled nursing facilities in the pool. Lower total dollars mean a better rank.Click the rank badge to see the full State ranking.Click here to see the full State ranking.
74% lower than Maryland average

Maryland average: $61K

Number of fines 1
33% fewer fines than Maryland average

Maryland average: 1.5

Payment Denials Info Serious action where Medicare and/or Medicaid temporarily stops payments for new residents until issues are fixed. 0
100% fewer payment denials than Maryland average

Maryland average: 0.1

Fines amount comparison
This facility $16K
Maryland average $61K
Penalty History

Penalties are imposed by CMS for violations of federal nursing home regulations.

1 penalty in the past 3 years

Jul 12, 2024 · $16K

Civil Money Penalty Info Fines imposed for noncompliance, which can be assessed per day or per instance of violation. Jul 12, 2024
$16K

Last updated: Jan 2026

Compare Nursing Home around Columbia

The information below is reported by the Maryland Department of Health, Office of Health Care Quality.

2 facilities compared · CMS & MD Dept. of Health data

Filter by care type
Lorien Columbia
NH

Nursing Home Licensed facility providing 24/7 skilled nursing care for residents with complex, ongoing medical needs. Staffed by RNs, LPNs, and CNAs. Inspected and star-rated annually by CMS. Accepts Medicare (short-term rehab) and Medicaid (long-term care).

AL

Assisted Living A licensed, long-term care setting for seniors or individuals with disabilities who need help with daily activities — like bathing, dressing, and medication management — but not 24-hour skilled nursing. Offers housing, meals, and around-the-clock support while aiming to maximize resident independence.

IL

Independent Living Lifestyle-focused communities for older adults offering dining, activities, and transportation with minimal personal care. Best for active, independent seniors who want community without medical support.

MC

Memory Care Secured, specialized care for people living with Alzheimer's or dementia. Staff trained in cognitive impairment, with higher staff-to-resident ratios and an environment designed to reduce confusion and wandering risk.

Columbia (Hickory Ridge)205 90.8% +10%3.79 -36%0%$16.0k369.01195 52 Michele Collison$35.7M$18.7M52.4%215112
Autumn Lake Healthcare at Patuxent River
NH

Nursing Home Licensed facility providing 24/7 skilled nursing care for residents with complex, ongoing medical needs. Staffed by RNs, LPNs, and CNAs. Inspected and star-rated annually by CMS. Accepts Medicare (short-term rehab) and Medicaid (long-term care).

HC

Home Care Professional care delivered in the person's own home — from companionship and errands to skilled nursing and therapy. Allows seniors to age in place. Medicare covers skilled home health when medically necessary.

Laurel153 86.4% +5%3.17 +32%-16%$12.7k5611.21130 22 14200 Laurel Park Drive Holdco LLC$20.1M$10.7M53.2%215141

Guides for Better Senior Living

Care Cost Calculator: See Prices in Your Area

Nursing Home Data Explorer

Don’t Wait Too Long: 7 Red Flag Signs Your Parent Needs Assisted Living Now

The True Cost of Assisted Living in 2025 – And How Families Are Paying For It

Understanding Senior Living Costs: Pricing Models, Discounts & Financial Assistance

Frequently Asked Questions about Lorien Columbia

What neighborhood is Lorien Columbia in?

Lorien Columbia is in the Hickory Ridge neighborhood.

Is Lorien Columbia in a walkable area?

Lorien Columbia has a walk score of 52. Moderately walkable. Some errands can be accomplished on foot, with a mix of nearby amenities.

Are there photos of Lorien Columbia?

Yes — there are 44 photos of Lorien Columbia in the photo gallery on this page.

What is the address of Lorien Columbia?

Lorien Columbia is located at 6334 Cedar Ln, Columbia, MD 21044, United States.

What is the phone number of Lorien Columbia?

(410) 531-5300 will put you in contact with the team at Lorien Columbia.

Is Lorien Columbia Medicare or Medicaid certified?

Yes — Lorien Columbia is a CMS-certified provider of Medicare and Medicaid.

Explore Open Rooms
1 Contact details
2 What type of senior care service are you looking for?
3 What budget do you have in mind for senior care?
4 How soon do you need to find care?
5 Additional details

Thank you for your interest!

Our team will be in touch shortly to help with next steps.