Lourdes Noreen McKeen Residence
Nursing Home, Assisted Living & Independent Living · West Palm Beach, FL
CMS overall rating Info CMS (the Centers for Medicare & Medicaid Services) is the federal agency that rates nursing home quality. Its Overall Rating runs from 1 to 5 stars, combining health inspections, staffing, and quality measures, with inspections weighted most heavily.

Lourdes Noreen McKeen Residence

Nursing Home, Assisted Living & Independent Living · West Palm Beach, FL
CMS overall rating Info CMS (the Centers for Medicare & Medicaid Services) is the federal agency that rates nursing home quality. Its Overall Rating runs from 1 to 5 stars, combining health inspections, staffing, and quality measures, with inspections weighted most heavily.
Calculator: See prices in your area
Lourdes Noreen McKeen Residence accepts Medicare, Medicaid, and private pay.

Overview of Lourdes Noreen Mckeen Residence

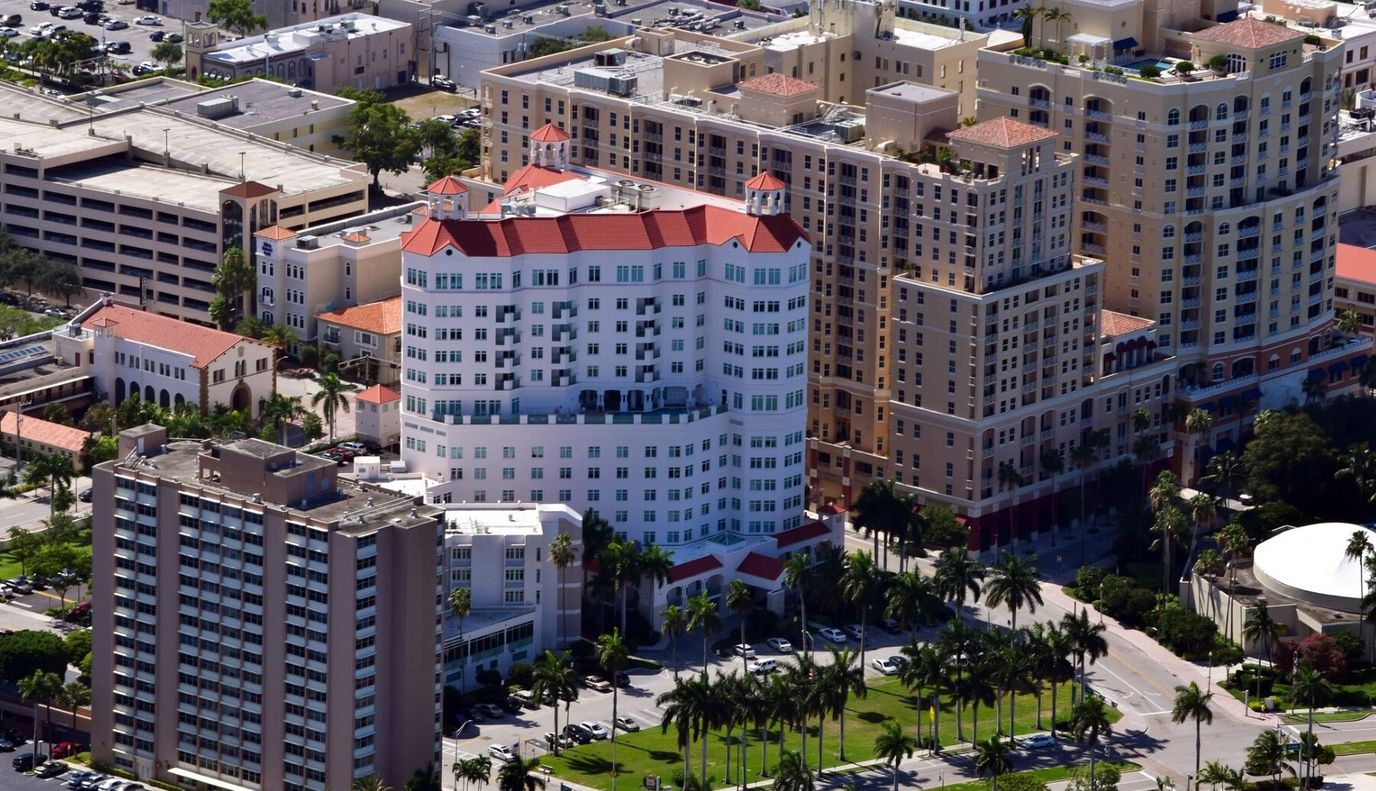
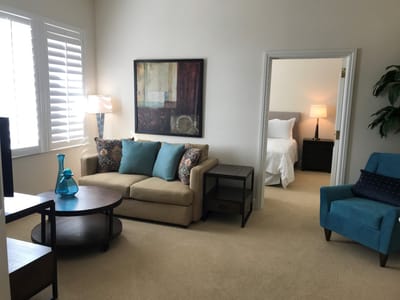
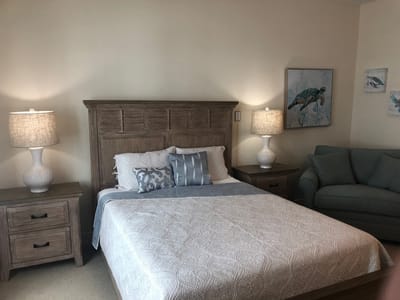
Surrounded by thriving local amenities in West Palm Beach, FL, Lourdes Noreen Mckeen Residence is a sophisticated community that offers independent living, assisted living, skilled nursing, rehabilitation, and respite care. Residents experience the best of their golden years in the community’s beautifully furnished and spacious accommodations. 24-hour emergency response, maintenance services, and weekly housekeeping are also provided, so residents can feel at ease during their stay.

Fun recreational activities and enriching programs are conducted to keep residents active and socially connected. Breakfast and dinner are also provided, ensuring residents have a delightful dining experience that caters to their dietary needs and preferences. The community has plenty of amenities, including a fitness center, a heated pool, a library, a beauty salon, and cozy communal spaces.

Quality ratings

Measured by Centers for Medicare & Medicaid Services (CMS)

Overall rating Info The Overall CMS Rating combines results from health inspections, staffing levels and quality measures. Health inspections carry the most weight. Staffing and quality scores can increase or decrease the final rating based on performance compared to state and national standards.
▲ 26.0% Above FL avg. ▲ 26.0% Above FL avg.FL average: 3.2Click the badge to see the full State ranking.Click here to see the full State ranking.
Health Inspection Info Based on the results of the facility's three most recent standard inspections and any complaint investigations. CMS reviews the number, scope, and severity of deficiencies, with more recent findings weighted more heavily.
▲ 6.7% Above FL avg. ▲ 6.7% Above FL avg.FL average: 2.8Click the badge to see the full State ranking.Click here to see the full State ranking.
Staffing Info Measures average nursing staff hours per resident per day, including Registered Nurses (RNs) and total nursing staff. Ratings are adjusted based on the level of care residents require and are compared to state and national benchmarks.
▲ 47.8% Above FL avg. ▲ 47.8% Above FL avg.FL average: 3.4Click the badge to see the full State ranking.Click here to see the full State ranking.
Quality Measures Info Based on clinical and physical health indicators reported to CMS, such as hospital readmissions, falls, pressure ulcers, and improvements in mobility. These measures reflect how well residents' health needs are being managed.
▼ 1.4% Below FL avg. ▼ 1.4% Below FL avg.FL average: 4.1Click the badge to see the full State ranking.Click here to see the full State ranking.

Staffing hours breakdown

Info Daily nursing hours per resident by staff type, reported to CMS. Higher is generally better — compare this facility to state and national averages to see where staffing stands.

Hours per resident per day — compared to Florida state averages

Total nursing care / resident Info This home is ranked 75th out of 253 homes in Florida for nurse hours. Total adjusted nursing hours per resident per day, combining RN, LPN, and aide time. CMS adjusts this for case-mix so facilities can be fairly compared.
4h 11m per day
Rank #75 / 253Nurse hours — State benchmarkedThis home is ranked 75th out of 253 homes in Florida. Shows adjusted nurse hours per resident per day benchmarked to the Florida average, with a ranking across 253 Florida facilities. More hours mean more direct care. The national average is about 3.5 hrs; below 3.0 is a red flag.Rankings are based only on facilities in Florida that report data for that category. Facilities without available data are excluded from the ranking.Click the rank badge to see the full State ranking.Click here to see the full State ranking.
This facility Florida avg (4h 2m per day)
vs Florida avg
+4%

2 of 6 metrics below state avg

Standout metric Weekend RN is +57% above state avg
Staff type Hours / Day / Resident vs state avg
Registered Nurse (RN) Info RNs hold the highest nursing license and can assess residents, interpret test results, and direct care plans. More RN hours per day often signals stronger clinical oversight and faster response to health changes. 1h 3m per day ▲ 44% State avg: 44m per day · National avg: 41m per day
LPN / LVN Info Licensed Practical Nurses (LPNs) or Licensed Vocational Nurses (LVNs) deliver routine hands-on care — medication administration, wound dressing, and monitoring vital signs. They work under RN supervision and make up a large share of daily bedside care. 30m per day ▼ 37% State avg: 47m per day · National avg: 52m per day
Nurse Aide Info Certified Nurse Aides (CNAs) provide the most direct day-to-day assistance: bathing, dressing, feeding, and mobility. Nurse aide hours are typically the largest staffing category and directly affect residents' quality of life. 2h 24m per day ▲ 3% State avg: 2h 20m per day · National avg: 2h 20m per day
Weekend Total Nursing Info Combined nursing hours (RN + LPN + Nurse Aide) per resident per day on weekends. Staffing often drops on weekends — this figure reveals whether the facility maintains adequate coverage outside of weekday hours. 3h 37m per day ▲ 3% State avg: 3h 31m per day · National avg: 3h 26m per day
Physical Therapist Info Hours per resident per day provided by licensed Physical Therapists (PTs) or PT Assistants. PT services help residents recover mobility after injury or illness and are especially important for post-acute (short-stay) rehabilitation. 3m per day ▼ 47% State avg: 5m per day · National avg: 4m per day
Weekend RN Info Registered nurse hours specifically on weekends. Facilities sometimes reduce RN presence on Saturdays and Sundays — a low weekend RN figure compared to weekday hours can indicate reduced clinical oversight when most administrative staff are absent. 50m per day ▲ 57% State avg: 32m per day · National avg: 28m per day

Capacity and availability

This home usually has limited availability

Higher occupancy than the Florida average: 84.3%
Occupancy rate
85.5% Rank #166 / 258Occupancy rate — State benchmarkedThis home is ranked 166th out of 258 homes in Florida. Shows this facility's occupancy rate versus the Florida average, with its Statewide rank out of 258. Higher occupancy signals strong local demand and financial stability.Rankings are based only on facilities in Florida that report data for that category. Facilities without available data are excluded from the ranking.Click the rank badge to see the full State ranking.Click here to see the full State ranking.
Avg. Length of Stay
96 days
Bed community size
132-bed community Rank #206 / 1074Bed count — State benchmarkedThis home is ranked 206th out of 1074 homes in Florida. Shows this facility's certified or reported bed count compared to other Florida facilities. Larger communities may offer more amenities, programs, and on-site services for residents and families.Rankings are based only on facilities in Florida that report data for that category. Facilities without available data are excluded from the ranking.Click the rank badge to see the full State ranking.Click here to see the full State ranking.
A larger shared setting that may offer more common spaces and organized community services.
Walk Score
Walk Score: 96 / 100 Rank #11 / 1486Walk Score — State benchmarkedThis home is ranked 11th out of 1486 homes in Florida. Shows how walkable this facility's neighborhood is compared to the average Walk Score across Florida facilities. Higher scores benefit residents, families, and staff.Rankings are based only on facilities in Florida that report data for that category. Facilities without available data are excluded from the ranking.Click the rank badge to see the full State ranking.Click here to see the full State ranking.
Walker's paradise. Daily errands do not require a car, with many shops and services nearby.

Therapy & Rehabilitation

3 services
Rehabilitation Services
Respite Care
Short-Term Rehab

Additional Services

1 service
Short-Term Respite Care

Amenities & Lifestyle

Concierge Service
Hurricane Preparedness
Dining
Waterfront Living
Healthcare Services

Contact Lourdes Noreen McKeen Residence

Staffing Data

Reporting period: October 1 – December 31, 2025 (Q4 2025). Source: CMS Payroll-Based Journal report.

Total staff 189
Employees 142
Contractors 47
Staff to resident ratio 1.48 : 1
0% compared with Florida average
Florida average ratio: 1.47 : 1 Florida average ratio: 1.47 : 1See full Florida ranking
Avg staff/day 75
Average shift 7.6 hours
0% compared with Florida average
Florida average: 7.9 hours Florida average shift: 7.9 hoursSee full Florida ranking
Total staff hours (quarter) 52,350

Nursing staff breakdown

Q4 2025 · Oct 1 – Dec 31 More info This data comes from the CMS Payroll-Based Journal report covering October 1 – December 31, 2025.
Registered Nurse

Manages medical care and health needs.

RN Staff Info 36 total: 27 full-time employees and 9 contractors. 36
Average shift length Info Average shift length. Calculated as total hours divided by days worked and average staff per day. 7.7 hours
Licensed Practical Nurse

Assists with medical care and medications.

LPN Staff Info 21 total: 20 full-time employees and 1 contractor. 21
Average shift length Info Average shift length. Calculated as total hours divided by days worked and average staff per day. 8.4 hours
Certified Nursing Assistant

Helps with daily care and mobility.

CNA Staff Info 88 total: 70 full-time employees and 18 contractors. 88
Average shift length Info Average shift length. Calculated as total hours divided by days worked and average staff per day. 7.7 hours

Contractor staffing

Q4 2025 · Oct 1 – Dec 31 More info This data comes from the CMS Payroll-Based Journal report covering October 1 – December 31, 2025.

Total hours from contractors

11.9%

6,219 contractor hours this quarter

Certified Nursing Assistant: 18 Registered Nurse: 9 Speech Language Pathologist: 4 Respiratory Therapy Technician: 4 Physical Therapy Assistant: 4 Physical Therapy Aide: 3 Qualified Social Worker: 2 Licensed Practical Nurse: 1 Medical Director: 1 Occupational Therapy Assistant: 1

Staff by category

Q4 2025 · Oct 1 – Dec 31 More info This data comes from the CMS Payroll-Based Journal report covering October 1 – December 31, 2025.
Certified Nursing Assistant 70 18 88 27,372 92 100% 7.7
Registered Nurse 27 9 36 7,399 92 100% 7.7
Licensed Practical Nurse 20 1 21 5,657 92 100% 8.4
Clinical Nurse Specialist 15 0 15 4,275 92 100% 7.6
Other Dietary Services Staff 4 0 4 1,615 92 100% 7.3
Speech Language Pathologist 0 4 4 875 84 91% 6.1
Physical Therapy Aide 0 3 3 760 81 88% 7.1
Qualified Social Worker 0 2 2 586 66 72% 5.5
Physical Therapy Assistant 0 4 4 554 74 80% 7
Respiratory Therapy Technician 0 4 4 509 77 84% 5.6
Administrator 1 0 1 495 66 72% 7.5
Dietitian 1 0 1 450 60 65% 7.5
Dental Services Staff 1 0 1 443 59 64% 7.5
Occupational Therapy Aide 1 0 1 435 58 63% 7.5
Mental Health Service Worker 1 0 1 413 55 60% 7.5
Nurse Practitioner 1 0 1 405 54 59% 7.5
Occupational Therapy Assistant 0 1 1 57 11 12% 5.2
Medical Director 0 1 1 52 13 14% 4
88 Certified Nursing Assistant
% of Days 100%
36 Registered Nurse
% of Days 100%
21 Licensed Practical Nurse
% of Days 100%
15 Clinical Nurse Specialist
% of Days 100%
4 Other Dietary Services Staff
% of Days 100%
4 Speech Language Pathologist
% of Days 91%
3 Physical Therapy Aide
% of Days 88%
2 Qualified Social Worker
% of Days 72%
4 Physical Therapy Assistant
% of Days 80%
4 Respiratory Therapy Technician
% of Days 84%
1 Administrator
% of Days 72%
1 Dietitian
% of Days 65%
1 Dental Services Staff
% of Days 64%
1 Occupational Therapy Aide
% of Days 63%
1 Mental Health Service Worker
% of Days 60%
1 Nurse Practitioner
% of Days 59%
1 Occupational Therapy Assistant
% of Days 12%
1 Medical Director
% of Days 14%

Penalties and fines

Federal penalties imposed by CMS for regulatory violations, including civil money penalties (fines) and denials of payment for new Medicare/Medicaid admissions.

Source: CMS Penalties Database

No penalties in the past 3 years

No civil money penalties or payment denials were reported in the last 3 years.

Quality of care over time

These measures show how residents usually do over time at this home, based on health outcomes and preventive care.

High-risk clinical events score Info A composite score based on pressure ulcers, falls with injury, weight loss, walking ability decline, and activities of daily living decline. 8.0
8% worse than Florida average

Florida average: 7.4

Functional decline score Info A composite score based on activities of daily living decline, walking ability decline, and incontinence. 16.5
33% worse than Florida average

Florida average: 12.4

Long-stay resident measures
Significantly above average Florida avg: 4.5 Info CMS star rating based on long-stay quality measure performance. 5 stars = significantly above average, 1 star = significantly below average.
Need for Help with Daily Activities Increased Info Percent of long-stay residents whose need for help with daily activities has increased 8.3%
21% better than Florida average

Florida average: 10.5%

Walking Ability Worsened Info Percent of long-stay residents whose ability to move independently worsened 19.4%
50% worse than Florida average

Florida average: 12.9%

Low Risk Residents with Bowel/Bladder Incontinence Info Percent of low risk long-stay residents who lose control of their bowels or bladder 21.6%
60% worse than Florida average

Florida average: 13.5%

Falls with Major Injury Info Percent of long-stay residents experiencing one or more falls with major injury 1.4%
48% better than Florida average

Florida average: 2.6%

High Risk Residents with Pressure Ulcers Info Percent of long-stay high risk residents with pressure ulcers 4.7%
13% better than Florida average

Florida average: 5.4%

Urinary Tract Infection Info Percent of long-stay residents with a urinary tract infection 1.4%
60% worse than Florida average

Florida average: 0.9%

Lost Too Much Weight Info Percent of long-stay residents who lose too much weight 6.4%
8% worse than Florida average

Florida average: 6.0%

Depressive Symptoms Info Percent of long-stay residents who have depressive symptoms 0.6%
82% better than Florida average

Florida average: 3.3%

Antipsychotic Use Info Percent of long-stay residents who received an antipsychotic medication 12.0%
50% worse than Florida average

Florida average: 8.0%

Pneumococcal Vaccine Info Percent of long-stay residents assessed and appropriately given the pneumococcal vaccine 98.4%
In line with Florida average

Florida average: 97.7%

Influenza Vaccine Info Percent of long-stay residents assessed and appropriately given the seasonal influenza vaccine 99.0%
In line with Florida average

Florida average: 99.2%

Hospitalizations per 1,000 days Info Number of hospitalizations per 1,000 long-stay resident days. 2.15
In line with Florida average

Florida average: 2.10

ED visits per 1,000 days Info Number of outpatient emergency department visits per 1,000 long-stay resident days. 0.76
36% better than Florida average

Florida average: 1.18

Short-stay resident measures
Average Florida avg: 3.1 Info CMS star rating based on short-stay quality measure performance. 5 stars = much above average, 1 star = much below average.
Pneumococcal Vaccine Info Percent of short-stay residents assessed and appropriately given the pneumococcal vaccine 96.9%
In line with Florida average

Florida average: 94.0%

Antipsychotic medication increase Info Percent of short-stay residents who newly received an antipsychotic medication 1.8%
20% worse than Florida average

Florida average: 1.5%

Influenza Vaccine Info Percent of short-stay residents assessed and appropriately given the seasonal influenza vaccine 96.5%
In line with Florida average

Florida average: 94.7%

Re-hospitalized after SNF stay Info Percentage of short-stay residents who were re-hospitalized after their nursing home admission. 19.6%
25% better than Florida average

Florida average: 26.2%

Emergency department visits Info Percentage of short-stay residents who had an outpatient emergency department visit. 6.9%
26% better than Florida average

Florida average: 9.3%

Falls with major injury Info Percentage of SNF residents who experience falls with major injury during their stay. 0.0%
100% better than Florida average

Florida average: 0.8%

Ability to care for self at discharge Info Percentage of residents at or above expected ability to care for themselves at discharge. 43.7%
19% worse than Florida average

Florida average: 53.7%

Successful return to home or community Info Rate of successful return to home or community from a skilled nursing facility. 48.9%
In line with Florida average

Florida average: 50.6%

Breakdown by payment type

Medicare

42% of new residents, usually for short-term rehab.

Typical stay 1 - 2 months

Private pay

37% of new residents, often for short stays.

Typical stay 2 - 3 months

Medicaid

21% of new residents, often for long-term daily care.

Typical stay 7 - 8 months

Facility Characteristics

Source: CMS Long-Term Care Facility Characteristics (Data as of Jan 2026)

Total residents 128
Medicare
28
21.9% of residents
Medicaid
68
53.1% of residents
Private pay or other
32
25% of residents
Programs & Services
Residents Group

Residents meet regularly to discuss policies, care quality, and activities

Active Resident Council

Organized group of residents that meets regularly to discuss facility policies, quality of life, and activities.

Finances and operations

Based on CMS SNF Cost Report for fiscal year ending in 12/2023.

Nonprofit
Nonprofit Corporation
Net patient revenue Info Net patient revenue — what the home actually collects for resident care, after contractual allowances, bad debt and discounts are subtracted from its gross charges (CMS cost report, Worksheet G-3). It covers resident care only; money the home earns from other sources is shown separately as "Other income."
$15.6M
Net patient income Info Net patient income: net patient revenue minus the home's total operating expenses. A positive figure means it earns more from resident care than it spends to deliver it; a negative figure means the opposite. It excludes non-operating "other income."
-$4.1M
Nonprofit Nonprofit Corporation
Net patient revenue Info Net patient revenue — what the home actually collects for resident care, after contractual allowances, bad debt and discounts are subtracted from its gross charges (CMS cost report, Worksheet G-3). It covers resident care only; money the home earns from other sources is shown separately as "Other income."
$15.6M Rank #67 / 257Revenue — State benchmarkedThis home is ranked 67th out of 257 homes in Florida. Shows this facility's annual revenue compared to the Florida average. Higher revenue generally means more resources for staffing and capital — read alongside Payroll %.Rankings are based only on facilities in Florida that report data for that category. Facilities without available data are excluded from the ranking.Click the rank badge to see the full State ranking.Click here to see the full State ranking.
Net patient income Info Net patient income: net patient revenue minus the home's total operating expenses. A positive figure means it earns more from resident care than it spends to deliver it; a negative figure means the opposite. It excludes non-operating "other income."
-$4.1M
Other income Info Money the home earns outside of resident care — such as investments, grants, rentals and other non-operating sources (CMS cost report, Worksheet G-3). It is tracked separately from net patient revenue: it is not part of that figure, and it is not included in net patient income.
$4.0M
Payroll costs Info Staff salaries plus wage-related costs — benefits such as payroll taxes, health insurance and retirement — from the home's own accounting records (CMS cost report, Worksheet A). Contract or agency labor is counted separately, under other operating costs. Rank #52 / 257Payroll — State benchmarkedThis home is ranked 52nd out of 257 homes in Florida. Shows total annual staff payroll benchmarked to the Florida average. Higher payroll investment relative to peers often signals better staffing and less reliance on cheaper contract labor.Rankings are based only on facilities in Florida that report data for that category. Facilities without available data are excluded from the ranking.Click the rank badge to see the full State ranking.Click here to see the full State ranking.
$8.1M 52% of net patient revenue Info Payroll as a share of revenue: staff salaries and wage-related benefits divided by net patient revenue. A higher figure means more of each revenue dollar goes to staff pay. Rank #106 / 257Payroll % — State benchmarkedThis home is ranked 106th out of 257 homes in Florida. Shows payroll as a percentage of revenue versus the Florida average. Well-run Florida facilities typically land around 49–56% — the top third Statewide. Below 25% may signal understaffing or heavy agency use — read with Staffing ratings.Rankings are based only on facilities in Florida that report data for that category. Facilities without available data are excluded from the ranking.Click the rank badge to see the full State ranking.Click here to see the full State ranking.
Other operating costs Info Everything it costs to run the home apart from payroll — food, utilities, supplies, maintenance, contract labor and administration. Calculated as total operating expense minus payroll (staff salaries and wage-related benefits).
$11.6M
Total costs Info The home's total operating expense for the year — all the costs of running it, salaries included (CMS cost report, Worksheet G-3).
$19.7M

What does this home offer?

Housing options icon

Housing Options: 1 Bed / 2 Bed

Building type icon
Building type icon

Building Type: High-rise

Beauty services icon

Beauty Services

Transportation services icon

Transportation Services

Housekeeping icon
Housekeeping icon

Housekeeping Services

Social and recreational activities icon

Social and Recreational Activities

Who this home usually serves

TYPE OF STAY

Mostly short-term rehab stays

Most residents typically stay for a few weeks or months before returning home or moving on.

New residents most often arrive under Medicare (42% of admissions), and a typical Medicare stay runs around 1 - 2 months.

Admissions
427 total

Coverage residents most often arrive under.

Medicare 42%
Private pay 37%
Medicaid 21%
Discharges
430 total

Coverage residents most often leave under.

Medicare 43%
Private pay 39%
Medicaid 18%

Places of interest near Lourdes Noreen McKeen Residence

Address 0.4 miles from city center Info Estimated distance in miles from West Palm Beach's city center to Lourdes Noreen McKeen Residence's address, calculated via Google Maps.

Calculate Travel Distance to Lourdes Noreen McKeen Residence

Add your location

Address

Compare Nursing Homes around West Palm Beach

The information below is reported by the Florida Agency for Health Care Administration (AHCA).

2 facilities compared · CMS & FL Dept. of Health data

Lourdes Noreen McKeen Residence
NH
AL
IL
West Palm Beach (Downtown)
132
Facility 132
FL AVG 89
Rank #206 / 1074
85.5%
Facility 85.5%
FL AVG 84.3%
Rank #166 / 258
+1%
4.19
Facility 4.19
FL AVG 4.04
Rank #75 / 253
+57% +4%
$0
Facility $0
FL AVG $78.9k
Rank #1 / 258
-
30
Facility 30
FL AVG 19.7
Rank #210 / 252
10.0
Facility 10.0
FL AVG 4.5
Rank #251 / 252
- 124 -
96
Facility 96
FL AVG 40
Rank #11 / 1486
Judith Naderhoff
$15.6M
Facility $15.6M
FL AVG $15.7M
Rank #67 / 257
$8.1M
Facility $8.1M
FL AVG $6.1M
Rank #52 / 257
52%
Facility 52%
FL AVG 39.8%
Rank #106 / 257
105420
Colonial Skilled Nursing Facility
NH
AL
MC
RC
West Palm Beach
114
Facility 114
FL AVG 89
Rank #363 / 1074
84.1%
Facility 84.1%
FL AVG 84.3%
Rank #171 / 258
0%
4.06
Facility 4.06
FL AVG 4.04
Rank #91 / 253
+38% +1%
$5.4k
Facility $5.4k
FL AVG $78.9k
Rank #166 / 258
64
Facility 64
FL AVG 83
Rank #810 / 876
22
Facility 22
FL AVG 19.7
Rank #161 / 252
7.3
Facility 7.3
FL AVG 4.5
Rank #224 / 252
- 28 A+
23
Facility 23
FL AVG 40
Rank #1034 / 1486
Calm Snf Pbc, LLC
$6.9M
Facility $6.9M
FL AVG $15.7M
Rank #239 / 257
$3.1M
Facility $3.1M
FL AVG $6.1M
Rank #239 / 257
45.4%
Facility 45.4%
FL AVG 39.8%
Rank #160 / 257
105875

Financial Assistance for
Nursing Home in Florida

Lourdes Noreen McKeen Residence is located in West Palm Beach, Florida.
Here are the financial assistance programs available to residents in Florida.

Get Financial aid guidance

Long-Term Care Waiver

Florida Medicaid LTC Waiver

Age 65+ or 21+ disabled
General Florida resident, Medicaid- eligible, nursing home-level care need.
Income Limits (2025) ~$2,829/month 300% FBR, individual
Asset Limits $2,000 (individual), $3,000 (couple).
FL

High demand; waitlists common.

Benefits
In-home care (6-8 hours/day) Assisted living Respite (240 hours/year) Case management

Community Care for the Elderly (CCE)

Florida CCE

Age 60+
General Florida resident, at risk of nursing home.
Income Limits ~$2,000/month varies
Asset Limits $5,000 individual
FL

Limited funding; regional variation.

Benefits
Homemaker services (3-5 hours/week) Adult day care (~$60/day) Respite (up to 10 days/year)

Home Care for the Elderly (HCE)

Florida Home Care for the Elderly

Age 60+
General Florida resident, at risk of nursing home placement; caregiver must be approved.
Income Limits (2025) ~$2,829/month individual, aligned with Medicaid thresholds
Asset Limits ~$2,000 (individual); varies by case manager discretion.
FL

Limited funding (~3,500 served annually); prioritizes low-income frail seniors.

Benefits
Basic subsidy (~$160/month) for housing/medical costs; special subsidies for supplies/services (e.g., incontinence supplies, ~$50-$200/month)

Program of All-Inclusive Care for the Elderly (PACE)

Florida Medicaid PACE

Age 55+
General Florida resident, nursing home-level care need, safe with PACE support.
Income Limits (2025) ~$2,829/month 300% FBR
Asset Limits $2,000 (individual), $3,000 (couple).
FL

Limited to specific counties (e.g., Hillsborough, Miami-Dade); ~10 sites statewide.

Benefits
Personal care (5-7 hours/day) Medical care Meals Transportation Therapy

Optional State Supplementation (OSS)

Florida Optional State Supplementation

Age 65+ or disabled
General Florida resident, living in approved facility, receiving SSI or low-income.
Income Limits (2025) ~$1,004/month individual, including SSI
Asset Limits $2,000 (individual), $3,000 (couple).
FL

Limited to specific facility types; ~$78.40/month max supplement.

Benefits
Cash payment (~$78.40/month) for room/board or personal needs in facilities

Frequently Asked Questions about Lourdes Noreen McKeen Residence

What neighborhood is Lourdes Noreen McKeen Residence in?

Lourdes Noreen McKeen Residence is in the Downtown neighborhood.

Is Lourdes Noreen McKeen Residence in a walkable area?

Lourdes Noreen McKeen Residence has a walk score of 96. Walker's paradise. Daily errands do not require a car, with many shops and services nearby.

What is the occupancy rate at Lourdes Noreen McKeen Residence?

Lourdes Noreen McKeen Residence's occupancy is 85.5%.

Does Lourdes Noreen McKeen Residence operate as a for-profit or non-profit?

Lourdes Noreen McKeen Residence is registered as a non-profit.

Are there photos of Lourdes Noreen McKeen Residence?

Yes — there are 3 photos of Lourdes Noreen McKeen Residence in the photo gallery on this page.

What is the address of Lourdes Noreen McKeen Residence?

Lourdes Noreen McKeen Residence is located at 315 S Flagler Dr, West Palm Beach, FL 33401.

What is the phone number of Lourdes Noreen McKeen Residence?

(561) 504-0210 will put you in contact with the team at Lourdes Noreen McKeen Residence.

Guides for Better Senior Living

Care Cost Calculator: See Prices in Your Area

Nursing Home Data Explorer

Don’t Wait Too Long: 7 Red Flag Signs Your Parent Needs Assisted Living Now

The True Cost of Assisted Living in 2025 – And How Families Are Paying For It

Understanding Senior Living Costs: Pricing Models, Discounts & Financial Assistance