


Occupancy rate
36%
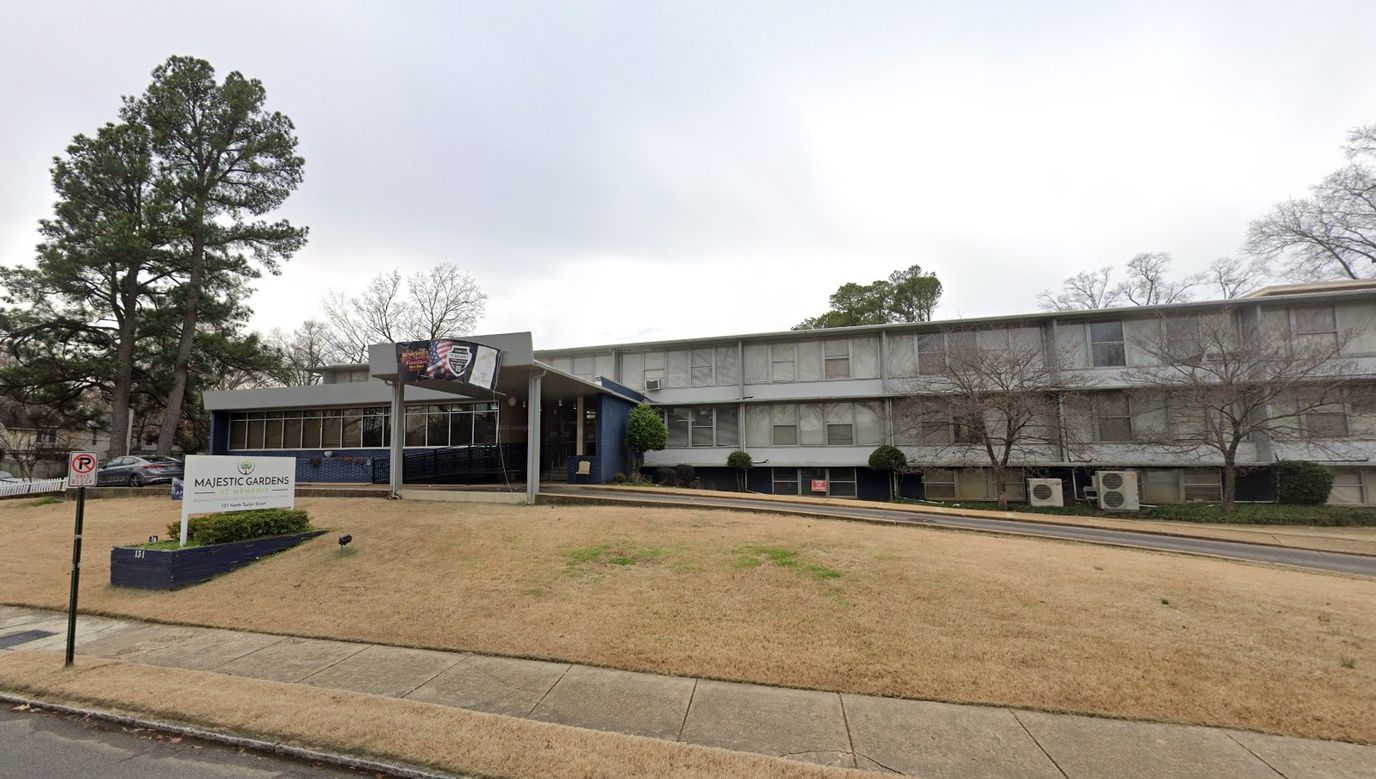
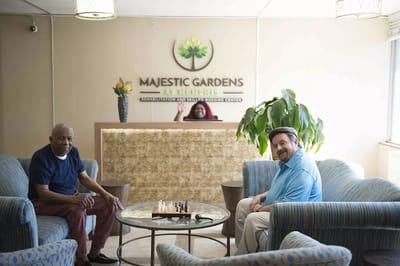
Majestic Gardens at Memphis Rehabilitation and Skilled Nursing is a nursing home in Memphis, TN, that offers skilled nursing and rehabilitation services. Dedicated to older adults’ comfort and safety, the community continuously improves its services to meet their needs. Dietitian-approved meals are served in various dining areas, while pain management and 24-hour MD coverage are among the services provided for residents’ welfare. The community also features a dedicated memory care unit, called the Sunflower Unit, to ensure that residents with memory issues are well-cared for.
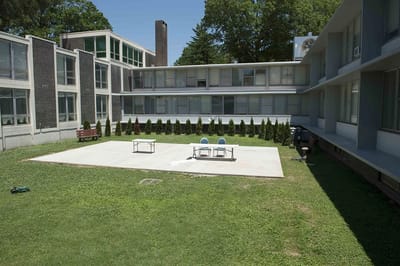
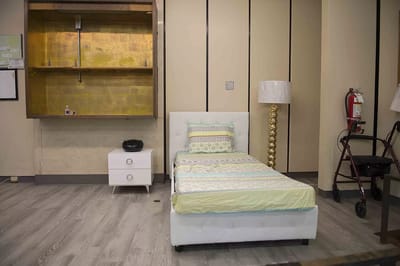
Cultural programs and a full recreation calendar are conducted to enrich residents’ stay. Private and semi-private rooms are also available to meet residents’ preferences. Public transportation, restaurants, and shops are also available nearby, providing residents with access to their needs. This nursing home is ideal for senior living in Tennessee, particularly with its wide range of services.
| Staff type | Hours / Day / Resident | vs state avg |
|---|---|---|
|
Registered Nurse (RN)
| 26m per day | ▼ 30% State avg: 37m per day · National avg: 41m per day |
|
LPN / LVN
| 47m per day | ▼ 29% State avg: 1h 6m per day · National avg: 52m per day |
|
Nurse Aide
| 2h 4m per day | ▼ 4% State avg: 2h 9m per day · National avg: 2h 21m per day |
|
Weekend Total Nursing
| 3h 6m per day | ▼ 8% State avg: 3h 21m per day · National avg: 3h 26m per day |
|
Physical Therapist
| 3m per day | ▼ 48% State avg: 5m per day · National avg: 4m per day |
|
Weekend RN
| 24m per day | ▼ 6% State avg: 25m per day · National avg: 29m per day |
Majestic Gardens at Memphis Rehabilitation and Skilled Nursing Center is legally operated by Majestic Operations, LLC, and administered by Natalie Berkely.
Key information about the people who lead and staff this community.
In Tennessee, the Department of Health, Division of Health Care Facilities performs unannounced inspections and investigations to ensure facilities provide high-quality resident care.
Citations
| This Facility | TN Average | vs. TN Avg |
|---|---|---|---|
|
Total citations
| 53 | 4 | This facility has 1225% more total citations than a typical Tennessee nursing home (53 vs. TN avg 4).↑ 1225% worse |
|
Citations per inspection
| 8.8 | 2 | This facility has 340% more citations per inspection than a typical Tennessee nursing home (8.8 vs. TN avg 2).↑ 340% worse |
Inspections
| This Facility | TN Average | vs. TN Avg |
|---|---|---|---|
|
Total inspections
| 6 | 2 | This facility has had 200% more total inspections than the Tennessee average (6 vs. TN avg 2). More inspections can mean more regulatory scrutiny rather than worse care.↑ 200% more |
Tennessee average 3.5
Last Health inspection on Aug 2025
Tennessee average 15.4
Tennessee average 4.39
Health citations are formal notices following inspections when they fail to comply with safety and care standards.
15 of 41 citations resulted from standard inspections; 15 of 41 resulted from complaint investigations; and 11 of 41 came from combined inspections (standard and complaint).
Tennessee average: 1.1
Tennessee average: 0.6
Reporting period: October 1 – December 31, 2025 (Q4 2025). Source: CMS Payroll-Based Journal report.
Manages medical care and health needs.
Assists with medical care and medications.
Helps with daily care and mobility.
Total hours from contractors
6,962 contractor hours this quarter
| Certified Nursing Assistant | 120 | 35 | 155 | 28,184 | 92 | 100% | 6.9 |
| Licensed Practical Nurse | 35 | 36 | 71 | 10,638 | 92 | 100% | 8.1 |
| Registered Nurse | 13 | 4 | 17 | 3,761 | 92 | 100% | 8.6 |
| Clinical Nurse Specialist | 5 | 0 | 5 | 1,604 | 79 | 86% | 8.5 |
| Speech Language Pathologist | 0 | 7 | 7 | 1,309 | 87 | 95% | 5.6 |
| Physical Therapy Aide | 0 | 4 | 4 | 1,166 | 78 | 85% | 6.8 |
| Physical Therapy Assistant | 0 | 4 | 4 | 1,014 | 72 | 78% | 7.2 |
| Respiratory Therapy Technician | 0 | 4 | 4 | 589 | 84 | 91% | 5.5 |
| Administrator | 1 | 0 | 1 | 512 | 64 | 70% | 8 |
| Qualified Social Worker | 0 | 3 | 3 | 506 | 73 | 79% | 5.6 |
| Nurse Practitioner | 1 | 0 | 1 | 496 | 62 | 67% | 8 |
| Mental Health Service Worker | 1 | 0 | 1 | 464 | 58 | 63% | 8 |
| Dietitian | 1 | 0 | 1 | 464 | 58 | 63% | 8 |
| Dental Services Staff | 1 | 0 | 1 | 456 | 57 | 62% | 8 |
Includes penalties issued in 2023-2024
Federal penalties imposed by CMS for regulatory violations, including civil money penalties (fines) and denials of payment for new Medicare/Medicaid admissions.
Source: CMS Penalties Database (Data as of Jan 2026)
Tennessee average: $86K
Tennessee average: 1.7
Tennessee average: 0.5
Penalties are imposed by CMS for violations of federal nursing home regulations.
11 penalties in the past 3 years
Multiple penalties were reported in the last 3 years.
Last updated: Jan 2026
These measures show how residents usually do over time at this home, based on health outcomes and preventive care.
Tennessee average: 10.5
Tennessee average: 19.5
Tennessee average: 16.0%
Tennessee average: 21.7%
Tennessee average: 20.7%
Tennessee average: 3.7%
Tennessee average: 5.4%
Tennessee average: 2.1%
Tennessee average: 6.3%
Tennessee average: 11.0%
Tennessee average: 16.5%
Tennessee average: 89.9%
Tennessee average: 94.5%
Tennessee average: 1.58
Tennessee average: 1.57
Tennessee average: 79.7%
Tennessee average: 1.7%
Tennessee average: 79.8%
Tennessee average: 22.2%
Tennessee average: 11.2%
Tennessee average: 0.8%
Tennessee average: 53.7%
Tennessee average: 50.6%
Quality measures are calculated from Minimum Data Set (MDS) assessments. For most measures, lower percentages indicate better care quality.
19% of new residents, usually for short-term rehab.
63% of new residents, often for short stays.
18% of new residents, often for long-term daily care.
Source: CMS Long-Term Care Facility Characteristics (Data as of Jan 2026)
Data sourced from CMS Long-Term Care Facility Characteristics quarterly report. Payer mix reflects the current resident census by primary payment source.
Historical financial and operational data for Majestic Gardens at Memphis Rehabilitation and Skilled Nursing Center from 2011–2023, based on CMS SNF Cost Reports.
Key figures below are for fiscal year ending in 12/2023.
Based on CMS SNF Cost Report for fiscal year ending in 12/2023.
No pets allowed
Building Type: Two-story
Residents typically stay for brief periods, with frequent admissions and discharges throughout the year.
Most new residents arrive under private pay (63% of admissions), and a typical private pay stay runs around 1 - 2 months.
Coverage residents most often arrive under.
Coverage residents most often leave under.
![]() 3.2 miles from city center
3.2 miles from city center
![]() Estimated distance in miles from Memphis's city center to Majestic Gardens at Memphis Rehabilitation and Skilled Nursing Center's address, calculated via Google Maps.
— 1.32 miles to nearest hospital (Methodist University Hospital)
Estimated distance in miles from Memphis's city center to Majestic Gardens at Memphis Rehabilitation and Skilled Nursing Center's address, calculated via Google Maps.
— 1.32 miles to nearest hospital (Methodist University Hospital)
Add your location
Info below is compiled from CMS reports & the TN Dept. of Health (TDH), senior community websites & trusted data sources such as Walk Score & BBB.
Communities are listed from highest to lowest based on our ranking methodology.
| Kirby Pines | NH AL IL MC SNF | Memphis | 120
Facility
120
TN AVG
88
Rank
#81 / 425 | - | - | 7.39
Facility
7.39
TN AVG
3.63
Rank
#2 / 177 | +87% | +104% | $0
Facility
$0
TN AVG
$90.9k
Rank
#1 / 182 | 2
Facility
2
TN AVG
15.4
Rank
#1 / 181 | 2.0
Facility
2.0
TN AVG
4.4
Rank
#12 / 181 | - | 7 | - |
31
Facility
31
TN AVG
34
Rank
#303 / 551 | Psalms, Inc | $25.0MFiscal year ending 12/2023
Facility
$25.0MFiscal year ending 12/2023
TN AVG
$11.5M
Rank
#3 / 181 | $9.5MFiscal year ending 12/2023
Facility
$9.5MFiscal year ending 12/2023
TN AVG
$4.6M
Rank
#31 / 181 | 38.2%Fiscal year ending 12/2023
Facility
38.2%Fiscal year ending 12/2023
TN AVG
41%
Rank
#179 / 181 | 445189 | ||||
| Signature HealthCARE of Primacy | NH RC SNF | Memphis (White Station) | 78
Facility
78
TN AVG
88
Rank
#216 / 425 |
65.4%
Facility
65.4%
TN AVG
71.5
Rank
#185 / 272 | -8% | 3.69
Facility
3.69
TN AVG
3.63
Rank
#55 / 177 | +31% | +2% | $0
Facility
$0
TN AVG
$90.9k
Rank
#1 / 182 | 10
Facility
10
TN AVG
15.4
Rank
#57 / 181 | 5.0
Facility
5.0
TN AVG
4.4
Rank
#113 / 181 | - | 51 | - |
53
Facility
53
TN AVG
34
Rank
#108 / 551 | Charla Scott | $13.0MFiscal year ending 12/2023
Facility
$13.0MFiscal year ending 12/2023
TN AVG
$11.5M
Rank
#43 / 181 | $5.4MFiscal year ending 12/2023
Facility
$5.4MFiscal year ending 12/2023
TN AVG
$4.6M
Rank
#89 / 181 | 41.6%Fiscal year ending 12/2023
Facility
41.6%Fiscal year ending 12/2023
TN AVG
41%
Rank
#171 / 181 | 445140 | ||||
| Trezevant | NH AL IL MC SNF | Memphis (Waynoka) | 104
Facility
104
TN AVG
88
Rank
#132 / 425 | - | - | 8.49
Facility
8.49
TN AVG
3.63
Rank
#1 / 177 | +66% | +134% | $0
Facility
$0
TN AVG
$90.9k
Rank
#1 / 182 | 3
Facility
3
TN AVG
15.4
Rank
#10 / 181 | 1.5
Facility
1.5
TN AVG
4.4
Rank
#5 / 181 | - | 11 | A+ |
29
Facility
29
TN AVG
34
Rank
#317 / 551 | Paul Martin | $11.8MFiscal year ending 07/2024
Facility
$11.8MFiscal year ending 07/2024
TN AVG
$11.5M
Rank
#2 / 181 | $17.3MFiscal year ending 07/2024
Facility
$17.3MFiscal year ending 07/2024
TN AVG
$4.6M
Rank
#2 / 181 | 146.9%Fiscal year ending 07/2024
Facility
146.9%Fiscal year ending 07/2024
TN AVG
41%
Rank
#88 / 181 | 445133 | ||||
| Allenbrooke Nursing & Rehab Center | NH SNF | Memphis | 180
Facility
180
TN AVG
88
Rank
#16 / 425 |
85.2%
Facility
85.2%
TN AVG
71.5
Rank
#73 / 272 | +19% | 3.53
Facility
3.53
TN AVG
3.63
Rank
#71 / 177 | -15% | -3% | $8.3k
Facility
$8.3k
TN AVG
$90.9k
Rank
#119 / 182 | 8
Facility
8
TN AVG
15.4
Rank
#41 / 181 | 4.0
Facility
4.0
TN AVG
4.4
Rank
#77 / 181 | 1 | 153 | A+ |
48
Facility
48
TN AVG
34
Rank
#159 / 551 | Richie Anderson | $17.5MFiscal year ending 12/2023
Facility
$17.5MFiscal year ending 12/2023
TN AVG
$11.5M
Rank
#31 / 181 | $11.5MFiscal year ending 12/2023
Facility
$11.5MFiscal year ending 12/2023
TN AVG
$4.6M
Rank
#11 / 181 | 65.5%Fiscal year ending 12/2023
Facility
65.5%Fiscal year ending 12/2023
TN AVG
41%
Rank
#4 / 181 | 445485 | ||||
| Majestic Gardens at Memphis Rehabilitation and Skilled Nursing Center | NH MC SNF | Memphis (Midtown) | 50
Facility
50
TN AVG
88
Rank
#340 / 425 | - | - | 3.62
Facility
3.62
TN AVG
3.63
Rank
#63 / 177 | -29% | 0% | $810.4k
Facility
$810.4k
TN AVG
$90.9k
Rank
#182 / 182 | 41
Facility
41
TN AVG
15.4
Rank
#179 / 181 | 6.8
Facility
6.8
TN AVG
4.4
Rank
#156 / 181 | 7 | 139 | A+ |
80
Facility
80
TN AVG
34
Rank
#7 / 551 | Cnh Memphis Holdings LLC | $14.8MFiscal year ending 12/2023
Facility
$14.8MFiscal year ending 12/2023
TN AVG
$11.5M
Rank
#46 / 181 | $7.3MFiscal year ending 12/2023
Facility
$7.3MFiscal year ending 12/2023
TN AVG
$4.6M
Rank
#30 / 181 | 49.5%Fiscal year ending 12/2023
Facility
49.5%Fiscal year ending 12/2023
TN AVG
41%
Rank
#23 / 181 | 445150 |
Majestic Gardens at Memphis Rehabilitation and Skilled Nursing Center is located in Memphis, Tennessee.
Here are the financial assistance programs available to residents in Tennessee.
Majestic Gardens at Memphis Rehabilitation and Skilled Nursing Center is in the Midtown neighborhood of Memphis.
Majestic Gardens at Memphis Rehabilitation and Skilled Nursing Center is legally operated by Majestic Operations, LLC, and administered by Natalie Berkely.
Majestic Gardens at Memphis Rehabilitation and Skilled Nursing Center has a walk score of 80. Very walkable. Most errands can be accomplished on foot, and many essentials are within a short walk.
According to TN state health department records, Majestic Gardens at Memphis Rehabilitation and Skilled Nursing Center's license number is 00000240.
Majestic Gardens at Memphis Rehabilitation and Skilled Nursing Center's occupancy is 36%.
Majestic Gardens at Memphis Rehabilitation and Skilled Nursing Center has been operating for approximately 34 years, based on available licensing and registration records.
No, Majestic Gardens at Memphis Rehabilitation and Skilled Nursing Center has a no-pet policy.
Care Cost Calculator: See Prices in Your Area
Nursing Home Data Explorer
Don’t Wait Too Long: 7 Red Flag Signs Your Parent Needs Assisted Living Now
The True Cost of Assisted Living in 2025 – And How Families Are Paying For It
Understanding Senior Living Costs: Pricing Models, Discounts & Financial Assistance


