Nursing Home

Mallard Bay Nursing and Rehab

Nursing Home

Mallard Bay Nursing and Rehab

520 Glenburn Ave, Cambridge, MD 21613 View map
Overview of Mallard Bay Nursing and Rehab

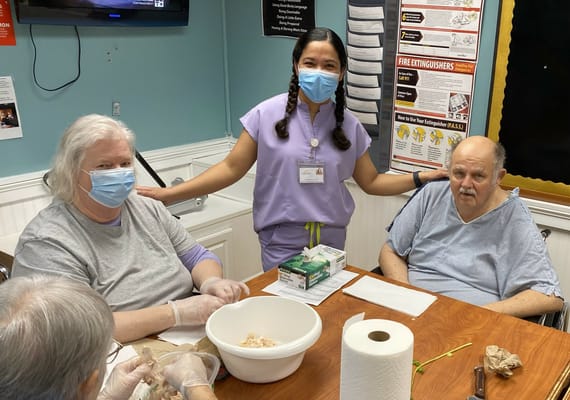
Mallard Bay Nursing and Rehab is a reliable senior care provider in the beautiful city of Cambridge, Maryland, offering short term rehabilitation, respite care, hospice care and long-term care. Committed to providing the highest quality of dedicated care, the community provides a compassionate and knowledgeable team that ensures seniors receive the care and support they need. Their dedicated nursing team and therapists work closely to create individualized care plans that thoroughly meet the needs of each resident.

With a focus on promoting wellness and independence, Mallard Bay offers a range of excellent services to support the physical and emotional well-being of its residents. Their care management team continuously trains and stays updated with changing protocols and best practices in care provision, to ensure residents are always given top-notch care and support. Through its excellent care services and compassionate healthcare professionals, Mallard Bay guarantees residents can quickly get back on their routine with a better quality of life and wellbeing.

(410) 228-9191

Quality ratings

Measured by Centers for Medicare & Medicaid Services (CMS)

Overall rating Info Official CMS rating based on health inspections, staffing and quality measures.
1/5
Maryland average: 3.4/5
Health Inspection Info Official CMS rating based on deficiencies found during state health inspections.
2/5
Maryland average: 3.2/5
Staffing Info Official CMS rating based on nurse staffing hours per resident per day.
1/5
Maryland average: 3.5/5
Quality Measures Info Official CMS rating based on clinical outcomes for residents.
3/5
Maryland average: 3.7/5

Nursing care per resident

Info Average daily nursing hours per resident (adjusted for acuity). Higher values indicate more nursing time per resident.
2h 50m per day

This home provides 34% less nursing time per resident than the Maryland average.

Maryland average: 4h 17m per day

Staffing hours breakdown

Info Hours of care per resident per day, broken down by staff type. Data from CMS Medicare.
Staff type Facility State avg National avg
Registered Nurse (RN) Info Registered nurse hours per resident per day. 28m per day 37m per day 29m per day

Capacity and availability

Medium-capacity home

Offers a balance of services and community atmosphere.

Total beds 160

This home usually has availability

Lower occupancy suggests more openings may be available.

Lower demand than the Maryland average
Occupancy rate 61.3%
Residents per day (avg) 110
Occupancy rate
61.3%
Residents per day (avg)
110

Who this home usually serves

TYPE OF STAY

Mostly short-term rehab stays

Most residents typically stay for a few weeks or months before returning home or moving on.

Might be optimal for
Short stays Recovery Medicare-covered care

Breakdown by payment type

Medicare

61% of new residents, usually for short-term rehab.

Typical stay 1 months

Private pay

28% of new residents, often for short stays.

Typical stay 1 - 2 months

Medicaid

12% of new residents, often for long-term daily care.

Typical stay 1 years

Finances and operations

Privately-owned community
Operated by a partnership between two or more business owners.
Home revenue
$18.8M
Profit
$1.9M
Privately-owned community Operated by a partnership between two or more business owners.
Home revenue
$18,764,214.00
Profit
$1,926,999.00
Payroll costs Info The portion of the home's budget spent on staff, including nurses, caregivers, and other employees who support care and operations.
$6.0M
31.9% of revenue
Other operating costs Info All remaining costs needed to run the home, such as food, utilities, building maintenance, supplies and administrative expenses.
$10.8M
Total costs $16.8M
Walk Score
Walk Score: 33 / 100
Somewhat walkable. A few nearby services may be reachable on foot, but most trips require transportation.
BBB Rating
BBB Rating: A (Not Accredited)
An independent rating from the Better Business Bureau based on factors such as complaint history, transparency, and business practices.
How BBB ratings work

About this community

Care Services

Nursing Services
Rehabilitation Services
Respite Care
Skilled Nursing
Licensed Nurses/CNAs
Short-Term Rehab

All Levels of Care

Skilled Nursing
Rehabilitation
Long-Term Care

Programs & Activities

Specific Programs
Short Term Rehabilitation, Respite Care, Hospice Care, Long-Term Care

What does this home offer?

Housing options icon

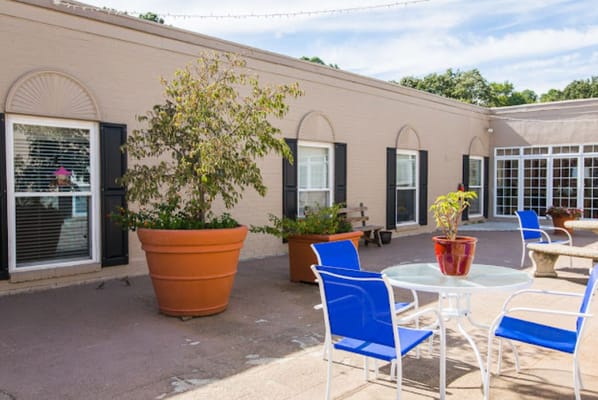
Housing Options: Private Rooms

Building type icon
Building type icon

Building Type: Single-story

Transportation services icon

Transportation Services

Types of Care at Mallard Bay Nursing and Rehab

Nursing Home Hospice Care Respite Care

Health Inspection History

Inspections
Total health inspections 6

Maryland average 3.9


Last Health inspection on Oct 2025

Total health citations 55
Citations per inspection
9.17

Health citations are formal notices following inspections when they fail to comply with safety and care standards.

27 of 55 citations resulted from standard inspections; and 28 of 55 resulted from complaint investigations.

Breakdown of citation severity (last 3 years)
Critical Health citations More info 0
100% better than Maryland average

Maryland average: 0.5


Serious Health citations More info 0
100% better than Maryland average

Maryland average: 0.6

0 critical citations More info Maryland average: 0.5

0 serious citations More info Maryland average: 0.6

55 moderate citations More info Maryland average: 47.2

0 minor citations More info Maryland average: 1.7
Citations history (last 3 years)
Abuse/Neglect moderate citation Oct 22, 2025
Corrected

Care Planning moderate citation Oct 22, 2025
Corrected

Care Planning moderate citation Oct 22, 2025
Corrected

Quality of Care moderate citation Sep 05, 2025
Corrected

Compare Nursing Homes around Cambridge

The information below is reported by the Maryland Department of Health, Office of Health Care Quality.
Mallard Bay Nursing and Rehab
HC

Hospice Care

SNF

Nursing Homes 24/7 care needed

RC

Respite Care

Cambridge
160
A
33
CAMBRIDGE MD OPCO LLC
61.3%
$18,731,653.00
$5,992,024.00
32%
110
1/5
2.8406
2/5
1/5
3/5
-
55
-
+1%
-25%
-26%
Private Rooms
Pines Nursing and Rehab
SNF

Nursing Homes 24/7 care needed

Easton
170
A+
32
MD4 HOLDCO, LLC
50.7%
$10,488,154.00
$4,088,730.00
39%
120
1/5
3.0728
1/5
2/5
2/5
1
168
4
-32%
-19%
-38%
Private Rooms

Places of interest near Mallard Bay Nursing and Rehab

Address 1.8 miles from city center

Address 520 Glenburn Ave, Cambridge, MD 21613

Calculate Travel Distance to Mallard Bay Nursing and Rehab

Add your location

Address

Staffing Data

Source: CMS Payroll-Based Journal (Q2 2025)

127
Total Staff
127
Employees
0
Contractors
37,978
Total Hours (Quarter)
48
Avg Staff/Day
8.7
Avg Shift (hrs)
Nursing Staff Breakdown
Role Count Avg Shift (hrs) Uses Contractors?
Registered Nurse179.9 No
Licensed Practical Nurse2110.4 No
Certified Nursing Assistant588.7 No
Staff by Category
Administration
2 staff
8hs shift avg
Nursing Staff
100 staff
9.1hs shift avg
Physicians & Practitioners
1 staff
8hs shift avg
Therapy Services
16 staff
6.4hs shift avg
Activities & Recreation
0 staff
0hs shift avg
Social Services
2 staff
3.5hs shift avg
Dietary Services
5 staff
7.2hs shift avg
Other Services
1 staff
8hs shift avg
Role Employees Contractors Total Staff Total Hours Days Worked % of Days Avg Shift (hrs)
Certified Nursing Assistant5805820,25691100%8.7
Licensed Practical Nurse210216,21791100%10.4
Registered Nurse170174,22591100%9.9
Other Dietary Services Staff4041,3559099%7.8
Speech Language Pathologist5051,2187279%6.2
Physical Therapy Aide3038476470%7
Physical Therapy Assistant4046387481%7
Medication Aide/Technician3035686673%7.4
Administrator1015126470%8
RN Director of Nursing1014836066%8
Nurse Practitioner1014645864%8
Respiratory Therapy Technician4044105459%5.3
Medical Director1013444347%8
Dietitian1013356167%5.5
Mental Health Service Worker1016489%8
Qualified Social Worker202421112%3.5

Facility Characteristics

Source: CMS Long-Term Care Facility Characteristics (Data as of Jan 2026)

Total census
111 residents
Residents by payment source
Medicare
7 residents (6.3%)
Medicaid
74 residents (66.7%)
Private pay or other
30 residents (27%)
Programs & Services
Residents' Group

Residents meet regularly to discuss policies, care quality, and activities

Active Resident Council

Organized group of residents that meets regularly to discuss facility policies, quality of life, and activities.

Quality of care over time

These measures show how residents usually do over time at this home, based on health outcomes and preventive care.

High-risk clinical events score Info A composite score based on pressure ulcers, falls with injury, weight loss, walking ability decline, and activities of daily living decline. 21.4
65% worse than Maryland average

Maryland average: 12.9

Functional decline score Info A composite score based on activities of daily living decline, walking ability decline, and incontinence. 41.3
61% worse than Maryland average

Maryland average: 25.7

Long-stay resident measures
Average Maryland avg: 3.8 Info CMS star rating based on long-stay quality measure performance. 5 stars = significantly above average, 1 star = significantly below average.
Need for Help with Daily Activities Increased Info Percent of long-stay residents whose need for help with daily activities has increased 39.0%
64% worse than Maryland average

Maryland average: 23.7%

Walking Ability Worsened Info Percent of long-stay residents whose ability to move independently worsened 54.5%
97% worse than Maryland average

Maryland average: 27.7%

Low Risk Residents with Bowel/Bladder Incontinence Info Percent of low risk long-stay residents who lose control of their bowels or bladder 30.3%
17% worse than Maryland average

Maryland average: 25.9%

Falls with Major Injury Info Percent of long-stay residents experiencing one or more falls with major injury 2.4%
6% worse than Maryland average

Maryland average: 2.3%

High Risk Residents with Pressure Ulcers Info Percent of long-stay high risk residents with pressure ulcers 6.3%
In line with Maryland average

Maryland average: 6.5%

Urinary Tract Infection Info Percent of long-stay residents with a urinary tract infection 1.9%
16% worse than Maryland average

Maryland average: 1.6%

Lost Too Much Weight Info Percent of long-stay residents who lose too much weight 4.7%
18% better than Maryland average

Maryland average: 5.8%

Depressive Symptoms Info Percent of long-stay residents who have depressive symptoms 23.4%
16% worse than Maryland average

Maryland average: 20.2%

Antipsychotic Use Info Percent of long-stay residents who received an antipsychotic medication 14.9%
15% worse than Maryland average

Maryland average: 12.9%

Pneumococcal Vaccine Info Percent of long-stay residents assessed and appropriately given the pneumococcal vaccine 58.2%
37% worse than Maryland average

Maryland average: 92.0%

Influenza Vaccine Info Percent of long-stay residents assessed and appropriately given the seasonal influenza vaccine 92.3%
In line with Maryland average

Maryland average: 96.6%

Hospitalizations per 1,000 days Info Number of hospitalizations per 1,000 long-stay resident days. 0.28
79% better than Maryland average

Maryland average: 1.32

ED visits per 1,000 days Info Number of outpatient emergency department visits per 1,000 long-stay resident days. 0.68
44% better than Maryland average

Maryland average: 1.21

Short-stay resident measures
Significantly above average Maryland avg: 3.7 Info CMS star rating based on short-stay quality measure performance. 5 stars = much above average, 1 star = much below average.
Pneumococcal Vaccine Info Percent of short-stay residents assessed and appropriately given the pneumococcal vaccine 35.4%
55% worse than Maryland average

Maryland average: 78.4%

Antipsychotic medication increase Info Percent of short-stay residents who newly received an antipsychotic medication 1.5%
8% worse than Maryland average

Maryland average: 1.4%

Influenza Vaccine Info Percent of short-stay residents assessed and appropriately given the seasonal influenza vaccine 72.1%
11% worse than Maryland average

Maryland average: 80.6%

Re-hospitalized after SNF stay Info Percentage of short-stay residents who were re-hospitalized after their nursing home admission. 12.6%
41% better than Maryland average

Maryland average: 21.2%

Emergency department visits Info Percentage of short-stay residents who had an outpatient emergency department visit. 7.3%
26% better than Maryland average

Maryland average: 9.9%

Falls with major injury Info Percentage of SNF residents who experience falls with major injury during their stay. 0.6%
18% better than Maryland average

Maryland average: 0.8%

Ability to care for self at discharge Info Percentage of residents at or above expected ability to care for themselves at discharge. 45.2%
16% worse than Maryland average

Maryland average: 53.7%

Successful return to home or community Info Rate of successful return to home or community from a skilled nursing facility. 57.8%
14% better than Maryland average

Maryland average: 50.6%

Guides for Better Senior Living

Care Cost Calculator: See Prices in Your Area

Nursing Home Data Explorer

Don’t Wait Too Long: 7 Red Flag Signs Your Parent Needs Assisted Living Now

The True Cost of Assisted Living in 2025 – And How Families Are Paying For It

Understanding Senior Living Costs: Pricing Models, Discounts & Financial Assistance

Financial Aid for Maryland Seniors

Get financial aid guidance

Community Options Waiver

Maryland Medicaid Community Options Waiver

Age 65+ or disabled, Maryland resident, Medicaid- eligible, nursing home-level care need.

~$2,829/month (300% FBR, individual).

$2,000 (individual), $3,000 (couple) (excludes home, car).

High urban demand; rural outreach efforts.

Senior Care Program

Maryland Senior Care

Age 65+, Maryland resident, at risk of nursing home placement.

~$2,000/month (individual, varies by county).

$11,000 (individual).

Limited funding; waitlists common in high-demand areas.

Maryland Nursing Home Medicaid

Maryland Medical Assistance (Medicaid) Nursing Home Program

Age 65+, Maryland resident, Medicaid-eligible, requires nursing home-level care.

$943/month (individual); most income applied to care costs.

$2,500 (individual), $3,000 (couple); spousal protections up to $155,356.

Home equity limit $636,000; estate recovery applies post-55.

Senior Assisted Living Subsidy Program

Maryland Senior Assisted Living Group Home Subsidy

Age 62+, Maryland resident, in or moving to approved assisted living, low/moderate income.

~$34,000/year (individual, varies by county).

Not strict; prioritizes low-income.

Not available statewide; facility must be licensed by MDH.

Veterans Aid and Attendance (A&A) Benefit

Maryland VA Aid and Attendance

Wartime veteran/spouse, age 65+ or disabled, needs ADL help, Maryland resident.

Net income minus medical expenses < $1,984/month (individual with A&A).

$155,356 (net worth limit).

High veteran population in suburban/rural areas.

Senior Prescription Drug Assistance Program (SPDAP)

Maryland Senior Prescription Drug Assistance Program

Age 65+, Maryland resident (6+ months), Medicare Part D enrolled.

$48,560/year (individual, 300% FPL).

None specified.

Supplements Medicare Part D; annual enrollment required.

Medicare Savings Programs (MSP)

Maryland Medicare Savings Programs

Age 65+, Maryland resident, Medicare Part A/B enrollee.

$2,014/month (QMB), $2,706/month (SLMB/QI, individual).

$9,090 (individual), $13,630 (couple).

Includes QMB, SLMB, QI categories.

Community Personal Assistance Services (CPAS)

Maryland Medicaid Community Personal Assistance Services

Age 65+, Maryland resident, Medicaid-eligible, needs ADL assistance.

$943/month (individual); spend-down available.

$2,500 (individual), $3,000 (couple).

Consumer-directed option allows hiring family caregivers.

Tour Icon
Planning a tour? Check our touring checklist.
Chat Icon
Thinking of living here? We can help you speak to a current resident