Mallard Bay Nursing and Rehab
Nursing Home, Hospice Care & Respite Care · Cambridge, MD
CMS overall rating Info The Overall CMS Rating is scored from 1 to 5 stars and combines results from health inspections, staffing levels, and quality measures. Health inspections carry the most weight. Staffing and quality scores can increase or decrease the final rating based on performance compared to state and national standards.

Mallard Bay Nursing and Rehab

Nursing Home, Hospice Care & Respite Care · Cambridge, MD
CMS overall rating Info The Overall CMS Rating is scored from 1 to 5 stars and combines results from health inspections, staffing levels, and quality measures. Health inspections carry the most weight. Staffing and quality scores can increase or decrease the final rating based on performance compared to state and national standards.
Calculator: See prices in your area
Mallard Bay Nursing and Rehab accepts Medicare, Medicaid, and private pay.

Overview of Mallard Bay Nursing and Rehab

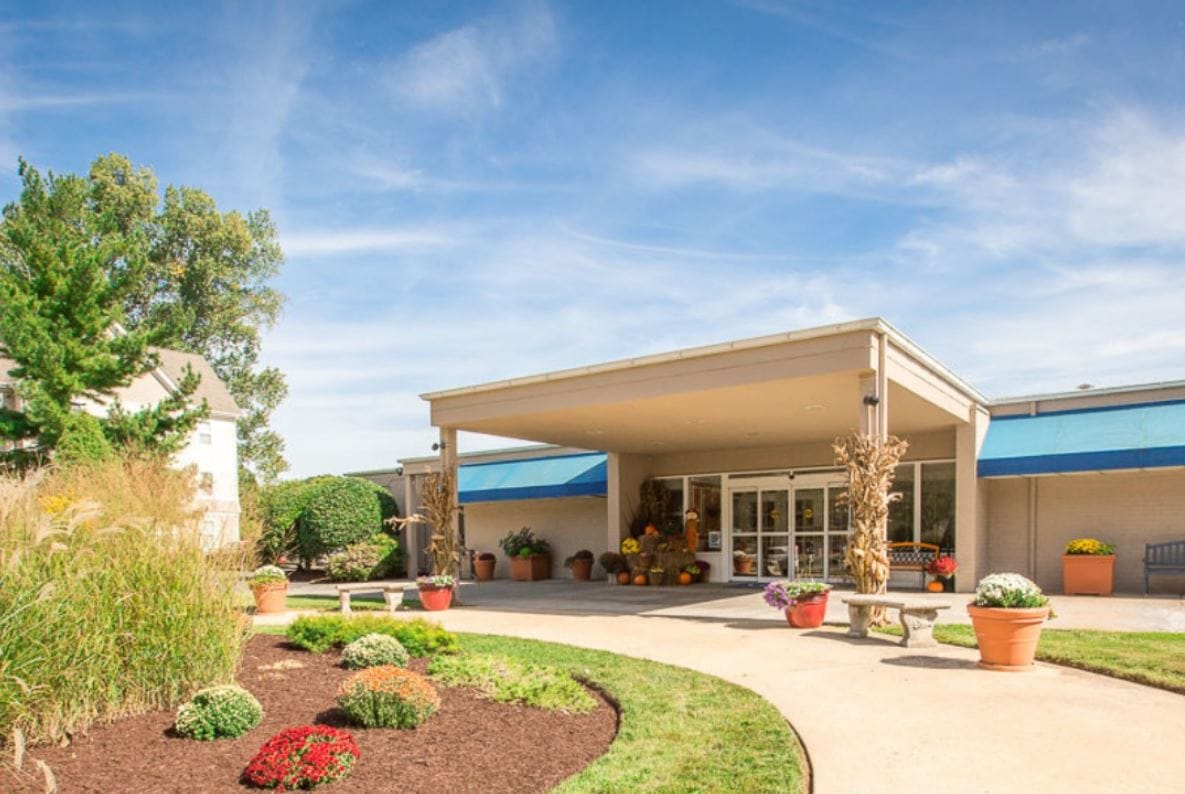
Mallard Bay Nursing and Rehab is a reliable senior care provider in the beautiful city of Cambridge, Maryland, offering short term rehabilitation, respite care, hospice care and long-term care. Committed to providing the highest quality of dedicated care, the community provides a compassionate and knowledgeable team that ensures seniors receive the care and support they need. Their dedicated nursing team and therapists work closely to create individualized care plans that thoroughly meet the needs of each resident.

With a focus on promoting wellness and independence, Mallard Bay offers a range of excellent services to support the physical and emotional well-being of its residents. Their care management team continuously trains and stays updated with changing protocols and best practices in care provision, to ensure residents are always given top-notch care and support. Through its excellent care services and compassionate healthcare professionals, Mallard Bay guarantees residents can quickly get back on their routine with a better quality of life and wellbeing.

(410) 228-9191

Quality ratings

Measured by Centers for Medicare & Medicaid Services (CMS)

Overall rating Info The Overall CMS Rating combines results from health inspections, staffing levels and quality measures. Health inspections carry the most weight. Staffing and quality scores can increase or decrease the final rating based on performance compared to state and national standards.
▼ 70.7% Below MD avg.
Health Inspection Info Based on the results of the facility's three most recent standard inspections and any complaint investigations. CMS reviews the number, scope, and severity of deficiencies, with more recent findings weighted more heavily.
▼ 37.5% Below MD avg.
Staffing Info Measures average nursing staff hours per resident per day, including Registered Nurses (RNs) and total nursing staff. Ratings are adjusted based on the level of care residents require and are compared to state and national benchmarks.
▼ 71.8% Below MD avg.
Quality Measures Info Based on clinical and physical health indicators reported to CMS, such as hospital readmissions, falls, pressure ulcers, and improvements in mobility. These measures reflect how well residents' health needs are being managed.
▼ 19.6% Below MD avg.

Staffing hours breakdown

Info Daily nursing hours per resident by staff type, reported to CMS. Higher is generally better — compare this facility to state and national averages to see where staffing stands.

Hours per resident per day — compared to Maryland state averages

Total nursing care / resident Info This home is ranked 104th out of 106 homes in Maryland.

Total adjusted nursing hours per resident per day, combining RN, LPN, and aide time. CMS adjusts this for case-mix so facilities can be fairly compared.
2h 50m per day
Rank #104 / 106Nurse hours — state benchmarkedThis home is ranked 104th out of 106 homes in Maryland.Shows adjusted nurse hours per resident per day benchmarked to the Maryland average, with a ranking across 106 Maryland SNFs. More hours mean more direct care. The national average is about 3.5 hrs; below 3.0 is a red flag.
This facility Maryland avg (4h 17m per day)
vs Maryland avg
-34%

6 of 6 metrics below state avg

Staff typeHours / dayvs state avg
Registered Nurse (RN) Info RNs hold the highest nursing license and can assess residents, interpret test results, and direct care plans. More RN hours per day often signals stronger clinical oversight and faster response to health changes. 33m per day ▼ 34% State avg: 50m per day · National avg: 41m per day
LPN / LVN Info Licensed Practical Nurses (LPNs) or Licensed Vocational Nurses (LVNs) deliver routine hands-on care — medication administration, wound dressing, and monitoring vital signs. They work under RN supervision and make up a large share of daily bedside care. 34m per day ▼ 37% State avg: 54m per day · National avg: 52m per day
Nurse Aide Info Certified Nurse Aides (CNAs) provide the most direct day-to-day assistance: bathing, dressing, feeding, and mobility. Nurse aide hours are typically the largest staffing category and directly affect residents' quality of life. 2h 6m per day ▼ 3% State avg: 2h 10m per day · National avg: 2h 21m per day
Total Nursing (Weekend) Info Combined nursing hours (RN + LPN + Nurse Aide) per resident per day on weekends. Staffing often drops on weekends — this figure reveals whether the facility maintains adequate coverage outside of weekday hours. 2h 53m per day ▼ 17% State avg: 3h 29m per day · National avg: 3h 26m per day
Physical Therapist Info Hours per resident per day provided by licensed Physical Therapists (PTs) or PT Assistants. PT services help residents recover mobility after injury or illness and are especially important for post-acute (short-stay) rehabilitation. 1m per day ▼ 80% State avg: 5m per day · National avg: 4m per day
RN (Weekend) Info Registered nurse hours specifically on weekends. Facilities sometimes reduce RN presence on Saturdays and Sundays — a low weekend RN figure compared to weekday hours can indicate reduced clinical oversight when most administrative staff are absent. 28m per day ▼ 24% State avg: 37m per day · National avg: 29m per day

Capacity and availability

This home usually has availability

Occupancy lower than 85% suggests more openings may be available.

Lower occupancy than the Maryland average: 82.4%
Occupancy rate 25% Rank #106 / 109Occupancy rate — state benchmarkedThis home is ranked 106th out of 109 homes in Maryland.Shows this facility's occupancy rate versus the Maryland average, with its statewide rank out of 109. Higher occupancy signals strong local demand and financial stability.
Avg. Length of Stay 93 days
Occupancy rate
25% Rank #106 / 109Occupancy rate — state benchmarkedThis home is ranked 106th out of 109 homes in Maryland.Shows this facility's occupancy rate versus the Maryland average, with its statewide rank out of 109. Higher occupancy signals strong local demand and financial stability.
Avg. Length of Stay
93 days

Who this home usually serves

TYPE OF STAY

Mostly short-term rehab stays

Most residents typically stay for a few weeks or months before returning home or moving on.

Breakdown by payment type

Medicare

61% of new residents, usually for short-term rehab.

Typical stay 1 months

Private pay

28% of new residents, often for short stays.

Typical stay 1 - 2 months

Medicaid

12% of new residents, often for long-term daily care.

Typical stay 1 years

Finances and operations

Privately-owned community
Operated by a partnership between two or more business owners.
Home revenue
$18.8M
Profit
$1.9M
Privately-owned community Operated by a partnership between two or more business owners.
Home revenue
$18.8M Rank #45 / 109Revenue — state benchmarkedThis home is ranked 45th out of 109 homes in Maryland.Shows this facility's annual revenue compared to the Maryland SNF average. Higher revenue generally means more resources for staffing and capital — read alongside Payroll %.
Profit
$1.9M
Payroll costs Info The portion of the home's budget spent on staff, including nurses, caregivers, and other employees who support care and operations. Rank #44 / 109Payroll — state benchmarkedThis home is ranked 44th out of 109 homes in Maryland.Shows total annual staff payroll benchmarked to the Maryland average. Higher payroll investment relative to peers often signals better staffing and less reliance on cheaper contract labor.
$8.1M
43.1% of revenue Rank #57 / 109Payroll % — state benchmarkedThis home is ranked 57th out of 109 homes in Maryland.Shows payroll as a percentage of revenue versus the Maryland average. Well-run SNFs often land around 55–65%. Below 25% may signal understaffing or heavy agency use — read with Staffing ratings.
Other operating costs Info All remaining costs needed to run the home, such as food, utilities, building maintenance, supplies and administrative expenses.
$8.7M
Total costs $16.8M
Walk Score
Walk Score: 33 / 100 Rank #64 / 91Walk Score — state benchmarkedThis home is ranked 64th out of 91 homes in Maryland.Shows how walkable this facility's neighborhood is compared to the average Walk Score across Maryland SNFs. Higher scores benefit residents, families, and staff.
Somewhat walkable. A few nearby services may be reachable on foot, but most trips require transportation.
BBB Rating
BBB Rating: A (Not Accredited)
An independent rating from the Better Business Bureau based on factors such as complaint history, transparency, and business practices.
How BBB ratings work

About this community

Therapy & Rehabilitation

3 services
Rehabilitation Services
Respite Care
Short-Term Rehab

Amenities & Lifestyle

Specific ProgramsShort Term Rehabilitation

What does this home offer?

Housing options icon

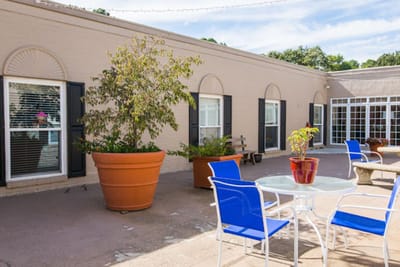
Housing Options: Private Rooms

Building type icon
Building type icon

Building Type: Single-story

Transportation services icon

Transportation Services

Types of Care at Mallard Bay Nursing and Rehab

Nursing Home Hospice Care Respite Care

Contact Mallard Bay Nursing and Rehab

Inspection History

In Maryland, the Department of Health, Office of Health Care Quality is the state agency that conducts unannounced inspections and issues reports for all assisted living and nursing facilities.

Since 2018 · 8 years of data 53 citations

Inspection Scorecard Info This scorecard compares key inspection, citation, and complaint metrics at this facility against the Maryland state average. Metrics rated ≥15% worse than average are highlighted in red; those ≥15% better are highlighted in green.

Since 2018 vs. Maryland state average
Overall vs. MD average 2 Worse Metrics worse than Maryland average:
• Total citations (1225% above)
• Citations per year (1220% above)
0 Better No metrics in this bucket.
Latest Inspection October 22, 2025 Complaint Investigation

Citations Info Citations are formal regulatory issues recorded during state inspections.

MetricThis FacilityMD Averagevs. MD Avg
Total citations Info Formal regulatory issues recorded by inspectors across all inspection types. 534 This facility has 1225% more total citations than a typical Maryland nursing home (53 vs. MD avg 4).↑ 1225% worse
Citations per year Info Average citations per year since 2018. 6.60.5 This facility has 1220% more citations per year than a typical Maryland nursing home (6.6 vs. MD avg 0.5).↑ 1220% worse

Inspection Reports Summary Info An editor-reviewed summary of the themes and findings across this facility's recent inspection reports.

The most recent inspection on October 22, 2025, identified deficiencies related to improper use of physical restraints, incomplete care plan updates, and inaccurate medical record documentation. Earlier inspections showed a pattern of issues including wound care deficiencies, medication mismanagement, incomplete care plans, and lapses in resident dignity and safety. Complaint investigations substantiated concerns about wound care neglect and restraint use, with disciplinary actions taken but no fines or license actions listed in the available reports. Prior reports noted problems with staffing, abuse reporting, and documentation accuracy, but enforcement actions such as fines or license suspensions were not mentioned. The inspection history indicates ongoing challenges with care planning and documentation, with no clear improvement trend evident.

Read the full inspection reports for this facility, including detailed findings and corrective actions.

Show Inspection Reports

Health Inspection History

Inspections
Total health inspections 6

Maryland average 3.9


Last Health inspection on Oct 2025

Total health citations
55 Rank #72 / 108Health citations — state benchmarkedThis home is ranked 72nd out of 108 homes in Maryland.Shows this facility's total health deficiency citations benchmarked to the Maryland state average, with a ranking across all 108 MD SNFs. Lower citation counts earn a better rank.

Maryland average 49.9

Citations per inspection
9.17 Rank #39 / 108Citations per inspection — state benchmarkedThis home is ranked 39th out of 108 homes in Maryland.Shows average deficiency citations per CMS inspection for this facility versus the Maryland mean across 108 SNFs with citation data. Lower is better.

Maryland average 12.81


Health citations are formal notices following inspections when they fail to comply with safety and care standards.

27 of 55 citations resulted from standard inspections; and 28 of 55 resulted from complaint investigations.

Breakdown of citation severity (last 8 years)
Critical Health citations More info
0
100% better than Maryland average

Maryland average: 0.5


Serious Health citations More info 0
100% better than Maryland average

Maryland average: 0.6

0 critical citations More info Maryland average: 0.5

0 serious citations More info Maryland average: 0.6

55 moderate citations More info Maryland average: 47.2

0 minor citations More info Maryland average: 1.7
Citations history (last 8 years)
Abuse/Neglect moderate citation Info Issues related to protecting resident's from harm, including abuse, neglect, or mistreatment. Oct 22, 2025
Corrected

Care Planning moderate citation Info Issues related to creating and updating personalized care plans for residents based on their needs and conditions. Oct 22, 2025
Corrected

Care Planning moderate citation Info Issues related to creating and updating personalized care plans for residents based on their needs and conditions. Oct 22, 2025
Corrected

Quality of Care moderate citation Info Issues related to how well residents receive appropriate treatment and support for their medical and daily care needs. Sep 05, 2025
Corrected

Financial Assistance for
Nursing Home in Maryland

Mallard Bay Nursing and Rehab is located in Cambridge, Maryland.
Here are the financial assistance programs available to residents in Maryland.

Get Financial aid guidance

Community Options Waiver

Maryland Medicaid Community Options Waiver

Age 65+ or disabled
General Maryland resident, Medicaid- eligible, nursing home-level care need.
Income Limits (2025) ~$2,829/month 300% FBR, individual
Asset Limits $2,000 (individual), $3,000 (couple) (excludes home, car).
MD

High urban demand; rural outreach efforts.

Benefits
Personal care (5-7 hours/day, e.g., bathing, dressing) Respite care (up to 240 hours/year) Adult day care ($70/day) Home modifications ($1,500 avg.)

Senior Care Program

Maryland Senior Care

Age 65+
General Maryland resident, at risk of nursing home placement.
Income Limits ~$2,000/month individual, varies by county
Asset Limits $11,000 individual
MD

Limited funding; waitlists common in high-demand areas.

Benefits
In-home care (3-5 hours/week) Respite care (up to 10 days/year) Meals (~$6/meal) Transportation (~5 trips/month) Case management

Maryland Nursing Home Medicaid

Maryland Medical Assistance (Medicaid) Nursing Home Program

Age 65+
General Maryland resident, Medicaid-eligible, requires nursing home-level care.
Income Limits (2025) $943/month (individual); most income applied to care costs.
Asset Limits $2,500 (individual), $3,000 (couple); spousal protections up to $155,356.
MD

Home equity limit $636,000; estate recovery applies post-55.

Benefits
24/7 nursing care Meals Therapy Medications (unlimited per medical need)

Senior Assisted Living Subsidy Program

Maryland Senior Assisted Living Group Home Subsidy

Age 62+
General Maryland resident, in or moving to approved assisted living, low/moderate income.
Income Limits (2025) ~$34,000/year individual, varies by county
Asset Limits Not strict; prioritizes low-income.
MD

Not available statewide; facility must be licensed by MDH.

Benefits
Personal care Meals 24-hour supervision (up to $1,500/month subsidy typical)

Veterans Aid and Attendance (A&A) Benefit

Maryland VA Aid and Attendance

Age
General Wartime veteran/spouse, age 65+ or disabled, needs ADL help, Maryland resident.
Income Limits (2025) Net income minus medical expenses < $1,984/month individual with A&A
Asset Limits $155,356 net worth limit
MD

High veteran population in suburban/rural areas.

Benefits
Cash benefit ($1,478-$2,471/month, varies by status) for care costs

Senior Prescription Drug Assistance Program (SPDAP)

Maryland Senior Prescription Drug Assistance Program

Age 65+
General Maryland resident (6+ months), Medicare Part D enrolled.
Income Limits (2025) $48,560/year individual, 300% FPL
Asset Limits None specified.
MD

Supplements Medicare Part D; annual enrollment required.

Benefits
Up to $40/month premium subsidy Reducing drug costs

Medicare Savings Programs (MSP)

Maryland Medicare Savings Programs

Age 65+
General Maryland resident, Medicare Part A/B enrollee.
Income Limits (2025) $2,014/month (QMB), $2,706/month (SLMB/QI, individual).
Asset Limits $9,090 (individual), $13,630 (couple).
MD

Includes QMB, SLMB, QI categories.

Benefits
Covers premiums (up to $174.70/month Part B) Co-pays Deductibles

Community Personal Assistance Services (CPAS)

Maryland Medicaid Community Personal Assistance Services

Age 65+
General Maryland resident, Medicaid-eligible, needs ADL assistance.
Income Limits (2025) $943/month (individual); spend-down available.
Asset Limits $2,500 (individual), $3,000 (couple).
MD

Consumer-directed option allows hiring family caregivers.

Benefits
Personal care (hours vary, typically 20-30/week) Chores Nurse supervision

Places of interest near Mallard Bay Nursing and Rehab

Address 1.8 miles from city center Info Estimated distance in miles from Cambridge's city center to Mallard Bay Nursing and Rehab's address, calculated via Google Maps.

Calculate Travel Distance to Mallard Bay Nursing and Rehab

Add your location

Address

Staffing Data (Q2 2025)

This data corresponds to Q2 2025 and is based on CMS Payroll-Based Journal.

Total staff 127
Employees 127
Contractors 0
Staff to resident ratio 1.14:1
37% worse than Maryland average

Maryland average ratio: 1.81:1

Avg staff/day 48
Average shift 8.7 hours
9% better than Maryland average

Maryland average: 8 hours

Total staff hours (quarter) 37,978

Nursing staff breakdown

Registered Nurse

Manages medical care and health needs.

Total count 17
Average shift length Info Average shift length. Calculated as total hours divided by days worked and average staff per day. 9.9 hours

No contractors work on this role.

Licensed Practical Nurse

Assists with medical care and medications.

Total count 21
Average shift length Info Average shift length. Calculated as total hours divided by days worked and average staff per day. 10.4 hours

No contractors work on this role.

Certified Nursing Assistant

Helps with daily care and mobility.

Total count 58
Average shift length Info Average shift length. Calculated as total hours divided by days worked and average staff per day. 8.7 hours

No contractors work on this role.

Contractor staffing

Total hours from contractors

0%

0 contractor hours this quarter

No contractor roles were reported this quarter.

Staff by category

Certified Nursing Assistant5805820,25691100%8.7
Licensed Practical Nurse210216,21791100%10.4
Registered Nurse170174,22591100%9.9
Other Dietary Services Staff4041,3559099%7.8
Speech Language Pathologist5051,2187279%6.2
Physical Therapy Aide3038476470%7
Physical Therapy Assistant4046387481%7
Medication Aide/Technician3035686673%7.4
Administrator1015126470%8
RN Director of Nursing1014836066%8
Nurse Practitioner1014645864%8
Respiratory Therapy Technician4044105459%5.3
Medical Director1013444347%8
Dietitian1013356167%5.5
Mental Health Service Worker1016489%8
Qualified Social Worker202421112%3.5
58 Certified Nursing Assistant
% of Days 100%
21 Licensed Practical Nurse
% of Days 100%
17 Registered Nurse
% of Days 100%
4 Other Dietary Services Staff
% of Days 99%
5 Speech Language Pathologist
% of Days 79%
3 Physical Therapy Aide
% of Days 70%
4 Physical Therapy Assistant
% of Days 81%
3 Medication Aide/Technician
% of Days 73%
1 Administrator
% of Days 70%
1 RN Director of Nursing
% of Days 66%
1 Nurse Practitioner
% of Days 64%
4 Respiratory Therapy Technician
% of Days 59%
1 Medical Director
% of Days 47%
1 Dietitian
% of Days 67%
1 Mental Health Service Worker
% of Days 9%
2 Qualified Social Worker
% of Days 12%

Facility Characteristics

Source: CMS Long-Term Care Facility Characteristics (Data as of Jan 2026)

Total residents 111
Medicare
7
6.3% of residents
Medicaid
74
66.7% of residents
Private pay or other
30
27% of residents
Programs & Services
Residents Group

Residents meet regularly to discuss policies, care quality, and activities

Active Resident Council

Organized group of residents that meets regularly to discuss facility policies, quality of life, and activities.

Quality of care over time

These measures show how residents usually do over time at this home, based on health outcomes and preventive care.

High-risk clinical events score Info A composite score based on pressure ulcers, falls with injury, weight loss, walking ability decline, and activities of daily living decline. 21.4
65% worse than Maryland average

Maryland average: 12.9

Functional decline score Info A composite score based on activities of daily living decline, walking ability decline, and incontinence. 41.3
61% worse than Maryland average

Maryland average: 25.7

Long-stay resident measures
Average Maryland avg: 3.7 Info CMS star rating based on long-stay quality measure performance. 5 stars = significantly above average, 1 star = significantly below average.
Need for Help with Daily Activities Increased Info Percent of long-stay residents whose need for help with daily activities has increased 39.0%
64% worse than Maryland average

Maryland average: 23.7%

Walking Ability Worsened Info Percent of long-stay residents whose ability to move independently worsened 54.5%
97% worse than Maryland average

Maryland average: 27.7%

Low Risk Residents with Bowel/Bladder Incontinence Info Percent of low risk long-stay residents who lose control of their bowels or bladder 30.3%
17% worse than Maryland average

Maryland average: 25.9%

Falls with Major Injury Info Percent of long-stay residents experiencing one or more falls with major injury 2.4%
6% worse than Maryland average

Maryland average: 2.3%

High Risk Residents with Pressure Ulcers Info Percent of long-stay high risk residents with pressure ulcers 6.3%
In line with Maryland average

Maryland average: 6.5%

Urinary Tract Infection Info Percent of long-stay residents with a urinary tract infection 1.9%
16% worse than Maryland average

Maryland average: 1.6%

Lost Too Much Weight Info Percent of long-stay residents who lose too much weight 4.7%
18% better than Maryland average

Maryland average: 5.8%

Depressive Symptoms Info Percent of long-stay residents who have depressive symptoms 23.4%
16% worse than Maryland average

Maryland average: 20.2%

Antipsychotic Use Info Percent of long-stay residents who received an antipsychotic medication 14.9%
15% worse than Maryland average

Maryland average: 12.9%

Pneumococcal Vaccine Info Percent of long-stay residents assessed and appropriately given the pneumococcal vaccine 58.2%
37% worse than Maryland average

Maryland average: 92.0%

Influenza Vaccine Info Percent of long-stay residents assessed and appropriately given the seasonal influenza vaccine 92.3%
In line with Maryland average

Maryland average: 96.6%

Hospitalizations per 1,000 days Info Number of hospitalizations per 1,000 long-stay resident days. 0.28
79% better than Maryland average

Maryland average: 1.32

ED visits per 1,000 days Info Number of outpatient emergency department visits per 1,000 long-stay resident days. 0.68
44% better than Maryland average

Maryland average: 1.21

Short-stay resident measures
Significantly above average Maryland avg: 3.7 Info CMS star rating based on short-stay quality measure performance. 5 stars = much above average, 1 star = much below average.
Pneumococcal Vaccine Info Percent of short-stay residents assessed and appropriately given the pneumococcal vaccine 35.4%
55% worse than Maryland average

Maryland average: 78.4%

Antipsychotic medication increase Info Percent of short-stay residents who newly received an antipsychotic medication 1.5%
8% worse than Maryland average

Maryland average: 1.4%

Influenza Vaccine Info Percent of short-stay residents assessed and appropriately given the seasonal influenza vaccine 72.1%
11% worse than Maryland average

Maryland average: 80.6%

Re-hospitalized after SNF stay Info Percentage of short-stay residents who were re-hospitalized after their nursing home admission. 12.6%
41% better than Maryland average

Maryland average: 21.2%

Emergency department visits Info Percentage of short-stay residents who had an outpatient emergency department visit. 7.3%
26% better than Maryland average

Maryland average: 9.9%

Falls with major injury Info Percentage of SNF residents who experience falls with major injury during their stay. 0.6%
18% better than Maryland average

Maryland average: 0.8%

Ability to care for self at discharge Info Percentage of residents at or above expected ability to care for themselves at discharge. 45.2%
16% worse than Maryland average

Maryland average: 53.7%

Successful return to home or community Info Rate of successful return to home or community from a skilled nursing facility. 57.8%
14% better than Maryland average

Maryland average: 50.6%

Penalties and fines

Federal penalties imposed by CMS for regulatory violations, including civil money penalties (fines) and denials of payment for new Medicare/Medicaid admissions.

Source: CMS Penalties Database

No penalties in the past 3 years

No civil money penalties or payment denials were reported in the last 3 years.

Compare Nursing Home around Cambridge

The information below is reported by the Maryland Department of Health, Office of Health Care Quality.

2 facilities compared · CMS & MD Dept. of Health data · Updated May 2026

Filter by care type
Mallard Bay Nursing and Rehab
NH

Nursing Home Licensed facility providing 24/7 skilled nursing care for residents with complex, ongoing medical needs. Staffed by RNs, LPNs, and CNAs. Inspected and star-rated annually by CMS. Accepts Medicare (short-term rehab) and Medicaid (long-term care).

HC

Home Care Professional care delivered in the person's own home — from companionship and errands to skilled nursing and therapy. Allows seniors to age in place. Medicare covers skilled home health when medically necessary.

RC

Respite Care Short-term temporary care — days to weeks — to give family caregivers a break. Full care provided during the stay. Often used after hospitalization or to trial a facility before a permanent placement decision.

Cambridge160 61.3% -26%2.84 +1%-25%0559.2-110A 33 Cambridge MD Opco LLC$18.8M$6.0M31.9%215191
Pines Nursing and Rehab
NH

Nursing Home Licensed facility providing 24/7 skilled nursing care for residents with complex, ongoing medical needs. Staffed by RNs, LPNs, and CNAs. Inspected and star-rated annually by CMS. Accepts Medicare (short-term rehab) and Medicaid (long-term care).

Easton (South Pennsfield)170 50.7% -38%3.07 -32%-19%116842.04120A+ 32 Md4 Holdco, LLC$10.5M$4.1M38.8%215010

Guides for Better Senior Living

Care Cost Calculator: See Prices in Your Area

Nursing Home Data Explorer

Don’t Wait Too Long: 7 Red Flag Signs Your Parent Needs Assisted Living Now

The True Cost of Assisted Living in 2025 – And How Families Are Paying For It

Understanding Senior Living Costs: Pricing Models, Discounts & Financial Assistance

Frequently Asked Questions about Mallard Bay Nursing and Rehab

Is Mallard Bay Nursing and Rehab in a walkable area?

Mallard Bay Nursing and Rehab has a walk score of 33. Somewhat walkable. A few nearby services may be reachable on foot, but most trips require transportation.

What is the occupancy rate at Mallard Bay Nursing and Rehab?

Mallard Bay Nursing and Rehab's occupancy is 61.3%.

Are there photos of Mallard Bay Nursing and Rehab?

Yes — there are 6 photos of Mallard Bay Nursing and Rehab in the photo gallery on this page.

What is the phone number of Mallard Bay Nursing and Rehab?

(410) 228-9191 will put you in contact with the team at Mallard Bay Nursing and Rehab.

Is Mallard Bay Nursing and Rehab Medicare or Medicaid certified?

Yes — Mallard Bay Nursing and Rehab is a CMS-certified provider of Medicare and Medicaid.

Explore Open Rooms
1 Contact details
2 What type of senior care service are you looking for?
3 What budget do you have in mind for senior care?
4 How soon do you need to find care?
5 Additional details

Thank you for your interest!

Our team will be in touch shortly to help with next steps.