Explore Open Rooms

1 Contact details
2 What type of senior care service are you looking for?
3 What budget do you have in mind for senior care?
4 How soon do you need to find care?
5 Additional details

Thank you for your interest!

Our team will be in touch shortly to help with next steps.

Nursing Home

Massapequa Center Rehabilitation & Nursing

Nursing Home

Massapequa Center Rehabilitation & Nursing

101 Louden Ave, Amityville, NY 11701 View map
Overview of Massapequa Center Rehabilitation & Nursing

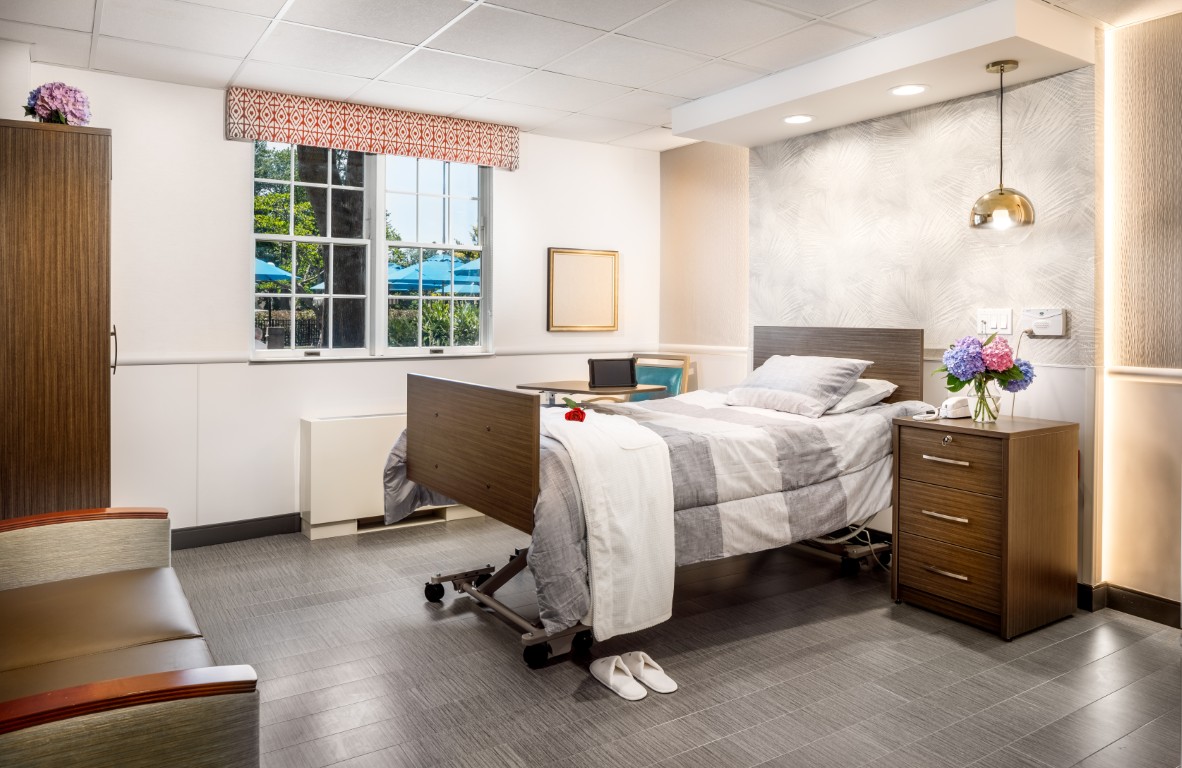
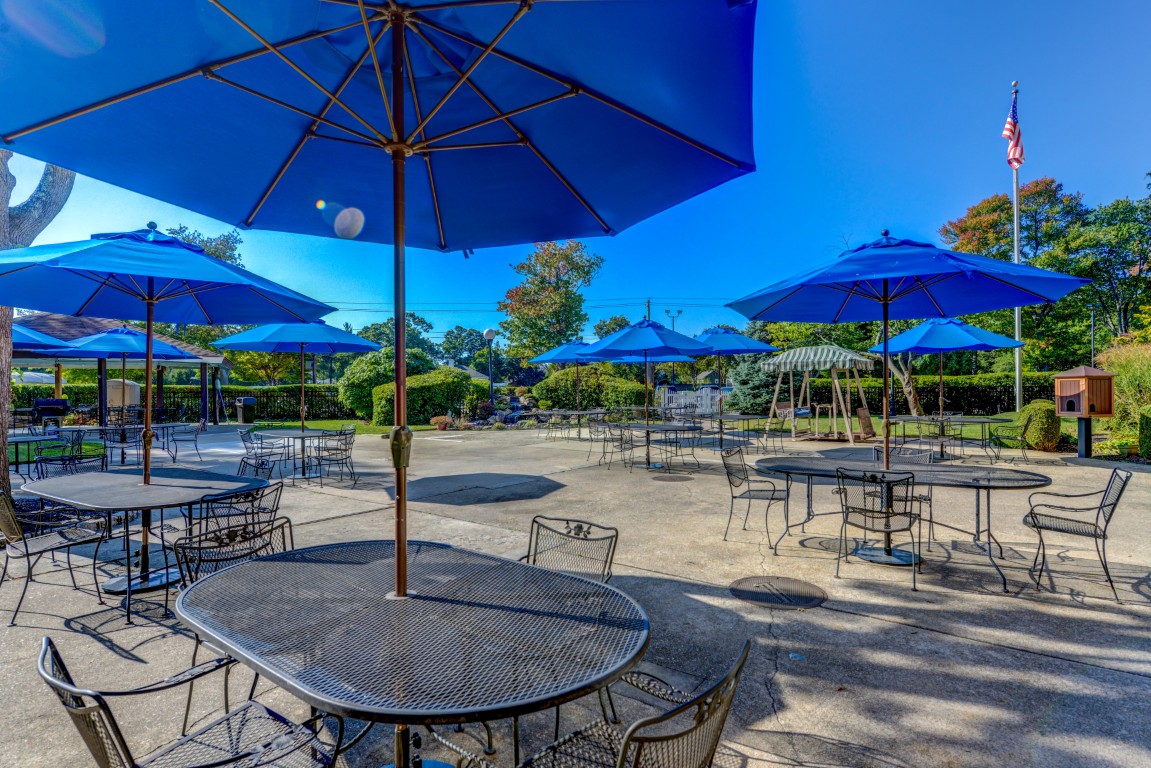
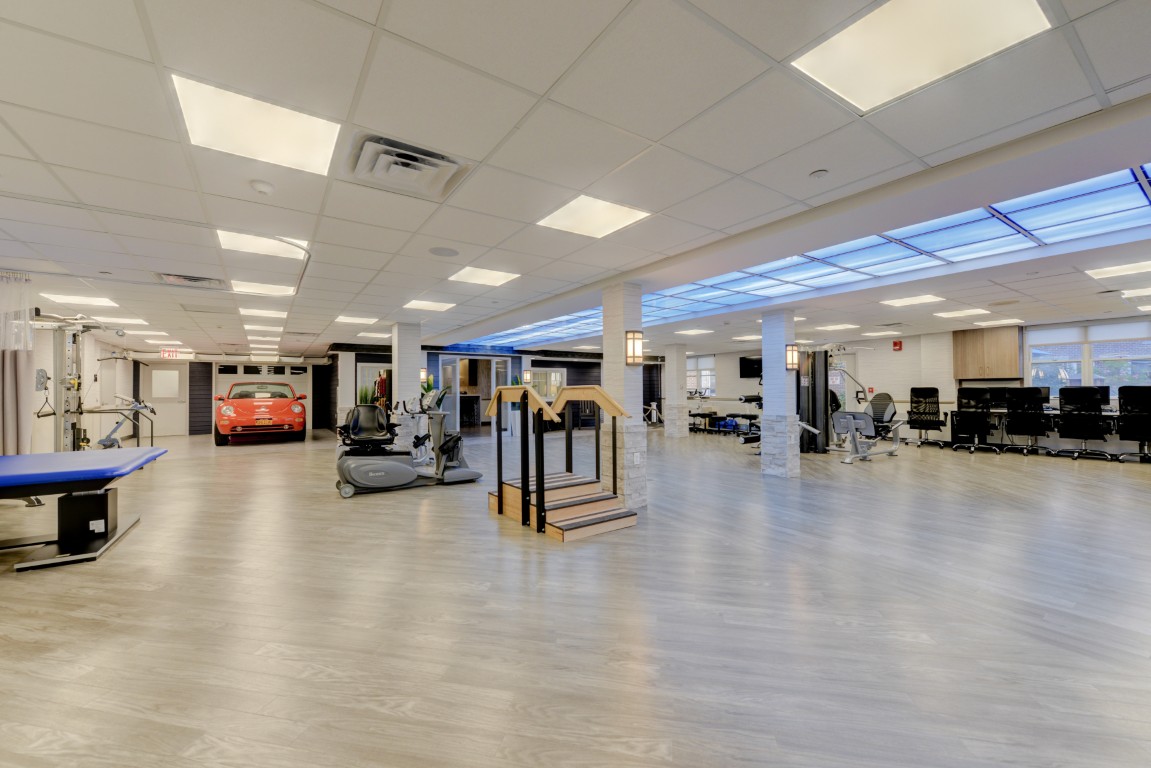
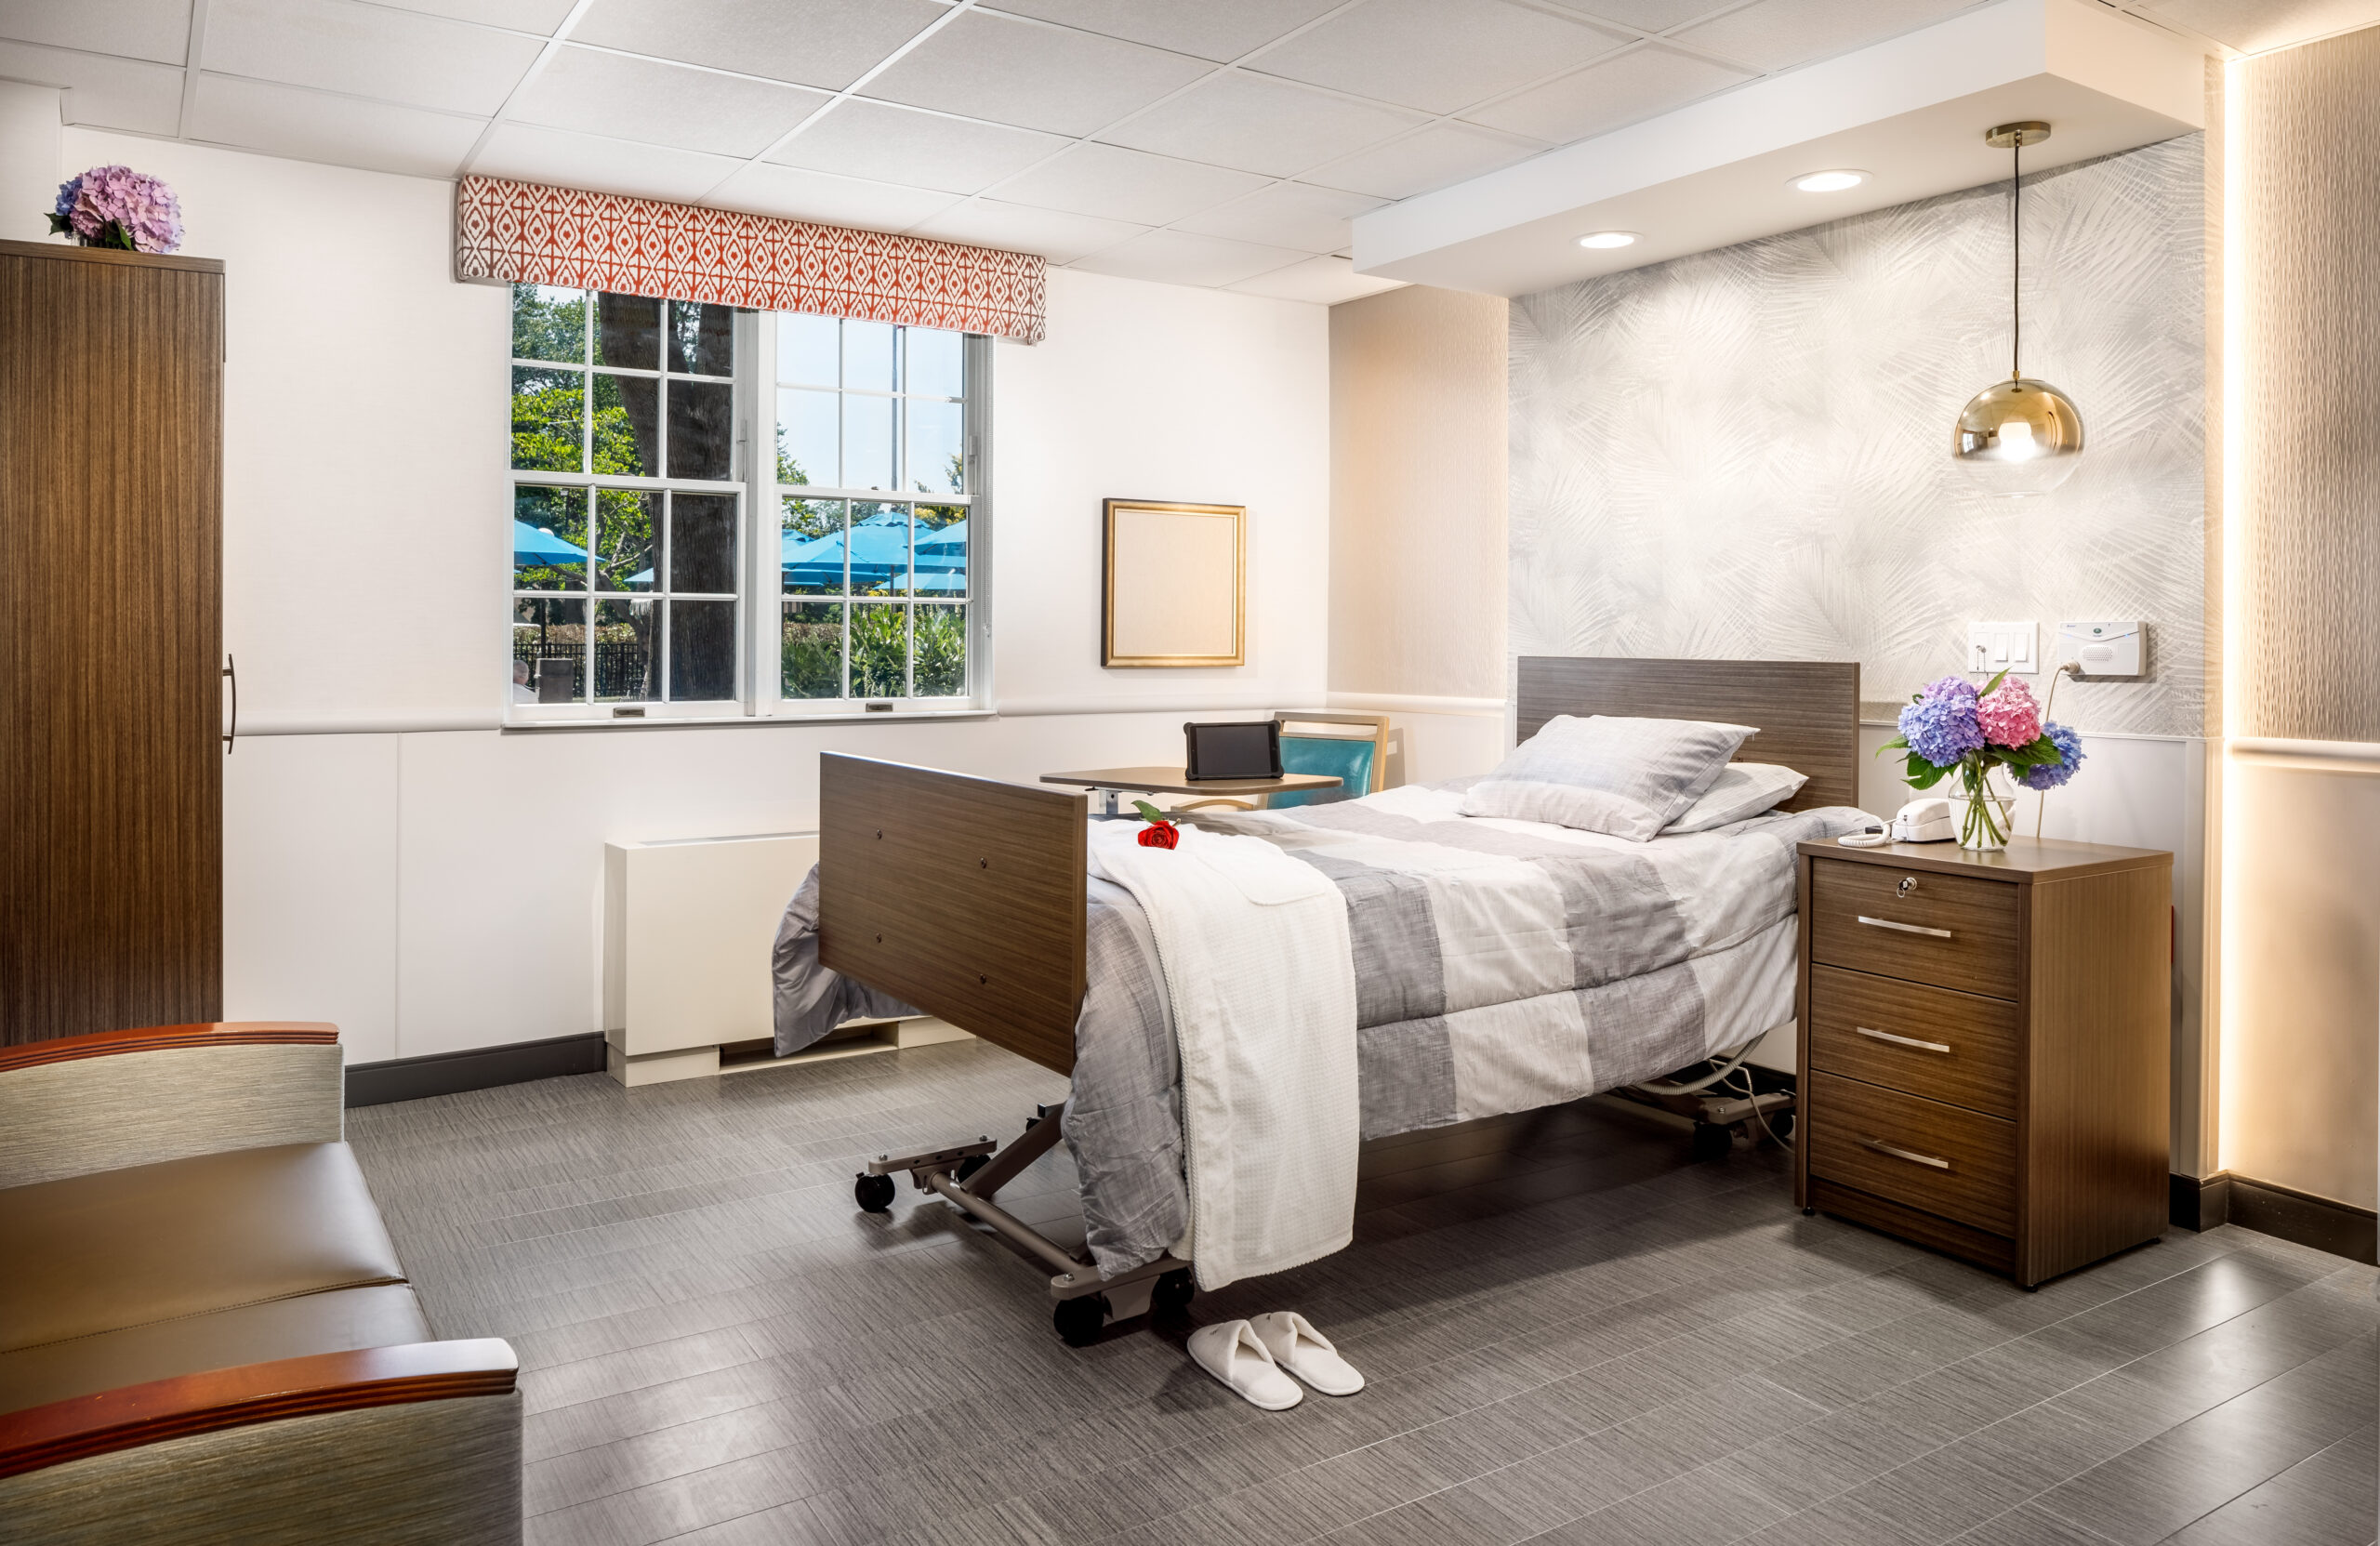
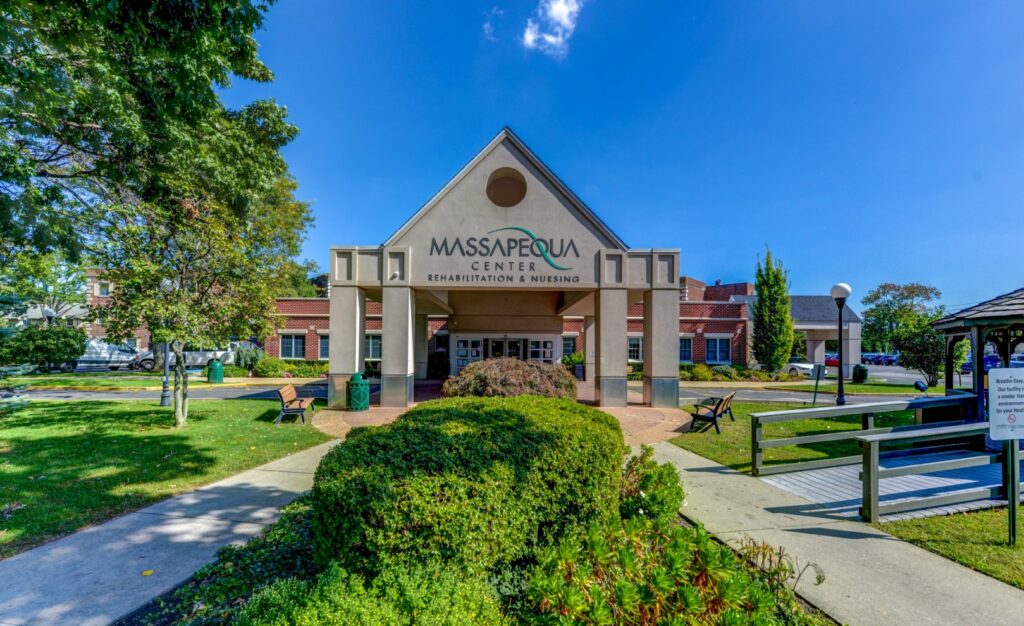
Massapequa Center Rehabilitation & Nursing is a dedicated nursing home in Amityville, NY, that offers rehabilitation and skilled nursing. Featuring 40 short-term private rooms in a clean and welcoming setting, the community ensures residents are comfortable and safe. State-of-the-art therapy equipment, healthy cuisine, and in-house physicians are among the community’s top offerings dedicated for residents’ well-being.

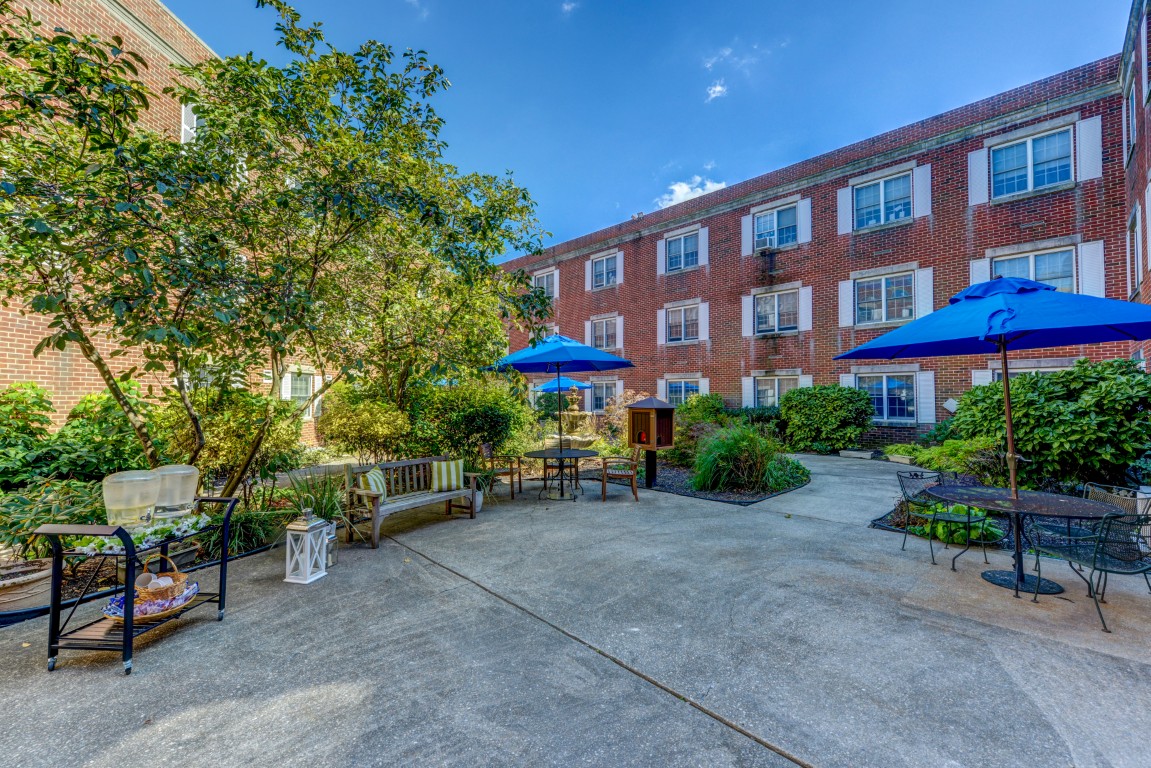
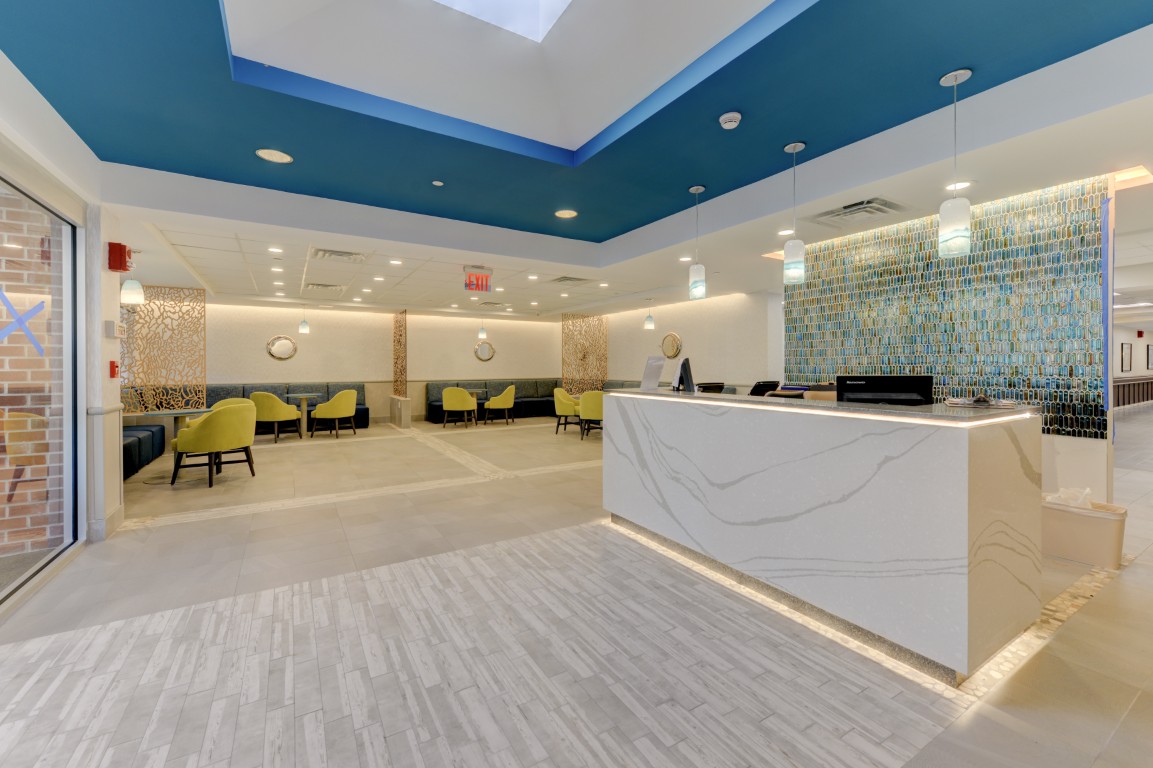
Concierge services are also provided, so residents have a hassle-free living. With over four acres of beautifully maintained gardens and gym, residents have options on how to spend their free time. This nursing home is a good choice for those looking for comprehensive care to meet their complex healthcare needs.

Quality ratings

Measured by Centers for Medicare & Medicaid Services (CMS)

Overall rating Info The Overall CMS Rating combines results from health inspections, staffing levels and quality measures. Health inspections carry the most weight. Staffing and quality scores can increase or decrease the final rating based on performance compared to state and national standards.
5/5
New York average: 3.2/5
Health Inspection Info Based on the results of the facility's three most recent standard inspections and any complaint investigations. CMS reviews the number, scope, and severity of deficiencies, with more recent findings weighted more heavily.
4/5
New York average: 2.9/5
Staffing Info Measures average nursing staff hours per resident per day, including Registered Nurses (RNs) and total nursing staff. Ratings are adjusted based on the level of care residents require and are compared to state and national benchmarks.
2/5
New York average: 2.7/5
Quality Measures Info Based on clinical and physical health indicators reported to CMS, such as hospital readmissions, falls, pressure ulcers, and improvements in mobility. These measures reflect how well residents' health needs are being managed.
5/5
New York average: 4.0/5

Nursing care per resident

Info This shows how many total hours of nursing staff time are available per resident each day. Higher numbers usually mean more staff support.
3h 0m per day

This home provides 14% less nursing time per resident than the New York average.

New York average: 3h 29m per day

Staffing hours breakdown

Info Hours of care per resident per day, broken down by staff type. Data from CMS Medicare.
Staff type Facility State avg National avg
Registered Nurse (RN) Info Registered nurse hours per resident per day. 30m per day 42m per day 41m per day
Nurse Aide Info Nurse aide hours per resident per day. 2h 26m per day 2h 11m per day 2h 21m per day
Total Nursing (Weekend) Info Total number of nurse staff hours per resident per day on weekends. 3h 26m per day 3h 10m per day 3h 26m per day
Physical Therapist Info Physical therapist staff hours per resident per day. 4m per day 7m per day 4m per day
RN (Weekend) Info Registered nurse hours per resident per day on weekends. 16m per day 28m per day 29m per day

Capacity and availability

High-capacity home

May provide extensive amenities, services and programs.

Total beds 320

This home usually has limited availability

Occupancy is moderate, suggesting balanced demand.

Similar demand to the New York average
Occupancy rate 90.8%
Residents per day (avg) 295
Occupancy rate
90.8%
Residents per day (avg)
295

Who this home usually serves

TYPE OF STAY

Mostly short-term rehab stays

Most residents typically stay for a few weeks or months before returning home or moving on.

Might be optimal for
Short stays Recovery Medicare-covered care

Breakdown by payment type

Medicare

56% of new residents, usually for short-term rehab.

Typical stay 1 - 2 months

Private pay

40% of new residents, often for short stays.

Typical stay 1 - 2 months

Medicaid

4% of new residents, often for long-term daily care.

Typical stay 4 - 5 years

Finances and operations

Privately-owned community
Operated by a business corporation.
Home revenue
$73.4M
Profit
$658.6K
Privately-owned community Operated by a business corporation.
Home revenue
$73,362,946.00
Profit
$658,577.00
Payroll costs Info The portion of the home's budget spent on staff, including nurses, caregivers, and other employees who support care and operations.
$18.7M
25.4% of revenue
Other operating costs Info All remaining costs needed to run the home, such as food, utilities, building maintenance, supplies and administrative expenses.
$54.0M
Total costs $72.7M
Bed community size
320-bed community
A large-scale community that may provide a wide range of amenities, services, and structured programs.
Walk Score
Walk Score: 62 / 100
Moderately walkable. Some errands can be accomplished on foot, with a mix of nearby amenities.

About this community

License details

Facility type
Nursing Home
County: Suffolk

Additional licensing details

Awards: 5 STAR FACILITY

Ownership & operating entity

Massapequa Center Rehabilitation & Nursing is legally operated by Massapequa Center, LLC (For Profit).

Care Services

Doctor on Staff
Nursing Services
Rehabilitation Services
Memory Care
Skilled Nursing
Licensed Nurses/CNAs
Short-Term Rehab

Amenities & Lifestyle

Free Wi-Fi
Free cable television
Free phone service
Free laundry services
Concierge Services

Programs & Activities

Specific Programs
Short Term Rehab, Long Term Care, Adult Day Care, Dementia Care, Stroke Rehab Program

Dining & Nutrition

Food Description
Beautiful dining area with delicious, healthy cuisine.

What does this home offer?

Housing options icon

Housing Options: Private Rooms

Building type icon
Building type icon

Building Type: Single-story

Dining services icon

Dining Services

Beauty services icon

Beauty Services

Transportation services icon

Transportation Services

Housekeeping icon
Housekeeping icon

Housekeeping Services

Social and recreational activities icon

Social and Recreational Activities

Exercise program icon

Exercise Programs

On-site medical care and health services icon

On-site Medical Care and Health Services

Types of Care at Massapequa Center Rehabilitation & Nursing

Nursing Home

Inspection History

In New York, the Department of Health, Office of Aging and Long Term Care performs unannounced onsite inspections to monitor compliance with state and federal healthcare regulations.

8 inspections

4 with citations, 4 without citations

19 on-site complaint investigations

New York average: 9 inspections (5 with citations), 15 on-site complaint investigations

51 complaints

18 complaints per 100 occupied beds

New York average: 49.9 complaints per 100 occupied beds

Formal expressions of dissatisfaction or concern made by residents, or their families regarding various aspects of the care, services, and environment provided.

New York average: 93 complaints

Latest inspection

Date:December 11, 2024
Type:Complaint Investigation

28 total citations

22 health citations 6 life safety citations

Citations indicate regulatory violations. A higher number implies the facility had several areas requiring improvement.

New York average: 29 citations

New York average: 20 health citations

New York average: 4 life safety citations

23 deficiencies

Deficiencies indicate regulatory issues. A higher number implies the facility had several areas requiring improvement.

3 enforcement actions

Penalties or interventions imposed by state regulators when facilities do not comply with quality, safety or regulatory standards.

August 14, 2020: Stipulation & Order #NH-20-041

Multiple Deficiencies

March 1, 2018: Stipulation & Order #NH-19-027

Multiple Deficiencies

October 12, 2015: Stipulation & Order #NH-16-185

Quality of Care

Health Inspection History

Inspections
Total health inspections 2

New York average 3.6


Last Health inspection on Dec 2024

Total health citations 11

New York average 18.5

Citations per inspection
5.5

New York average 5.05


Health citations are formal notices following inspections when they fail to comply with safety and care standards.

All 11 citations resulted from standard inspections.

Breakdown of citation severity (last 3 years)
Critical Health citations More info 0
100% better than New York average

New York average: 0.2


Serious Health citations More info 0
100% better than New York average

New York average: 0.2

0 critical citations More info New York average: 0.2

0 serious citations More info New York average: 0.2

11 moderate citations More info New York average: 17.4

0 minor citations More info New York average: 0.7
Citations history (last 3 years)
Infection Control moderate citation Info Issues related to preventing and controlling infections, including hygiene practices and safety protocols. Dec 11, 2024
Corrected

Pharmacy moderate citation Info Issues related to medication management, including how drugs are stored, administered, and monitored. Dec 11, 2024
Corrected

Quality of Care moderate citation Info Issues related to how well residents receive appropriate treatment and support for their medical and daily care needs. Dec 11, 2024
Corrected

Quality of Care moderate citation Info Issues related to how well residents receive appropriate treatment and support for their medical and daily care needs. Dec 11, 2024
Corrected

Compare Nursing Homes around Suffolk County The information below is reported by the New York State Department of Health.

1 facility compared · CMS & NY Dept. of Health data · Updated Mar 2026

Massapequa Center Rehabilitation & Nursing
NH

Nursing Home Licensed facility providing 24/7 skilled nursing care for residents with complex, ongoing medical needs. Staffed by RNs, LPNs, and CNAs. Inspected and star-rated annually by CMS. Accepts Medicare (short-term rehab) and Medicaid (long-term care).

Amityville
320
90.8%
+3%
3.01
-17%
-16%
0
11
0
295
62
Bleier, Aharon
$73,3M
$18,7M
25.5%
335213
Private Rooms

Places of interest near Massapequa Center Rehabilitation & Nursing

Address 0.7 miles from city center

Address 101 Louden Ave, Amityville, NY 11701

Calculate Travel Distance to Massapequa Center Rehabilitation & Nursing

Add your location

Address

Staffing Data (Q2 2025)

This data corresponds to Q2 2025 and is based on CMS Payroll-Based Journal.

Total staff 388
Employees 332
Contractors 56
Staff to resident ratio 1.36:1
674% better than New York average

New York average ratio: 0.18:1

Avg staff/day 187
Average shift 7.3 hours
5% worse than New York average

New York average: 7.7 hours

Total staff hours (quarter) 123,783
Nursing staff breakdown
Registered Nurse

Manages medical care and health needs.

Total count 40
Average shift length Info Average shift length. Calculated as total hours divided by days worked and average staff per day. 7.4 hours

No contractors work on this role.

Licensed Practical Nurse

Assists with medical care and medications.

Total count 71
Average shift length Info Average shift length. Calculated as total hours divided by days worked and average staff per day. 7.5 hours

This role is partially covered by contractors.

Certified Nursing Assistant

Helps with daily care and mobility.

Total count 216
Average shift length Info Average shift length. Calculated as total hours divided by days worked and average staff per day. 7.2 hours

No contractors work on this role.

Contractor staffing

Total hours from contractors

15%

18,559 contractor hours this quarter

Licensed Practical Nurse: 17 Physical Therapy Assistant: 12 Speech Language Pathologist: 11 Respiratory Therapy Technician: 5 Physical Therapy Aide: 4 Qualified Social Worker: 3 Respiratory Therapist: 2 Medical Director: 1 Dietitian: 1
Staff by category
Certified Nursing Assistant216021666,61391100%7.2
Licensed Practical Nurse54177122,79991100%7.5
Registered Nurse4004012,95391100%7.4
Physical Therapy Assistant012124,0727684%7.4
Speech Language Pathologist011113,9037886%7.3
Dietitian111123,37191100%6.8
Respiratory Therapy Technician1562,57491100%7.4
Occupational Therapy Aide3031,3057684%7.2
Physical Therapy Aide0441,2646571%7.4
Dental Services Staff3031,2456369%7.2
Respiratory Therapist0229286571%7.5
Qualified Social Worker0338956571%7.4
Clinical Nurse Specialist2028836369%7.7
Nurse Practitioner1014275763%7.5
Administrator1014055459%7.5
Medical Director0111463943%3.8
216 Certified Nursing Assistant
% of Days 100%
71 Licensed Practical Nurse
% of Days 100%
40 Registered Nurse
% of Days 100%
12 Physical Therapy Assistant
% of Days 84%
11 Speech Language Pathologist
% of Days 86%
12 Dietitian
% of Days 100%
6 Respiratory Therapy Technician
% of Days 100%
3 Occupational Therapy Aide
% of Days 84%
4 Physical Therapy Aide
% of Days 71%
3 Dental Services Staff
% of Days 69%
2 Respiratory Therapist
% of Days 71%
3 Qualified Social Worker
% of Days 71%
2 Clinical Nurse Specialist
% of Days 69%
1 Nurse Practitioner
% of Days 63%
1 Administrator
% of Days 59%
1 Medical Director
% of Days 43%

Facility Characteristics

Source: CMS Long-Term Care Facility Characteristics (Data as of Jan 2026)

Total census
286 residents
Residents by payment source
Medicare
76 residents (26.6%)
Medicaid
168 residents (58.7%)
Private pay or other
42 residents (14.7%)
Programs & Services
Residents' Group

Residents meet regularly to discuss policies, care quality, and activities

Family Member Group

Family members meet regularly to discuss policies, care quality, and activities

Active Family Council

Organized group of family members that meets regularly to discuss facility policies, resident care, and activities.

Active Resident Council

Organized group of residents that meets regularly to discuss facility policies, quality of life, and activities.

Quality of care over time

These measures show how residents usually do over time at this home, based on health outcomes and preventive care.

High-risk clinical events score Info A composite score based on pressure ulcers, falls with injury, weight loss, walking ability decline, and activities of daily living decline. 4.6
54% better than New York average

New York average: 9.8

Functional decline score Info A composite score based on activities of daily living decline, walking ability decline, and incontinence. 9.2
49% better than New York average

New York average: 18.1

Long-stay resident measures
Significantly above average New York avg: 4.3 Info CMS star rating based on long-stay quality measure performance. 5 stars = significantly above average, 1 star = significantly below average.
Need for Help with Daily Activities Increased Info Percent of long-stay residents whose need for help with daily activities has increased 4.7%
72% better than New York average

New York average: 16.4%

Walking Ability Worsened Info Percent of long-stay residents whose ability to move independently worsened 6.4%
61% better than New York average

New York average: 16.6%

Low Risk Residents with Bowel/Bladder Incontinence Info Percent of low risk long-stay residents who lose control of their bowels or bladder 16.4%
23% better than New York average

New York average: 21.4%

Falls with Major Injury Info Percent of long-stay residents experiencing one or more falls with major injury 1.8%
41% better than New York average

New York average: 3.0%

High Risk Residents with Pressure Ulcers Info Percent of long-stay high risk residents with pressure ulcers 5.2%
27% better than New York average

New York average: 7.2%

Urinary Tract Infection Info Percent of long-stay residents with a urinary tract infection 0.6%
58% better than New York average

New York average: 1.4%

Lost Too Much Weight Info Percent of long-stay residents who lose too much weight 4.7%
23% better than New York average

New York average: 6.1%

Depressive Symptoms Info Percent of long-stay residents who have depressive symptoms 56.1%
210% worse than New York average

New York average: 18.1%

Antipsychotic Use Info Percent of long-stay residents who received an antipsychotic medication 10.6%
16% better than New York average

New York average: 12.6%

Pneumococcal Vaccine Info Percent of long-stay residents assessed and appropriately given the pneumococcal vaccine 99.9%
9% better than New York average

New York average: 91.4%

Influenza Vaccine Info Percent of long-stay residents assessed and appropriately given the seasonal influenza vaccine 100.0%
5% better than New York average

New York average: 95.2%

Hospitalizations per 1,000 days Info Number of hospitalizations per 1,000 long-stay resident days. 1.09
36% better than New York average

New York average: 1.71

ED visits per 1,000 days Info Number of outpatient emergency department visits per 1,000 long-stay resident days. 0.49
64% better than New York average

New York average: 1.35

Short-stay resident measures
Significantly above average New York avg: 3.7 Info CMS star rating based on short-stay quality measure performance. 5 stars = much above average, 1 star = much below average.
Pneumococcal Vaccine Info Percent of short-stay residents assessed and appropriately given the pneumococcal vaccine 95.5%
25% better than New York average

New York average: 76.6%

Antipsychotic medication increase Info Percent of short-stay residents who newly received an antipsychotic medication 1.4%
9% worse than New York average

New York average: 1.3%

Influenza Vaccine Info Percent of short-stay residents assessed and appropriately given the seasonal influenza vaccine 96.5%
22% better than New York average

New York average: 78.8%

Re-hospitalized after SNF stay Info Percentage of short-stay residents who were re-hospitalized after their nursing home admission. 17.4%
16% better than New York average

New York average: 20.6%

Emergency department visits Info Percentage of short-stay residents who had an outpatient emergency department visit. 5.3%
45% better than New York average

New York average: 9.7%

Falls with major injury Info Percentage of SNF residents who experience falls with major injury during their stay. 0.3%
57% better than New York average

New York average: 0.8%

Ability to care for self at discharge Info Percentage of residents at or above expected ability to care for themselves at discharge. 90.7%
69% better than New York average

New York average: 53.7%

Successful return to home or community Info Rate of successful return to home or community from a skilled nursing facility. 59.6%
18% better than New York average

New York average: 50.6%

Guides for Better Senior Living

Care Cost Calculator: See Prices in Your Area

Nursing Home Data Explorer

Don’t Wait Too Long: 7 Red Flag Signs Your Parent Needs Assisted Living Now

The True Cost of Assisted Living in 2025 – And How Families Are Paying For It

Understanding Senior Living Costs: Pricing Models, Discounts & Financial Assistance

Financial Aid for New York Seniors

Get financial aid guidance

Community First Choice Option

NY Medicaid CFCO

Age 65+ or disabled, New York resident, Medicaid- eligible, care need (not necessarily nursing home level).

~$2,829/month (300% FBR, individual).

$30,182 (individual, higher due to NY Medicaid expansion).

Higher asset limit; urban density increases demand.

Expanded In-Home Services for the Elderly Program (EISEP)

NY EISEP

Age 60+, New York resident, at risk of decline but not nursing home level.

~$2,500/month (individual, varies).

$15,000 (individual).

Cost-sharing required above certain income; urban/rural balance.

Senior Citizen Rent Increase Exemption (SCRIE)

NY SCRIE

Age 62+, NYC resident, live in rent-controlled/stabilized apartment, spend >1/3 of income on rent.

$50,000/year (household).

No strict asset cap, but income-focused eligibility.

Limited to NYC’s rent-regulated units; high demand in urban areas.

Senior Citizen Homeowners’ Exemption (SCHE)

NY SCHE

Age 65+, NYC resident, own and live in a 1-3 family home, co-op, or condo.

$58,399/year (household).

No strict asset cap, income-driven eligibility.

Applies only in NYC; excludes large apartment buildings.

New York Foundation for Senior Citizens (NYFSC) Home Sharing Program

NYFSC Home Sharing

One participant must be 60+ (host or guest), NYC resident, able to share living space.

No strict limit, but targets those needing cost relief.

Not applicable; focus on housing need.

Primarily NYC-focused; limited slots due to demand.