


Total health inspections
18
Illinois average 10.4
Last Health inspection on Sep 2025
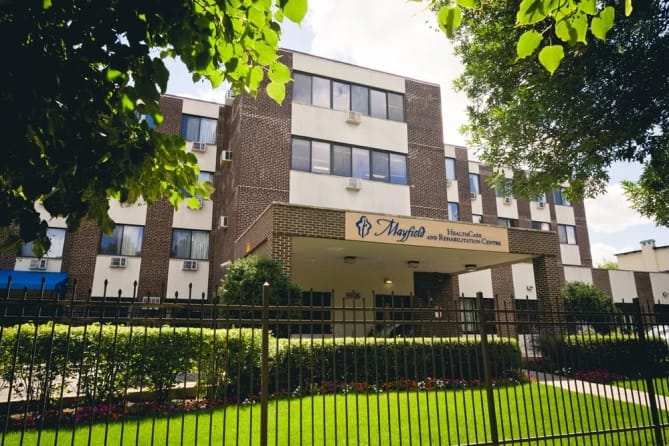

Mayfield Care Rehab Center, a 156-bed skilled nursing facility at 5905 W Washington Blvd in Chicago’s Austin neighborhood, operates in a very walkable urban setting (Walk Score 81) under private ownership. The facility has served residents for 42 years. President Moshe Wolf leads operations.
The census comprises primarily Medicaid residents (91.3% of current census, 79% of new admissions) with average stays of 237 days, reflecting a long-term care model. Medicare admits 14% of new residents; private pay accounts for 7%.
CMS ratings across the board are 1 star: overall, health inspection, staffing, and quality measures all fall 6–70% below Illinois averages. Nursing hours total 2h 34m per resident per day, 35% below the state benchmark, with RN presence at 13 minutes daily (70% below state) and weekend RN hours at 9 minutes (74% below). The facility employs 14 RNs, 73 LPNs, and 139 CNAs. Staffing deficiencies persist despite a payroll investment of 68.9% of revenue and 47% better staff-to-resident ratios than state average.
Regulatory inspection records since 2023 reveal systemic, unresolved safety failures. Eighty deficiencies (1043% above the state average) include 3 critical and 9 serious citations; the facility ranks 157th of 157 Illinois facilities. Federal penalties total $400,000 (worst in the state) with 6 payment denials imposed since August 2023.
September’s inspection documented an unstageable pressure ulcer (14cm x 18.5cm x 3.5cm depth) from failure to implement adequate care planning and repositioning, requiring hospitalization and surgery.
December 2024 investigations substantiated physical abuse: a resident tied to bed rails with a pillowcase without physician authorization or consent, and verbal abuse by CNAs.
March 2025 findings documented staff failure to notify a physician of a resident’s fall and change in condition, delaying hospital transfer; three staff were terminated for this gross misconduct.
Wound care failures have resulted in hospitalizations and Stage IV pressure ulcers. Medication errors, inadequate staffing, food safety violations, and delayed abuse reporting appear across multiple inspection cycles. Corrective actions have been taken, including staff terminations, but deficiencies persist.
Financial statements show an operating loss of $3.2 million (2023) with declining margins. Eighty-eight percent of long-stay residents experience depressive symptoms (83% worse than state average).
Mayfield Care’s combination of minimal staffing hours, pervasive regulatory violations, substantiated abuse incidents, inadequate clinical oversight, and financial distress presents substantial risk. Comprehensive independent assessment is essential before considering placement.
Staffing hours
![]() Daily nursing hours per resident by staff type, reported to CMS. Higher is generally better — compare this facility to state and national averages to see where staffing stands.
Daily nursing hours per resident by staff type, reported to CMS. Higher is generally better — compare this facility to state and national averages to see where staffing stands.
Hours per resident per day vs Illinois averages
Total nursing care
![]() This home is ranked 108th out of 154 homes in Illinois for nurse hours. Total adjusted nursing hours per resident per day, combining RN, LPN, and aide time. CMS adjusts this for case-mix so facilities can be fairly compared.
This home is ranked 108th out of 154 homes in Illinois for nurse hours. Total adjusted nursing hours per resident per day, combining RN, LPN, and aide time. CMS adjusts this for case-mix so facilities can be fairly compared.
2h 34m
17% below state avg5 of 6 metrics below state avg
In Illinois, the Department of Public Health, Office of Health Care Regulation conducts annual unannounced surveys to assess compliance with state and federal healthcare facility standards.
Deficiencies
| This Facility | IL Average | vs. IL Avg |
|---|---|---|---|
|
Total deficiencies
| 80 | 7 | This facility has 1043% more total deficiencies than a typical Illinois nursing home (80 vs. IL avg 7).↑ 1043% worse |
|
Deficiencies per inspection
| 4.2 | 0.8 | This facility has 425% more deficiencies per inspection than a typical Illinois nursing home (4.2 vs. IL avg 0.8).↑ 425% worse |
Inspections
| This Facility | IL Average | vs. IL Avg |
|---|---|---|---|
|
Total inspections
| 19 | 9 | This facility has had 111% more total inspections than the Illinois average (19 vs. IL avg 9). More inspections can mean more regulatory scrutiny rather than worse care.↑ 111% more |
Illinois average 10.4
Last Health inspection on Sep 2025
Illinois average 36.8
Illinois average 3.68
Health citations are formal notices following inspections when they fail to comply with safety and care standards.
49 of 80 citations resulted from standard inspections; 30 of 80 resulted from complaint investigations; and 1 of 80 came from combined inspections (standard and complaint).
Illinois average: 0.7
Illinois average: 3.6
Reporting period: October 1 – December 31, 2025 (Q4 2025). Source: CMS Payroll-Based Journal report.
Manages medical care and health needs.
Assists with medical care and medications.
Helps with daily care and mobility.
Total hours from contractors
2,996 contractor hours this quarter
| Certified Nursing Assistant | 76 | 63 | 139 | 20,089 | 92 | 100% | 7.3 |
| Licensed Practical Nurse | 35 | 38 | 73 | 8,594 | 92 | 100% | 8.1 |
| Registered Nurse | 10 | 4 | 14 | 2,503 | 92 | 100% | 7.9 |
| RN Director of Nursing | 10 | 0 | 10 | 2,147 | 83 | 90% | 8.1 |
| Dental Services Staff | 4 | 0 | 4 | 1,660 | 88 | 96% | 8.7 |
| Other Dietary Services Staff | 4 | 0 | 4 | 1,247 | 87 | 95% | 7.5 |
| Clinical Nurse Specialist | 5 | 0 | 5 | 1,140 | 70 | 76% | 7.8 |
| Physical Therapy Aide | 0 | 1 | 1 | 488 | 61 | 66% | 8 |
| Administrator | 2 | 0 | 2 | 456 | 57 | 62% | 8 |
| Occupational Therapy Aide | 9 | 0 | 9 | 370 | 11 | 12% | 7.6 |
| Speech Language Pathologist | 0 | 1 | 1 | 268 | 41 | 45% | 6.5 |
| Respiratory Therapy Technician | 0 | 2 | 2 | 250 | 48 | 52% | 5.2 |
| Dietitian | 4 | 0 | 4 | 240 | 11 | 12% | 7.5 |
| Physical Therapy Assistant | 0 | 3 | 3 | 195 | 42 | 46% | 4.5 |
| Nurse Practitioner | 1 | 0 | 1 | 171 | 20 | 22% | 8.6 |
| Qualified Social Worker | 0 | 1 | 1 | 86 | 37 | 40% | 2.3 |
| Mental Health Service Worker | 1 | 0 | 1 | 35 | 4 | 4% | 8.8 |
Includes penalties issued in 2023-2025
Federal penalties imposed by CMS for regulatory violations, including civil money penalties (fines) and denials of payment for new Medicare/Medicaid admissions.
Source: CMS Penalties Database (Data as of Jan 2026)
Illinois average: $143K
Illinois average: 3.0
Illinois average: 1.1
Penalties are imposed by CMS for violations of federal nursing home regulations.
10 penalties in the past 3 years
Multiple penalties were reported in the last 3 years.
Last updated: Jan 2026
These measures show how residents usually do over time at this home, based on health outcomes and preventive care.
Illinois average: 9.7
Illinois average: 18.6
Illinois average: 15.5%
Illinois average: 18.4%
Illinois average: 21.6%
Illinois average: 3.4%
Illinois average: 5.3%
Illinois average: 1.8%
Illinois average: 6.5%
Illinois average: 48.1%
Illinois average: 20.2%
Illinois average: 89.2%
Illinois average: 91.6%
Illinois average: 2.05
Illinois average: 2.25
Illinois average: 68.3%
Illinois average: 2.3%
Illinois average: 63.0%
Illinois average: 26.2%
Illinois average: 14.0%
Illinois average: 0.8%
Illinois average: 53.7%
Illinois average: 50.6%
Quality measures are calculated from Minimum Data Set (MDS) assessments. For most measures, lower percentages indicate better care quality.
14% of new residents, usually for short-term rehab.
7% of new residents, often for short stays.
79% of new residents, often for long-term daily care.
Source: CMS Long-Term Care Facility Characteristics (Data as of Jan 2026)
Residents meet regularly to discuss policies, care quality, and activities
Organized group of residents that meets regularly to discuss facility policies, quality of life, and activities.
Data sourced from CMS Long-Term Care Facility Characteristics quarterly report. Payer mix reflects the current resident census by primary payment source.
Historical financial and operational data for Mayfield Care Rehab Center from 2011–2023, based on CMS SNF Cost Reports.
Key figures below are for fiscal year ending in 12/2023.
Based on CMS SNF Cost Report for fiscal year ending in 12/2023.
Most residents stay for extended periods and receive ongoing daily care.
Most new residents arrive under Medicaid (79% of admissions), and a typical Medicaid stay runs around 9 - 10 months.
Coverage residents most often arrive under.
Coverage residents most often leave under.
![]() 7.2 miles from city center
7.2 miles from city center
![]() Estimated distance in miles from Chicago's city center to Mayfield Care Rehab Center's address, calculated via Google Maps.
Estimated distance in miles from Chicago's city center to Mayfield Care Rehab Center's address, calculated via Google Maps.
Add your location
Info below is compiled from CMS reports & the IL Dept. of Public Health (IDPH), senior community websites & trusted data sources such as Walk Score & BBB.
Communities are listed from highest to lowest based on our ranking methodology.
| Mercy Circle Senior Living | NH AL IL MC SNF | Chicago (Mount Greenwood) | 43
Facility
43
IL AVG
85
Rank
#329 / 418 | - | - | 4.57
Facility
4.57
IL AVG
3.10
Rank
#24 / 154 | -8% | +47% | $0
Facility
$0
IL AVG
$151.3k
Rank
#1 / 154 | 16
Facility
16
IL AVG
36.8
Rank
#23 / 154 | 4.0
Facility
4.0
IL AVG
3.7
Rank
#104 / 154 | - | 22 | - |
44
Facility
44
IL AVG
52
Rank
#392 / 634 | Sisters Of Mercy Of The Americas West Midwest Community Inc | $10.3MFiscal year ending 06/2024
Facility
$10.3MFiscal year ending 06/2024
IL AVG
$13.2M
Rank
#84 / 135 | $5.1MFiscal year ending 06/2024
Facility
$5.1MFiscal year ending 06/2024
IL AVG
$7.4M
Rank
#99 / 135 | 49.8%Fiscal year ending 06/2024
Facility
49.8%Fiscal year ending 06/2024
IL AVG
60.5%
Rank
#76 / 135 | 146174 | ||||
| The Selfhelp Home Senior Living Community | NH AL IL RC SNF | Chicago (Uptown) | 72
Facility
72
IL AVG
85
Rank
#204 / 418 |
81.9%
Facility
81.9%
IL AVG
73
Rank
#63 / 156 | +12% | 5.56
Facility
5.56
IL AVG
3.10
Rank
#8 / 154 | +44% | +79% | $0
Facility
$0
IL AVG
$151.3k
Rank
#1 / 154 | 21
Facility
21
IL AVG
36.8
Rank
#40 / 154 | 5.3
Facility
5.3
IL AVG
3.7
Rank
#137 / 154 | 1 | 59 | A+ |
92
Facility
92
IL AVG
52
Rank
#28 / 634 | Marvin Rubin | $9.3MFiscal year ending 09/2023
Facility
$9.3MFiscal year ending 09/2023
IL AVG
$13.2M
Rank
#96 / 135 | $7.0MFiscal year ending 09/2023
Facility
$7.0MFiscal year ending 09/2023
IL AVG
$7.4M
Rank
#64 / 135 | 75.3%Fiscal year ending 09/2023
Facility
75.3%Fiscal year ending 09/2023
IL AVG
60.5%
Rank
#16 / 135 | 146009 | ||||
| The Clare | NH AL IL MC SNF | Chicago (Rush & Division) | 49
Facility
49
IL AVG
85
Rank
#293 / 418 |
92.2%
Facility
92.2%
IL AVG
73
Rank
#23 / 156 | +26% | 3.69
Facility
3.69
IL AVG
3.10
Rank
#48 / 154 | +61% | +19% | $0
Facility
$0
IL AVG
$151.3k
Rank
#1 / 154 | 13
Facility
13
IL AVG
36.8
Rank
#18 / 154 | 2.6
Facility
2.6
IL AVG
3.7
Rank
#24 / 154 | 1 | 45 | A+ |
100
Facility
100
IL AVG
52
Rank
#1 / 634 | County Of Fulton | $4.4MFiscal year ending 11/2023
Facility
$4.4MFiscal year ending 11/2023
IL AVG
$13.2M
Rank
#131 / 135 | $3.6MFiscal year ending 11/2023
Facility
$3.6MFiscal year ending 11/2023
IL AVG
$7.4M
Rank
#124 / 135 | 81.8%Fiscal year ending 11/2023
Facility
81.8%Fiscal year ending 11/2023
IL AVG
60.5%
Rank
#13 / 135 | 146151 | ||||
| Asbury Gardens | NH HOS MC PC SNF | North Aurora (Airport Road) | 75
Facility
75
IL AVG
85
Rank
#193 / 418 |
76.5%
Facility
76.5%
IL AVG
73
Rank
#77 / 156 | +5% | 4.00
Facility
4.00
IL AVG
3.10
Rank
#41 / 154 | +6% | +29% | $6.4k
Facility
$6.4k
IL AVG
$151.3k
Rank
#65 / 154 | 21
Facility
21
IL AVG
36.8
Rank
#40 / 154 | 3.5
Facility
3.5
IL AVG
3.7
Rank
#71 / 154 | - | 57 | A+ |
38
Facility
38
IL AVG
52
Rank
#434 / 634 | Abraham Diamond | $6.7MFiscal year ending 12/2023
Facility
$6.7MFiscal year ending 12/2023
IL AVG
$13.2M
Rank
#120 / 135 | $3.8MFiscal year ending 12/2023
Facility
$3.8MFiscal year ending 12/2023
IL AVG
$7.4M
Rank
#121 / 135 | 56.5%Fiscal year ending 12/2023
Facility
56.5%Fiscal year ending 12/2023
IL AVG
60.5%
Rank
#51 / 135 | 146170 | ||||
| Mayfield Care Rehab Center | NH HOS PC RC SNF | Chicago (Austin) | 156
Facility
156
IL AVG
85
Rank
#43 / 418 |
66.7%
Facility
66.7%
IL AVG
73
Rank
#109 / 156 | -9% | 2.56
Facility
2.56
IL AVG
3.10
Rank
#108 / 154 | -64% | -17% | $348.4k
Facility
$348.4k
IL AVG
$151.3k
Rank
#152 / 154 | 80
Facility
80
IL AVG
36.8
Rank
#145 / 154 | 4.4
Facility
4.4
IL AVG
3.7
Rank
#119 / 154 | 12 | 104 | A+ |
81
Facility
81
IL AVG
52
Rank
#101 / 634 | - | $11.8MFiscal year ending 12/2023
Facility
$11.8MFiscal year ending 12/2023
IL AVG
$13.2M
Rank
#67 / 135 | $7.5MFiscal year ending 12/2023
Facility
$7.5MFiscal year ending 12/2023
IL AVG
$7.4M
Rank
#53 / 135 | 63.9%Fiscal year ending 12/2023
Facility
63.9%Fiscal year ending 12/2023
IL AVG
60.5%
Rank
#29 / 135 | 145885 |
Mayfield Care Rehab Center is located in Chicago, Illinois.
Here are the financial assistance programs available to residents in Illinois.
Mayfield Care Rehab Center is in the Austin neighborhood of Chicago.
Mayfield Care Rehab Center has a walk score of 81. Very walkable. Most errands can be accomplished on foot, and many essentials are within a short walk.
Mayfield Care Rehab Center's occupancy is 78.1%.
Mayfield Care Rehab Center has been operating for approximately 42 years, based on available licensing and registration records.
No, Mayfield Care Rehab Center has a no-pet policy.
Mayfield Care Rehab Center is registered as a for-profit in IL.
Mayfield Care Rehab Center has had 80 reported deficiencies since 2023 according to records from Illinois Department of Public Health (IDPH).
Care Cost Calculator: See Prices in Your Area
Nursing Home Data Explorer
Don’t Wait Too Long: 7 Red Flag Signs Your Parent Needs Assisted Living Now
The True Cost of Assisted Living in 2025 – And How Families Are Paying For It
Understanding Senior Living Costs: Pricing Models, Discounts & Financial Assistance


