


Total health inspections
3
New York average 3.6
Last Health inspection on Feb 2024
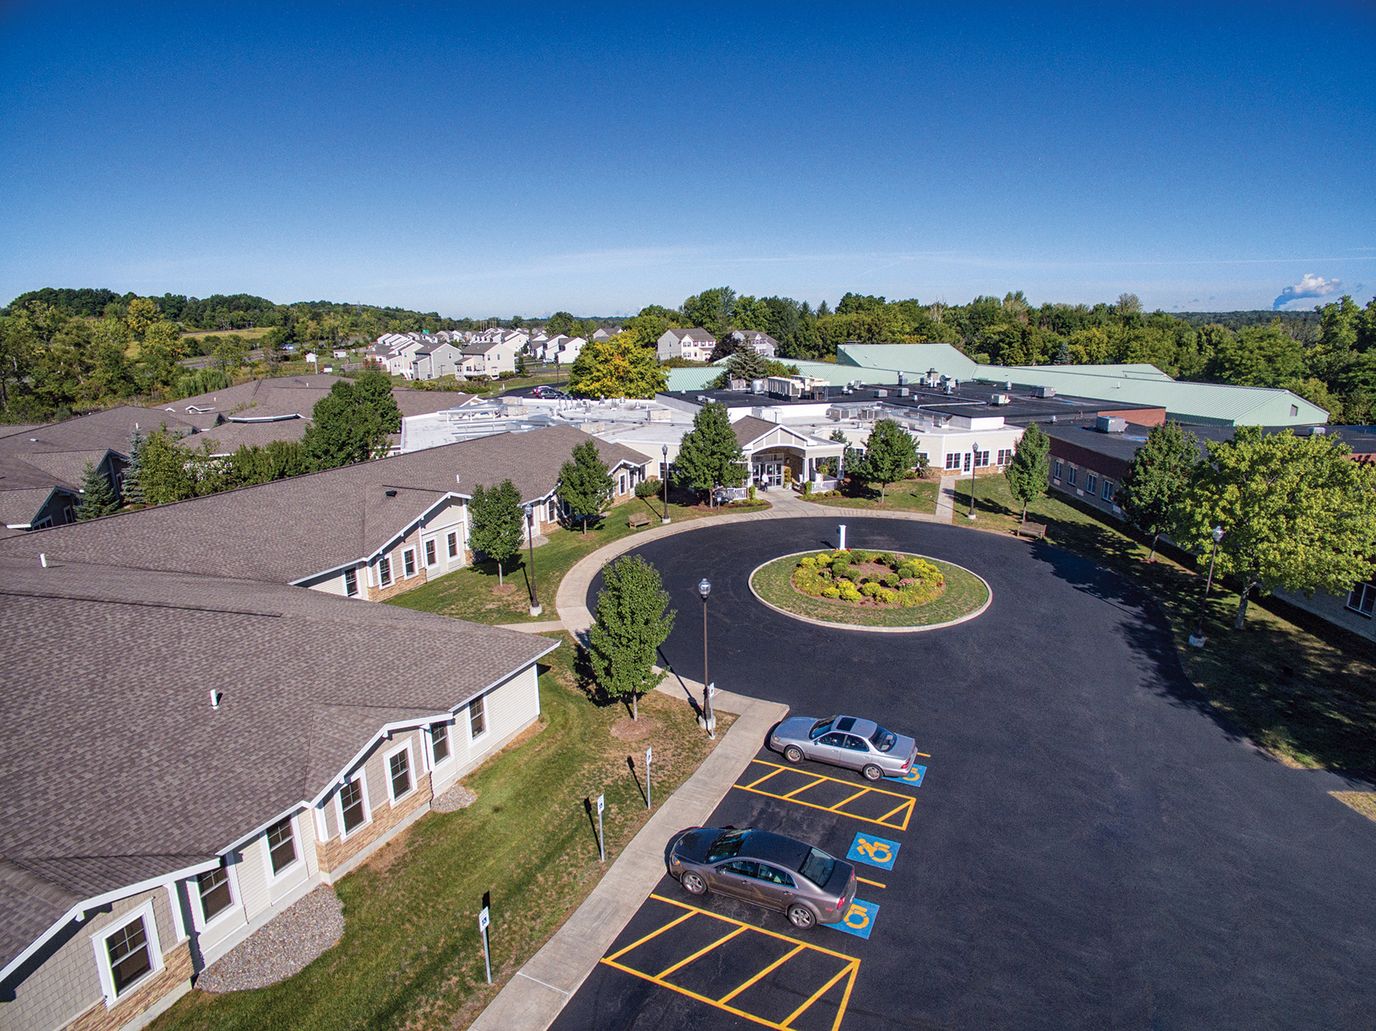
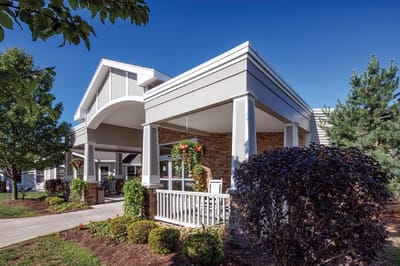

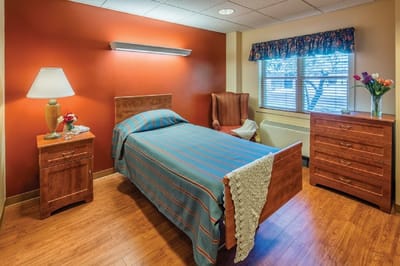
McHarrie Pointe is a 47-bed skilled nursing and rehabilitation community in Baldwinsville, New York, operated by McHarrie Life, Inc., a nonprofit organization serving seniors on a 140-acre campus in Onondaga County since 1851. The continuum spans independent living, assisted living, short-term rehabilitation, and skilled nursing care. Medicare and private pay are accepted.
The facility’s two inspections on record — August 2023 and February 2025 — each produced zero deficiencies. No complaint investigations or enforcement actions appear in the available reports, a clean compliance picture across both review cycles.
McHarrie Pointe carries a 3-star CMS overall rating, slightly below the New York average, though the sub-ratings tell a more differentiated story. The staffing rating is 48% above the state benchmark, with total nurse staffing averaging 4 hours and 36 minutes per resident per day, compared with New York’s average of 3 hours and 29 minutes — the facility ranks 31st out of 388 New York SNFs on this measure. Health Inspection performance runs modestly above the state average. The facility’s occupancy rate is 75.8%, well below the state’s 88.3%, suggesting current availability across the campus.
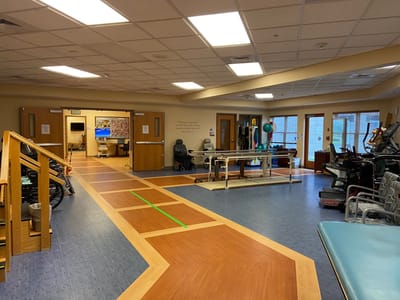
Services include short-term rehabilitation, memory care, respite care, and 24-hour licensed nursing support. The campus also provides access to the broader McHarrie Life continuum to residents, with an average length of stay of 120 days.
McHarrie Pointe is best suited for residents seeking short-term post-acute rehabilitation and is a staffing-intensive nonprofit campus in the Baldwinsville area, with a care continuum that accommodates those who may transition between levels of care over time.
| Staff type | Hours / Day / Resident | vs state avg |
|---|---|---|
|
Registered Nurse (RN)
| 42m per day | ■ Avg State avg: 42m per day · National avg: 41m per day |
|
LPN / LVN
| 1h 12m per day | ▲ 54% State avg: 47m per day · National avg: 52m per day |
|
Nurse Aide
| 2h 50m per day | ▲ 29% State avg: 2h 11m per day · National avg: 2h 20m per day |
|
Weekend Total Nursing
| 3h 56m per day | ▲ 22% State avg: 3h 14m per day · National avg: 3h 27m per day |
|
Physical Therapist
| 9m per day | ▲ 37% State avg: 7m per day · National avg: 4m per day |
|
Weekend RN
| 20m per day | ▼ 31% State avg: 29m per day · National avg: 29m per day |
In New York, the Department of Health, Office of Aging and Long Term Care performs unannounced onsite inspections to monitor compliance with state and federal healthcare regulations.
Inspection score unavailable
Not enough inspection history to generate a score.
Average score for New York assisted living residences: B 83/100
Inspections
| This Facility | NY Average | vs. NY Avg |
|---|---|---|---|
|
Total inspections
| 2 | 9 | This facility has had 78% fewer total inspections than the New York average (2 vs. NY avg 9). More inspections can mean more regulatory scrutiny rather than worse care.↓ 78% fewer |
|
Inspections with violations
| 2 | 4 | This facility has 50% fewer inspections with violations than a typical New York assisted living residence (2 vs. NY avg 4).↓ 50% better |
|
Inspection violation rate
| 100% | 44% | This facility has 56 percentage points higher inspection violation rate than a typical New York assisted living residence (100% vs. NY avg 44%).↑ 56% worse Rank #1 / 319 Inspection violation rate — State benchmarked This home is ranked 1st out of 319 homes in New York for % of inspections with violations. Shows this facility's % of inspections with violations compared to the New York average among 319 comparable communities in the ranking pool. Facilities with the same value for a metric share the same rank. Rankings are based only on facilities in New York that report data for that category. Facilities without available data are excluded from the ranking. |
|
Complaint visits
| 0 | 6 | This facility has 100% fewer complaint visits than a typical New York assisted living residence (0 vs. NY avg 6).↓ 100% better Rank #1 / 319 Complaint visits — State benchmarked This home is ranked 1st out of 319 homes in New York for complaint-related visits. Shows this facility's complaint-related visits compared to the New York average among 319 comparable communities in the ranking pool. Facilities with the same value for a metric share the same rank. Rankings are based only on facilities in New York that report data for that category. Facilities without available data are excluded from the ranking. |
Complaints & Investigations
| This Facility | NY Average | vs. NY Avg |
|---|---|---|---|
|
Total complaints
| 0 | 79 | This facility has 100% fewer total complaints than a typical New York assisted living residence (0 vs. NY avg 79).↓ 100% better |
|
Complaints per year
| 0 | 26.3 | This facility has 100% fewer complaints per year than a typical New York assisted living residence (0 vs. NY avg 26.3).↓ 100% better |
New York average 3.6
Last Health inspection on Feb 2024
New York average 18.5
New York average 5.05
Health citations are formal notices following inspections when they fail to comply with safety and care standards.
All 9 citations resulted from standard inspections.
New York average: 0.2
New York average: 0.2
Reporting period: October 1 – December 31, 2025 (Q4 2025). Source: CMS Payroll-Based Journal report.
Manages medical care and health needs.
Assists with medical care and medications.
Helps with daily care and mobility.
Total hours from contractors
2,999 contractor hours this quarter
| Certified Nursing Assistant | 67 | 11 | 78 | 25,677 | 92 | 100% | 7.2 |
| Licensed Practical Nurse | 28 | 10 | 38 | 11,229 | 92 | 100% | 7.5 |
| Registered Nurse | 11 | 0 | 11 | 4,014 | 92 | 100% | 7.3 |
| Other Dietary Services Staff | 11 | 0 | 11 | 2,916 | 92 | 100% | 6 |
| Clinical Nurse Specialist | 5 | 0 | 5 | 2,101 | 82 | 89% | 7.9 |
| Respiratory Therapy Technician | 8 | 0 | 8 | 1,438 | 79 | 86% | 7.1 |
| Physical Therapy Assistant | 7 | 0 | 7 | 1,379 | 72 | 78% | 6.4 |
| Speech Language Pathologist | 6 | 0 | 6 | 963 | 69 | 75% | 6.8 |
| Nurse Aide in Training | 6 | 0 | 6 | 915 | 71 | 77% | 6.9 |
| Qualified Social Worker | 5 | 0 | 5 | 904 | 69 | 75% | 7 |
| Physical Therapy Aide | 2 | 0 | 2 | 865 | 69 | 75% | 7.5 |
| Feeding Assistant | 2 | 0 | 2 | 534 | 63 | 68% | 7.1 |
| Administrator | 1 | 0 | 1 | 488 | 62 | 67% | 7.9 |
| Nurse Practitioner | 1 | 0 | 1 | 454 | 59 | 64% | 7.7 |
| Dental Services Staff | 1 | 0 | 1 | 435 | 55 | 60% | 7.9 |
| Occupational Therapy Aide | 1 | 0 | 1 | 333 | 51 | 55% | 6.5 |
| Occupational Therapy Assistant | 0 | 1 | 1 | 72 | 36 | 39% | 2 |
| Other Physician | 0 | 2 | 2 | 32 | 25 | 27% | 1.3 |
| Diagnostic X-ray Services Staff | 0 | 1 | 1 | 30 | 6 | 7% | 5 |
| Medical Director | 0 | 1 | 1 | 6 | 3 | 3% | 2 |
Federal penalties imposed by CMS for regulatory violations, including civil money penalties (fines) and denials of payment for new Medicare/Medicaid admissions.
Source: CMS Penalties Database
No penalties in the past 3 years
No civil money penalties or payment denials were reported in the last 3 years.
These measures show how residents usually do over time at this home, based on health outcomes and preventive care.
New York average: 9.8
New York average: 18.1
New York average: 16.4%
New York average: 16.6%
New York average: 21.4%
New York average: 3.0%
New York average: 7.2%
New York average: 1.4%
New York average: 6.1%
New York average: 18.1%
New York average: 12.6%
New York average: 91.4%
New York average: 95.2%
New York average: 76.6%
New York average: 1.3%
New York average: 78.8%
Quality measures are calculated from Minimum Data Set (MDS) assessments. For most measures, lower percentages indicate better care quality.
68% of new residents, usually for short-term rehab.
32% of new residents, often for short stays.
Source: CMS Long-Term Care Facility Characteristics (Data as of Jan 2026)
Residents meet regularly to discuss policies, care quality, and activities
Family members meet regularly to discuss policies, care quality, and activities
State-approved Nurse Aide Training and Competency Evaluation Program on-site
Organized group of family members that meets regularly to discuss facility policies, resident care, and activities.
Organized group of residents that meets regularly to discuss facility policies, quality of life, and activities.
Data sourced from CMS Long-Term Care Facility Characteristics quarterly report. Payer mix reflects the current resident census by primary payment source.
Historical financial and operational data for McHarrie Pointe from 2011–2023, based on CMS SNF Cost Reports.
Key figures below are for fiscal year ending in 12/2023.
Based on CMS SNF Cost Report for fiscal year ending in 12/2023.
Most residents typically stay for a few weeks or months before returning home or moving on.
Most new residents arrive under Medicare (68% of admissions), and a typical Medicare stay runs around 23 days.
Coverage residents most often arrive under.
Coverage residents most often leave under.
![]() 0.0 miles from city center
0.0 miles from city center
![]() Estimated distance in miles from Baldwinsville's city center to McHarrie Pointe's address, calculated via Google Maps.
Estimated distance in miles from Baldwinsville's city center to McHarrie Pointe's address, calculated via Google Maps.
Add your location
McHarrie Pointe is located in Baldwinsville, New York State.
Here are the financial assistance programs available to residents in New York State.
McHarrie Pointe is in the Town of Lysander neighborhood of Baldwinsville.
McHarrie Pointe is legally operated by Syracuse Home Association.
McHarrie Pointe has a walk score of 79. Very walkable. Most errands can be accomplished on foot, and many essentials are within a short walk.
According to NY state health department records, McHarrie Pointe's license number is 520-E-093.
McHarrie Pointe's occupancy is 75.8%.
No, McHarrie Pointe has a no-pet policy.
McHarrie Pointe is registered as a non-profit in NY.
Care Cost Calculator: See Prices in Your Area
Nursing Home Data Explorer
Don’t Wait Too Long: 7 Red Flag Signs Your Parent Needs Assisted Living Now
The True Cost of Assisted Living in 2025 – And How Families Are Paying For It
Understanding Senior Living Costs: Pricing Models, Discounts & Financial Assistance


