Total health inspections
19
California average 12.5
Last Health inspection on Aug 2025

We arrange tours, appointments, and even moving support so you don’t have to
Thank you for your interest!
Our team will be in touch shortly to help with next steps.
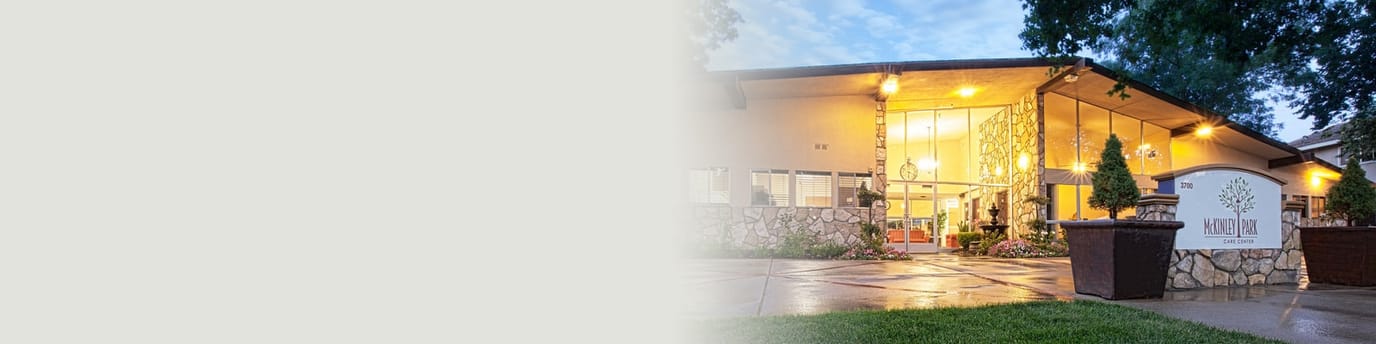
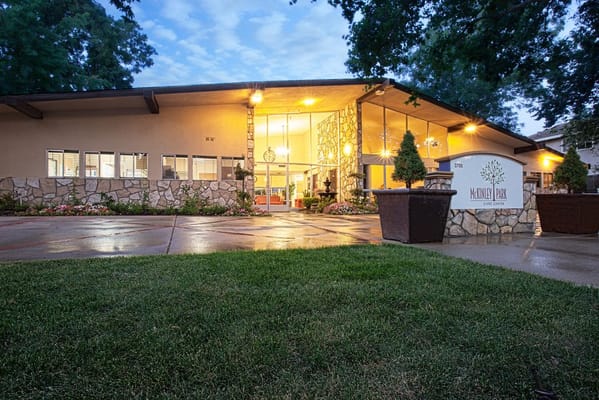


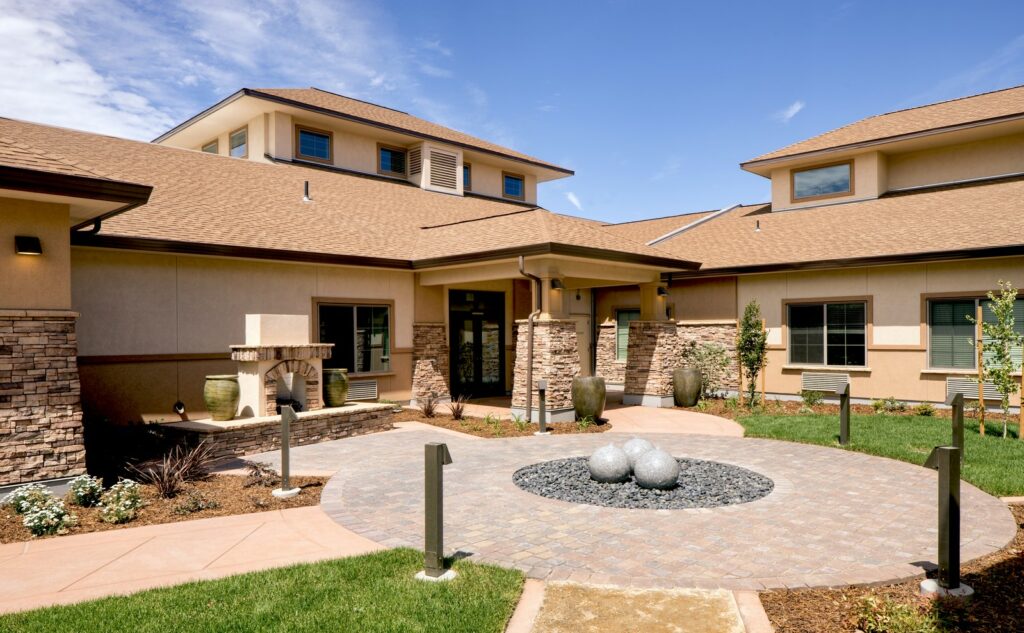
Located in East Sacramento, Mckinley Park Care Center is a post-acute rehabilitation facility that offers top-notch therapy and round-the-clock skilled nursing care services. They have a distinguished Five Star Rating for Registered Nurse staffing, ensuring a Registered Nurse’s presence 24/7. Personalized rehabilitation plans are meticulously crafted for each resident, placing emphasis on their unique abilities, needs, and preferences. Alongside the focus on rehabilitation, they also promote an active mind and body, reflected in the activities thoughtfully organized by the staff to cater to various lifestyles.
Nestled on a picturesque, tree-lined street within one of Sacramento’s most prestigious neighborhoods, Mckinley Park Care Center exudes an air of majesty. The dedicated staff provides compassionate care coupled with unparalleled expertise and their facility’s ambiance create a relaxed and enjoyable environment, ensuring a comfortable stay for every resident.
Your Care is the Licensed Nursing Home Administrator at McKinley Park Care Center, directing all facility operations, staffing, services, and programs. They lead the leadership team to ensure quality care and smooth facility management, working alongside the Medical Director and other department directors to provide comprehensive support to residents.
May offer a more intimate, personalized care environment.
Lower occupancy suggests more openings may be available.
Residents typically stay for brief periods, with frequent admissions and discharges throughout the year.
18% of new residents, usually for short-term rehab.
80% of new residents, often for short stays.
2% of new residents, often for long-term daily care.
Ways to qualify for care at this community, including accepted programs and payment options.
This facility is certified for eligible Medicaid services.
This facility is certified for eligible Medicare services.
In California, the Department of Social Services (for assisted living facilities) and the Department of Public Health (for nursing homes) conduct inspections to ensure resident safety and regulatory compliance.
California average 12.5
Last Health inspection on Aug 2025
California average 50.2
California average 4.65
Health citations are formal notices following inspections when they fail to comply with safety and care standards.
29 of 52 citations resulted from standard inspections; and 23 of 52 resulted from complaint investigations.
California average: 0.4
California average: 1
Data sourced from CMS Health Deficiencies reports. Citation severity codes range from A (least serious) to L (most serious). Immediate Jeopardy (J-L) citations indicate situations where the facility's noncompliance has placed residents at risk of death or serious harm.
Nursing Home Licensed facility providing 24/7 skilled nursing care for residents with complex, ongoing medical needs. Staffed by RNs, LPNs, and CNAs. Inspected and star-rated annually by CMS. Accepts Medicare (short-term rehab) and Medicaid (long-term care).
Assisted Living A licensed, long-term care setting for seniors or individuals with disabilities who need help with daily activities — like bathing, dressing, and medication management — but not 24-hour skilled nursing. Offers housing, meals, and around-the-clock support while aiming to maximize resident independence.
![]() 2.1 miles from city center — 0.21 miles to nearest hospital (Dignity Health - Mercy General Hospital)
2.1 miles from city center — 0.21 miles to nearest hospital (Dignity Health - Mercy General Hospital)
Add your location
This data corresponds to Q2 2025 and is based on CMS Payroll-Based Journal.
California average ratio: 0.00:1
California average: 7.7 hours
Manages medical care and health needs.
No contractors work on this role.
Assists with medical care and medications.
This role is partially covered by contractors.
Helps with daily care and mobility.
This role is partially covered by contractors.
Total hours from contractors
188 contractor hours this quarter
| Certified Nursing Assistant | 49 | 6 | 55 | 15,762 | 91 | 100% | 7.7 |
| Licensed Practical Nurse | 20 | 10 | 30 | 6,376 | 91 | 100% | 8 |
| Registered Nurse | 14 | 0 | 14 | 2,355 | 89 | 98% | 7.1 |
| RN Director of Nursing | 2 | 0 | 2 | 980 | 65 | 71% | 8 |
| Respiratory Therapy Technician | 3 | 0 | 3 | 902 | 67 | 74% | 6.9 |
| Dental Services Staff | 2 | 0 | 2 | 886 | 65 | 71% | 7.8 |
| Other Dietary Services Staff | 4 | 0 | 4 | 813 | 90 | 99% | 6.1 |
| Physical Therapy Aide | 2 | 0 | 2 | 727 | 68 | 75% | 6.5 |
| Speech Language Pathologist | 2 | 0 | 2 | 704 | 61 | 67% | 6.2 |
| Nurse Practitioner | 1 | 0 | 1 | 512 | 64 | 70% | 8 |
| Administrator | 1 | 0 | 1 | 510 | 64 | 70% | 8 |
| Dietitian | 1 | 0 | 1 | 443 | 55 | 60% | 8.1 |
| Therapeutic Recreation Specialist | 1 | 0 | 1 | 403 | 58 | 64% | 7 |
| Physical Therapy Assistant | 2 | 0 | 2 | 181 | 54 | 59% | 3.1 |
| Qualified Social Worker | 2 | 0 | 2 | 73 | 54 | 59% | 1.2 |
Source: CMS Long-Term Care Facility Characteristics (Data as of Jan 2026)
Residents meet regularly to discuss policies, care quality, and activities
Organized group of residents that meets regularly to discuss facility policies, quality of life, and activities.
Data sourced from CMS Long-Term Care Facility Characteristics quarterly report. Payer mix reflects the current resident census by primary payment source.
These measures show how residents usually do over time at this home, based on health outcomes and preventive care.
California average: 6.6
California average: 11.3
California average: 11.1%
California average: 12.0%
California average: 11.3%
California average: 1.7%
California average: 5.0%
California average: 1.2%
California average: 4.2%
California average: 6.7%
California average: 10.1%
California average: 98.5%
California average: 98.2%
California average: 2.25
California average: 1.59
California average: 94.0%
California average: 1.5%
California average: 93.2%
California average: 23.2%
California average: 11.2%
California average: 0.8%
California average: 53.7%
California average: 50.6%
Quality measures are calculated from Minimum Data Set (MDS) assessments. For most measures, lower percentages indicate better care quality.
Federal penalties imposed by CMS for regulatory violations, including civil money penalties (fines) and denials of payment for new Medicare/Medicaid admissions.
Source: CMS Penalties Database (Data as of Jan 2026)
California average: $55K
California average: 2.4
California average: 0.5
Penalties are imposed by CMS for violations of federal nursing home regulations.
Last updated: Jan 2026
Historical financial and operational data for McKinley Park Care Center based on CMS SNF Cost Reports.
Loading trend charts...
Care Cost Calculator: See Prices in Your Area
Nursing Home Data Explorer
Don’t Wait Too Long: 7 Red Flag Signs Your Parent Needs Assisted Living Now
The True Cost of Assisted Living in 2025 – And How Families Are Paying For It
Understanding Senior Living Costs: Pricing Models, Discounts & Financial Assistance

Touring a community? Use this expert-backed checklist to stay organized, ask the right questions, and find the perfect fit.
We'll send you a PDF version of the touring checklist.