


Total health inspections
17
California average 12.5
Last Health inspection on Aug 2025
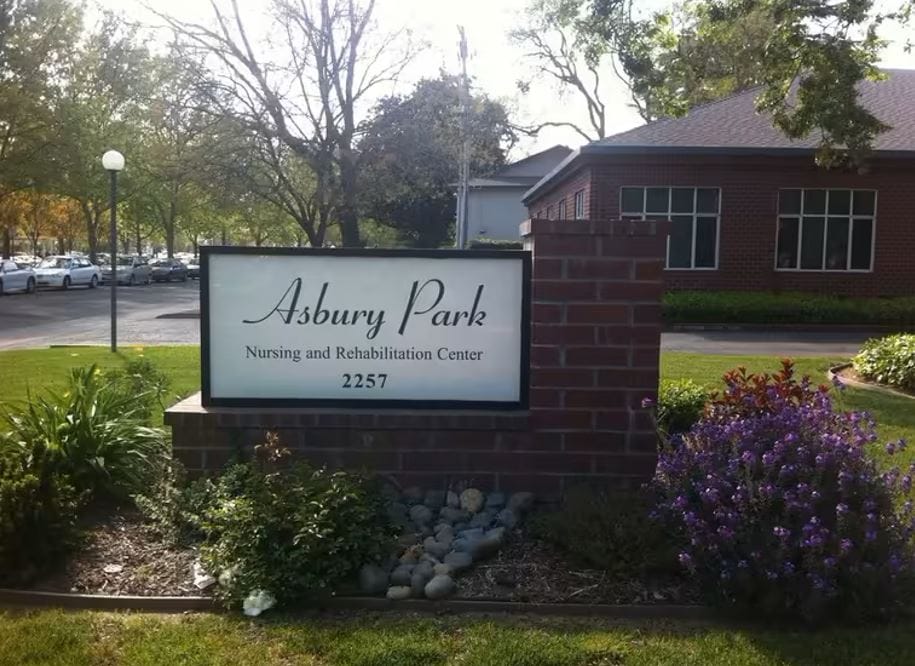
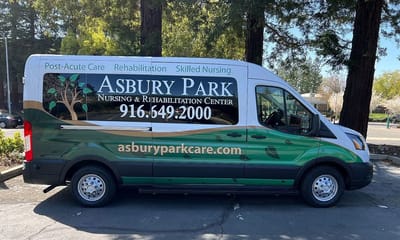
Asbury Park Nursing and Rehabilitation Center is a well-established 139-bed Medicare and Medi-Cal certified skilled nursing facility situated in Sacramento. Led by an experienced management team with a focus on Post-Acute Care, this assisted living community stands out as a leader in rehabilitation services.
Asbury Park offers 24/7 skilled care and rehabilitation services, catering to diverse resident needs. Additionally, their professional team assists seniors on their journey to recovery from surgery, injuries, or serious illnesses, fostering a comforting and nurturing atmosphere for both short-term treatment and long-term care. They also empower senior residents to achieve increased independence through personalized programs, while their social services team actively supports patients and their families during transitional periods, ensuring each resident receives the best possible care and support throughout their stay.
| Staff type | Hours / Day / Resident | vs state avg |
|---|---|---|
|
Registered Nurse (RN)
| 45m per day | ▲ 14% State avg: 39m per day · National avg: 41m per day |
|
LPN / LVN
| 1h 0m per day | ▼ 18% State avg: 1h 13m per day · National avg: 52m per day |
|
Nurse Aide
| 2h 41m per day | ■ Avg State avg: 2h 39m per day · National avg: 2h 21m per day |
|
Weekend Total Nursing
| 4h 3m per day | ■ Avg State avg: 4h 5m per day · National avg: 3h 26m per day |
|
Physical Therapist
| 3m per day | ▼ 41% State avg: 5m per day · National avg: 4m per day |
|
Weekend RN
| 35m per day | ▲ 16% State avg: 30m per day · National avg: 29m per day |
Key information about the people who lead and staff this community.
In California, the Department of Social Services (for assisted living facilities) and the Department of Public Health (for nursing homes) conduct inspections to ensure resident safety and regulatory compliance.
California average 12.5
Last Health inspection on Aug 2025
California average 50.2
California average 4.65
Health citations are formal notices following inspections when they fail to comply with safety and care standards.
28 of 50 citations resulted from standard inspections; and 22 of 50 resulted from complaint investigations.
California average: 0.4
California average: 1
Reporting period: October 1 – December 31, 2025 (Q4 2025). Source: CMS Payroll-Based Journal report.
Manages medical care and health needs.
Assists with medical care and medications.
Helps with daily care and mobility.
Total hours from contractors
670 contractor hours this quarter
| Certified Nursing Assistant | 94 | 1 | 95 | 32,525 | 92 | 100% | 7.9 |
| Licensed Practical Nurse | 33 | 33 | 66 | 11,268 | 92 | 100% | 7.8 |
| Registered Nurse | 17 | 0 | 17 | 6,771 | 92 | 100% | 7.7 |
| Clinical Nurse Specialist | 6 | 0 | 6 | 1,820 | 86 | 93% | 7.4 |
| Physical Therapy Aide | 4 | 0 | 4 | 1,118 | 73 | 79% | 7.7 |
| RN Director of Nursing | 2 | 0 | 2 | 1,023 | 64 | 70% | 8.1 |
| Speech Language Pathologist | 3 | 0 | 3 | 1,006 | 78 | 85% | 6.4 |
| Mental Health Service Worker | 2 | 0 | 2 | 956 | 70 | 76% | 8.1 |
| Physical Therapy Assistant | 3 | 0 | 3 | 892 | 86 | 93% | 5.5 |
| Other Dietary Services Staff | 2 | 0 | 2 | 892 | 70 | 76% | 7.7 |
| Respiratory Therapy Technician | 4 | 0 | 4 | 604 | 74 | 80% | 6.8 |
| Therapeutic Recreation Specialist | 1 | 0 | 1 | 585 | 66 | 72% | 8.9 |
| Qualified Social Worker | 2 | 0 | 2 | 566 | 64 | 70% | 6.1 |
| Nurse Practitioner | 1 | 0 | 1 | 512 | 64 | 70% | 8 |
| Nurse Aide in Training | 1 | 0 | 1 | 409 | 47 | 51% | 8.7 |
| Occupational Therapy Aide | 1 | 0 | 1 | 408 | 51 | 55% | 8 |
| Dietitian | 1 | 0 | 1 | 344 | 43 | 47% | 8 |
| Qualified Activities Professional | 1 | 0 | 1 | 32 | 5 | 5% | 6.4 |
| Medical Director | 0 | 1 | 1 | 28 | 6 | 7% | 4.7 |
Federal penalties imposed by CMS for regulatory violations, including civil money penalties (fines) and denials of payment for new Medicare/Medicaid admissions.
Source: CMS Penalties Database
No penalties in the past 3 years
No civil money penalties or payment denials were reported in the last 3 years.
These measures show how residents usually do over time at this home, based on health outcomes and preventive care.
California average: 6.6
California average: 11.3
California average: 11.1%
California average: 12.0%
California average: 11.3%
California average: 1.7%
California average: 5.0%
California average: 1.2%
California average: 4.2%
California average: 6.7%
California average: 10.1%
California average: 98.5%
California average: 98.2%
California average: 2.25
California average: 1.59
California average: 94.0%
California average: 1.5%
California average: 93.2%
California average: 23.2%
California average: 11.2%
California average: 0.8%
California average: 53.7%
California average: 50.6%
Quality measures are calculated from Minimum Data Set (MDS) assessments. For most measures, lower percentages indicate better care quality.
26% of new residents, usually for short-term rehab.
66% of new residents, often for short stays.
7% of new residents, often for long-term daily care.
Source: CMS Long-Term Care Facility Characteristics (Data as of Jan 2026)
Residents meet regularly to discuss policies, care quality, and activities
Organized group of residents that meets regularly to discuss facility policies, quality of life, and activities.
Data sourced from CMS Long-Term Care Facility Characteristics quarterly report. Payer mix reflects the current resident census by primary payment source.
Historical financial and operational data for Asbury Park Nursing and Rehabilitation Center from 2011–2023, based on CMS SNF Cost Reports.
Key figures below are for fiscal year ending in 12/2023.
Based on CMS SNF Cost Report for fiscal year ending in 12/2023.
Residents typically stay for brief periods, with frequent admissions and discharges throughout the year.
Most new residents arrive under private pay (66% of admissions), and a typical private pay stay runs around 30 days.
Coverage residents most often arrive under.
Coverage residents most often leave under.
![]() 4.4 miles from city center
4.4 miles from city center
![]() Estimated distance in miles from Sacramento's city center to Asbury Park Nursing and Rehabilitation Center's address, calculated via Google Maps.
Estimated distance in miles from Sacramento's city center to Asbury Park Nursing and Rehabilitation Center's address, calculated via Google Maps.
Add your location
The information below is reported by the California Department of Social Services and Department of Public Health.
| Advanced Health Care of Sacramento | NH SNF | Sacramento (North Sacramento) | 40
Facility
40
CA AVG
104
Rank
#1198 / 1644 |
98.3%
Facility
98.3%
CA AVG
73.9
Rank
#158 / 1492 | +33% | 4.52
Facility
4.52
CA AVG
4.22
Rank
#88 / 327 | +54% | +7% | $7.4k
Facility
$7.4k
CA AVG
$56.5k
Rank
#205 / 334 | - | 26
Facility
26
CA AVG
50.2
Rank
#79 / 327 | 2.4
Facility
2.4
CA AVG
4.6
Rank
#22 / 327 | 1 | 39 | - |
55
Facility
55
CA AVG
57
Rank
#1213 / 2087 | Ashkan Javaheri | $13.8MFiscal year ending 12/2023
Facility
$13.8MFiscal year ending 12/2023
CA AVG
$17.0M
Rank
#171 / 327 | $5.9MFiscal year ending 12/2023
Facility
$5.9MFiscal year ending 12/2023
CA AVG
$7.0M
Rank
#250 / 327 | 42.9%Fiscal year ending 12/2023
Facility
42.9%Fiscal year ending 12/2023
CA AVG
45.2%
Rank
#283 / 327 | 555913 | ||||
| Woodside Healthcare Center | NH RC SNF | Sacramento (Arden-Arcade) | 58
Facility
58
CA AVG
104
Rank
#1093 / 1644 |
94.8%
Facility
94.8%
CA AVG
73.9
Rank
#216 / 1492 | +28% | 4.46
Facility
4.46
CA AVG
4.22
Rank
#88 / 327 | -16% | +6% | $0
Facility
$0
CA AVG
$56.5k
Rank
#1 / 334 | - | 21
Facility
21
CA AVG
50.2
Rank
#42 / 327 | 7.0
Facility
7.0
CA AVG
4.6
Rank
#301 / 327 | - | 55 | - |
78
Facility
78
CA AVG
57
Rank
#485 / 2087 | - | $10.3MFiscal year ending 12/2023
Facility
$10.3MFiscal year ending 12/2023
CA AVG
$17.0M
Rank
#295 / 327 | $5.2MFiscal year ending 12/2023
Facility
$5.2MFiscal year ending 12/2023
CA AVG
$7.0M
Rank
#261 / 327 | 51%Fiscal year ending 12/2023
Facility
51%Fiscal year ending 12/2023
CA AVG
45.2%
Rank
#23 / 327 | 555798 | ||||
| Eskaton Care Center Greenhaven | NH RC SNF | Sacramento (Southwestern Sacramento) | 148
Facility
148
CA AVG
104
Rank
#381 / 1644 |
94.8%
Facility
94.8%
CA AVG
73.9
Rank
#216 / 1492 | +28% | 4.75
Facility
4.75
CA AVG
4.22
Rank
#65 / 327 | -6% | +13% | $0
Facility
$0
CA AVG
$56.5k
Rank
#1 / 334 | - | 61
Facility
61
CA AVG
50.2
Rank
#250 / 327 | 2.2
Facility
2.2
CA AVG
4.6
Rank
#12 / 327 | - | 140 | - |
70
Facility
70
CA AVG
57
Rank
#739 / 2087 | - | $13.9M*Fiscal year ending 12/2022These figures are from this home's most recent complete cost report — an older period than most facilities report. Compare with that in mind.
Facility
$13.9M*Fiscal year ending 12/2022These figures are from this home's most recent complete cost report — an older period than most facilities report. Compare with that in mind.
CA AVG
$17.0M
Rank
#146 / 327 | $12.0M*Fiscal year ending 12/2022These figures are from this home's most recent complete cost report — an older period than most facilities report. Compare with that in mind.
Facility
$12.0M*Fiscal year ending 12/2022These figures are from this home's most recent complete cost report — an older period than most facilities report. Compare with that in mind.
CA AVG
$7.0M
Rank
#32 / 327 | 85.8%*Fiscal year ending 12/2022These figures are from this home's most recent complete cost report — an older period than most facilities report. Compare with that in mind.
Facility
85.8%*Fiscal year ending 12/2022These figures are from this home's most recent complete cost report — an older period than most facilities report. Compare with that in mind.
CA AVG
45.2%
Rank
#6 / 327 | 555098 | ||||
| Asbury Park Nursing and Rehabilitation Center | NH SNF | Sacramento | 139
Facility
139
CA AVG
104
Rank
#443 / 1644 |
96.4%
Facility
96.4%
CA AVG
73.9
Rank
#180 / 1492 | +31% | 4.29
Facility
4.29
CA AVG
4.22
Rank
#116 / 327 | -10% | +2% | $0
Facility
$0
CA AVG
$56.5k
Rank
#1 / 334 | - | 50
Facility
50
CA AVG
50.2
Rank
#206 / 327 | 2.9
Facility
2.9
CA AVG
4.6
Rank
#54 / 327 | 1 | 134 | - |
77
Facility
77
CA AVG
57
Rank
#509 / 2087 | Doug Hawkins | $23.8MFiscal year ending 12/2023
Facility
$23.8MFiscal year ending 12/2023
CA AVG
$17.0M
Rank
#107 / 327 | $12.0MFiscal year ending 12/2023
Facility
$12.0MFiscal year ending 12/2023
CA AVG
$7.0M
Rank
#47 / 327 | 50.5%Fiscal year ending 12/2023
Facility
50.5%Fiscal year ending 12/2023
CA AVG
45.2%
Rank
#65 / 327 | 555673 | ||||
| Windsor Care Center of Sacramento | NH | Sacramento (North Sacramento) | 128
Facility
128
CA AVG
104
Rank
#505 / 1644 |
97.7%
Facility
97.7%
CA AVG
73.9
Rank
#162 / 1492 | +32% | 6.73
Facility
6.73
CA AVG
4.22
Rank
#5 / 327 | +12% | +59% | $0
Facility
$0
CA AVG
$56.5k
Rank
#1 / 334 | - | 60
Facility
60
CA AVG
50.2
Rank
#248 / 327 | 3.0
Facility
3.0
CA AVG
4.6
Rank
#58 / 327 | 1 | 125 | - |
60
Facility
60
CA AVG
57
Rank
#1048 / 2087 | - | $13.1MFiscal year ending 12/2023
Facility
$13.1MFiscal year ending 12/2023
CA AVG
$17.0M
Rank
#196 / 327 | $7.5MFiscal year ending 12/2023
Facility
$7.5MFiscal year ending 12/2023
CA AVG
$7.0M
Rank
#180 / 327 | 57.2%Fiscal year ending 12/2023
Facility
57.2%Fiscal year ending 12/2023
CA AVG
45.2%
Rank
#139 / 327 | 555717 |
Asbury Park Nursing and Rehabilitation Center is located in Sacramento, California.
Here are the financial assistance programs available to residents in California.
Asbury Park Nursing and Rehabilitation Center has a walk score of 77. Very walkable. Most errands can be accomplished on foot, and many essentials are within a short walk.
Asbury Park Nursing and Rehabilitation Center's occupancy is 93.4%.
Asbury Park Nursing and Rehabilitation Center has been operating for approximately 29 years, based on available licensing and registration records.
No, Asbury Park Nursing and Rehabilitation Center has a no-pet policy.
Asbury Park Nursing and Rehabilitation Center is registered as a for-profit in CA.
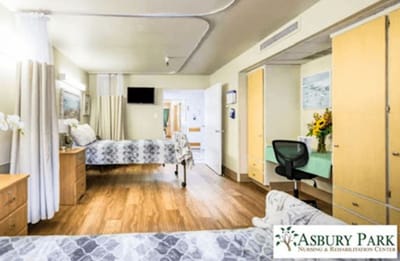
Yes — there are 5 photos of Asbury Park Nursing and Rehabilitation Center in the photo gallery on this page.
Asbury Park Nursing and Rehabilitation Center is located at 2257 Fair Oaks Blvd, Sacramento, CA 95825.
Care Cost Calculator: See Prices in Your Area
Nursing Home Data Explorer
Don’t Wait Too Long: 7 Red Flag Signs Your Parent Needs Assisted Living Now
The True Cost of Assisted Living in 2025 – And How Families Are Paying For It
Understanding Senior Living Costs: Pricing Models, Discounts & Financial Assistance


